My Account
My Slides
Search by Category
Templates
Leave Feedback
Login
Logout
Get Started
Browse all Slides
Browse all Slides
Create a FREE Account
Instant access to 1,000+ real slides from top companies like McKinsey, BCG, Goldman Sachs, Google and many more!
First Name
Last Name
Email
Password
I agree to all
Terms & Privacy Policy
Thank you! Your submission has been received!
Oops! Something went wrong while submitting the form.
Have an account?
Sign in
Saved Slides
This slide features a complex graph tracking GDP changes across countries with reference to industrial revolutions. The bold title is complemented by a timeline and legend. Design is data-heavy, with an inset quote and photo on the top right. The blue and black color scheme maintains a professional appearance.
Financial Performance
Technology & Software
Highlighting the economic impact of technological advancements, this slide provides a historical perspective by correlating GDP growth with industrial revolutions. It presents a data-driven analysis ideal for discussions on technology’s role in economic development and the potential future implications of the ongoing Fourth Industrial Revolution. This could be used to support investment strategies or policy-making in tech sectors.
Technology, GDP, Economic Impact, Data Analysis, Industrial Revolution, Growth, Historical, Investment
Mixed Chart
McKinsey
Saved
This slide shows a combination of line and column charts tracking growth and returns over the years, specifically highlighting the receivables CAGR and RoTE. It uses a blue color theme that is consistent with the corporate branding, and the charts are well-organized to depict trends clearly.
Financial Performance
Financial Services
Reviews Barclays' historical financial performance, emphasizing growth in receivables and RoTE over time. It highlights the impact of external factors like COVID-19 and shows the company's resilience and capacity for recovery.
financial growth, RoTE, receivables, historical data, COVID-19
Single Chart
Barclays
Saved
Several charts and graphs detailing demographics, spending patterns, and frequent touchpoints of heavy-spending consumers. The layout is dense with data, including pie charts and bar graphs.
Market Analysis and Trends
Consumer Goods
Provides an overview of the demographic and spending behavior of heavy-spending consumers in high-tier cities. Emphasizes the importance of WeChat as a touchpoint and the close brand connections of this consumer segment.
Heavy-spending consumers, demographics, high-tier cities, WeChat, brand connection
Multiple Chart
BCG
Saved
Pie chart and bullet points detailing emissions reduction methods and economic benefits. Text highlights farmer contributions and potential income from carbon projects.
Technology and Digital Transformation
Agriculture & Food Production
Highlights the role of Australian farmers in reducing emissions through various technologies and practices, emphasizing economic and environmental benefits.
Farmers, Emissions Reduction, Agriculture, Technology, Carbon Projects, Economic Benefits, Environmental Impact
Multiple Chart
EY
Saved
Provides a detailed case study of Jejak.in with photos, icons, and data points about their programs and achievements in forest conservation in Indonesia.
Market Analysis and Trends
Environmental Services & Sustainability
Slide presents a case study on Jejak.in's efforts in forest conservation using digital monitoring and carbon credits, suitable for discussions on technological impacts on environmental efforts.
Indonesia, forest conservation, Jejak.in, case study, carbon sequestration, digital monitoring, technology, carbon credits
Header Vertical
Bain
Saved
This slide contains two visualizations: a column chart showing consensus forecasts for real GDP growth and a line chart illustrating Composite Purchasing Managers’ Index (PMI) for the UK, Eurozone, Japan, US, and China.
Market Analysis and Trends
Financial Services
The slide provides data on global GDP growth forecasts for 2023 and 2024, along with PMI trends for major economies, useful for understanding economic performance and future expectations.
GDP growth, PMI, global economy, economic performance, trends
Multiple Chart
JP Morgan
Saved
This slide includes comparative data in blue bar charts and two columns with demographics and geographical segmentation. It provides a contrast in online spending between HVUs and non-HVUs in Vietnam. Source includes Bain analysis.
Market Analysis and Trends
Technology & Software
The slide compares online spending habits of high-value users (HVUs) to non-HVUs in Vietnam, useful for understanding consumer segmentation and targeting strategies in the digital economy.
Vietnam, High-Value Users, Consumer Spending, Digital Economy, Online Spend, Demographic Analysis, Geographic Segmentation, Market Research, Spending Habits
Multiple Chart
Bain
Saved
The slide features a complex, data-driven layout with multiple column charts comparing the 2020 and 2027 market sizes of different xEV segments (HEV, PHEV, BEV). It also includes text boxes with key insights, and a map representation of segment growth. Colors are used to differentiate segments.
Market Analysis and Trends
Transportation & Logistics
This slide analyzes the electric vehicle market, highlighting the growth projections for different sub-segments like HEV, PHEV, and BEV by 2027. It emphasizes BEVs as having the highest potential growth, supported by changes in regulations and advancements in technology.
xEV, market growth, HEV, PHEV, BEV, 2027 projections, environmental regulations, technology advancement
Mixed Chart
PwC/Strategy&
Saved
Column chart show deposit amounts and percentages by channels from Q4 2019 to Q1 2022 and deposit target goals for 2024. An arrow indicates a significant increase in deposits through strategic channels, accompanied by explanatory text.
Financial Performance
Financial Services
Showcases the increase in deposits over time, focusing on the strategic channels contributing to growth. It sets forth target goals for consumer and transaction banking deposits by 2024, reflecting the company's ambitions and market analysis efforts.
deposit growth, strategic channels, 2024 targets, market analysis, column chart
Mixed Chart
Goldman Sachs
Saved
Two charts illustrating earnings growth rates and growth estimates for global equities, comparing various regions and future projections.
Investment Analysis
Financial Services
The slide focuses on the earnings growth and future revisions for global equities, highlighting trends and forecasts for different geographical markets.
global equities, earnings growth, revisions, forecasts, regions
Multiple Chart
JP Morgan
Saved
Features a line graph showing past and predicted future spending on social media, with spikes and trends annotated.
Market Analysis and Trends
Professional Services
Projects growth in social media spending, essential for investment strategies and market trend analysis in consumer services and media industries.
social media, spending, forecast, growth, investment, trend, analysis, consumer services, media, strategy
Mixed Chart
Deloitte
Saved
The slide has a text block on the left and three growing bar charts on the right, representing growth in different types of workers.
Financial Performance
Professional Services
Highlights the growth in contractor, freelancer, and gig worker use from Deloitte’s HC Trends report. Could be used to discuss strategic planning and workforce transformation financials.
Planning, Workforce, Trends, Gig Economy
Pillar
Deloitte
Saved
Simple layout with a single column chart illustrating consumer responses to purchasing second-hand luxury items.
Market Analysis and Trends
Retail & E-commerce
Focuses on the reasons driving consumer interest in second-hand luxury products, including perceived value and exclusivity.
Second-hand luxury, consumer behavior, purchasing reasons, perceived value, exclusivity, market insights, consumer trends
Mixed Chart
BCG
Saved
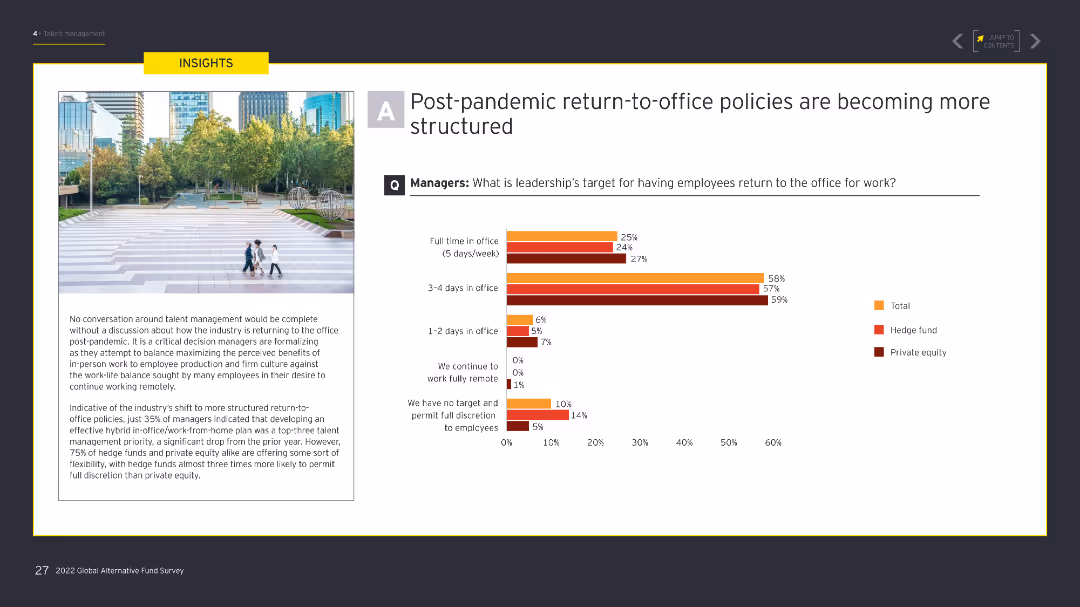
The slide features a column chart illustrating leadership's targets for employees returning to the office post-pandemic. An image on the left shows an outdoor urban setting with people walking. The chart uses shades of orange and red.
Human Resources and Talent Management
Financial Services
The slide outlines how leadership is targeting different levels of in-office presence post-pandemic, with a significant focus on structured return-to-office policies to balance remote work and office work.
Return-to-office, post-pandemic, remote work, office policies, leadership targets
Mixed Chart
EY
Saved
A scatter plot showing changes in usage by platform, highlighting shifts in viewer behavior towards digital content and away from traditional TV.
Market Analysis and Trends
Media & Entertainment
The slide demonstrates the impact of streaming growth on traditional TV viewership, with digital content consumption becoming more frequent and impactful.
streaming, growth, traditional TV, digital content, behavior
Mixed Chart
Nielsen
Saved
A text-heavy slide that incorporates a bar graph, showing the increasing percentage share of the Tempest programme in UK Combat Air activities. The use of red to denote the data is effective, and the overall design is clean and straightforward.
Market Analysis and Trends
Industrial & Manufacturing
Analyzes the growth in employment and GVA contributions of the Tempest programme over time, forecasting its increasing significance in the Combat Air sector.
Tempest, UK Combat Air, employment, GVA, growth, forecast, economic contribution, market share
Mixed Chart
PwC/Strategy&
Saved
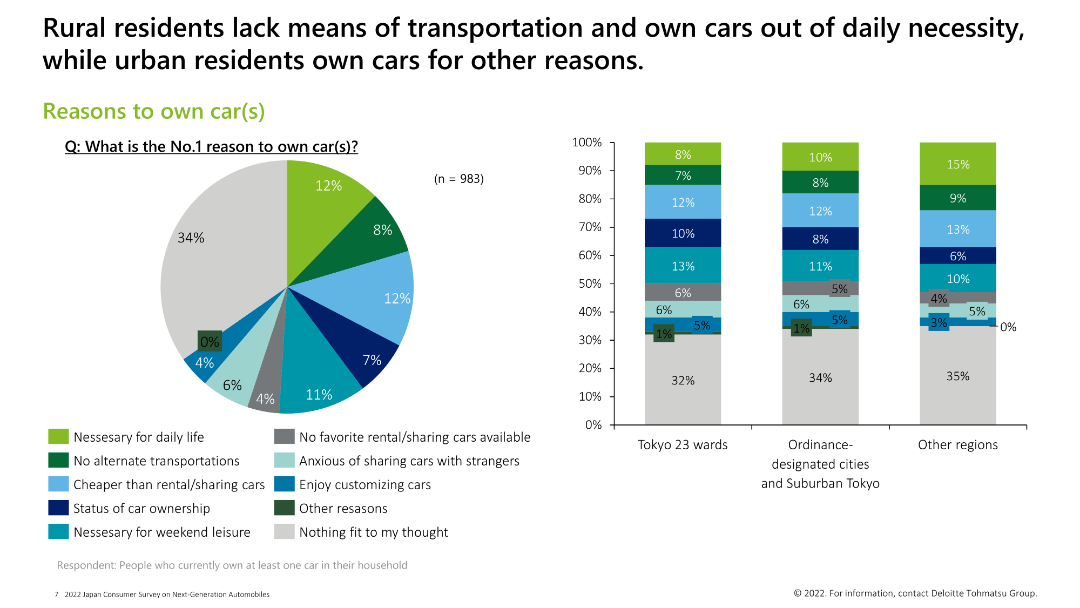
Contains a pie chart and three column charts showing various reasons people own cars, categorized by region.
Market Analysis and Trends
Consumer Goods
The slide highlights the primary reasons for car ownership, such as daily necessity, lack of alternative transportation, and personal preferences.
car ownership reasons, necessity, transportation, preferences
Multiple Chart
Deloitte
Saved
Consists of two pie charts and two column charts showing the composition and quarterly movement of Level 3 assets and liabilities, with textual highlights.
Financial Performance
Financial Services
Analyzes the financial instruments classified as Level 3 assets and liabilities, detailing their valuation uncertainty and movements over the quarter.
assets, liabilities, financial, Level 3, risk management, valuation, uncertainty, banking
Multiple Chart
Deutsche Bank
Saved
This slide features a column chart comparing revenue forecasts for different gaming segments from 2019 to 2024, alongside a line graph depicting consumer spending in these segments. The visualization aids in understanding the scale and growth trajectory of gaming in India, marked by clear, distinct colors for each segment.
Market Analysis and Trends
Media & Entertainment
Explores the rapid expansion of the gaming sector in India, breaking down revenue projections by segment and consumer spending patterns. It's crucial for stakeholders in the gaming industry for evaluating market potentials, identifying high-growth segments, and planning strategic initiatives to capture market share in a fast-evolving landscape.
gaming, market growth, India, consumer spending
Multiple Chart
PwC/Strategy&
Saved
Includes a complex layout with a column chart, text annotations, icons indicating outlook, and a detailed breakdown of governmental commitments and recommended actions.
Regulatory and Compliance
Energy & Utilities
Examines Vietnam's climate goals and strategies, discussing emissions profiles, government commitments, and suggested actions for clearer energy policies.
Vietnam, renewable energy, government, emissions, climate policy
Mixed Chart
Bain
Saved
Slide with iconographic bullet points detailing digital features for home buying and refinancing, and bar charts depicting customer acquisition and retention metrics.
Technology and Digital Transformation
Financial Services
Highlights the digitalization efforts and successes in home lending services, suitable for presenting technological advancement in banking services.
Digitalization, Home Buying, Customer Retention, Banking Services
Table
JP Morgan
Saved
A column chart comparing the total expense ratios (TER) of various Swiss real estate funds based on market value, with a reference line for average TER.
Financial Performance
Financial Services
This slide compares the total expense ratios (TER) of Swiss real estate funds, adjusted for market value, showcasing the operational cost differences between funds.
Expense Ratios, TER, Market Value, Real Estate Funds, Cost Comparison
Single Chart
Credit Suisse
Saved
The slide shows a vertical bar chart comparing the percentage of people agreeing with the statement about the importance of the internet across various countries.
Market Analysis and Trends
Technology & Software
The slide highlights global survey results indicating a widespread recognition of the importance of the internet in people's lives.
Internet, technology, global survey, public opinion, internet importance
Multiple Chart
IPSOS
Saved
The slide is divided into two sections titled "Start here" and "Get there". Each section contains a list with icons, detailing steps and goals for adopting new payment solutions.
Operational Efficiency
Technology & Software
Discusses steps for adopting contactless payments and tailoring technology to business needs, which could be useful for strategic planning or operational efficiency discussions.
contactless payments, business strategy, technology adoption, operational efficiency, strategic planning
Boxed
JP Morgan
Saved
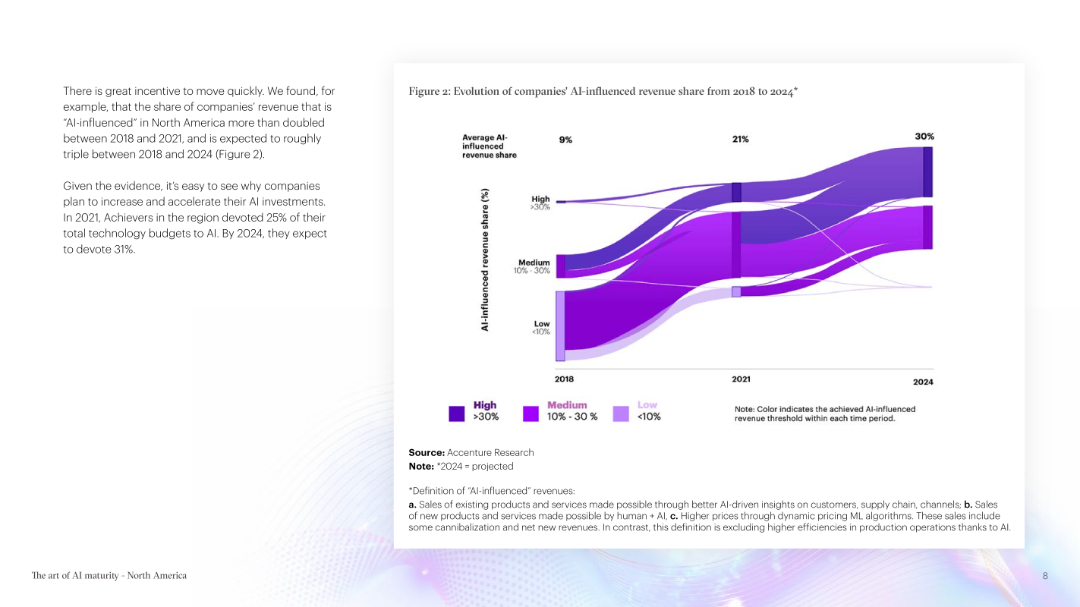
The slide includes text and a flow chart displaying the evolution of AI-influenced revenue share. The color scheme is purple and white.
Technology and Digital Transformation
Technology & Software
The slide highlights the increasing influence of AI on company revenue, presenting projected data on AI investments and their expected impact by 2024.
AI Revenue, AI Influence, Technology Investment, Projected Data, Revenue Growth, Technology
Mixed Chart
Accenture
Saved
Previous
Next
If nothing, comes up, please save your slides first
Create a FREE account to continue browsing
Receive Instant Access to 1,000+ slides from companies like McKinsey, Google, and Goldman Sachs
First Name
Last Name
Email
Password
I agree to all
Terms & Privacy Policy
Thank you! Your submission has been received!
Oops! Something went wrong while submitting the form.
Have an account?
Sign in
Column Chart
Heatmap
Chevron
Org Chart
Infographic
Callouts
Timeline
List
Graphic
Picture
Process Flow
Diagram
Paragraph
Map
Table
Framework
Subtitle
Takeaway Box
Icon
Other Chart
Radar Chart
Waterfall Chart
Mekko Chart
Pie Chart
Scatter Plot
Line Chart
Bar chart
Bullet points