My Account
My Slides
Search by Category
Templates
Leave Feedback
Login
Logout
Get Started
Browse all Slides
Browse all Slides
Create a FREE Account
Instant access to 1,000+ real slides from top companies like McKinsey, BCG, Goldman Sachs, Google and many more!
First Name
Last Name
Email
Password
I agree to all
Terms & Privacy Policy
Thank you! Your submission has been received!
Oops! Something went wrong while submitting the form.
Have an account?
Sign in
Saved Slides
This slide uses column charts to compare ICT teaching hours and the number of students receiving practical ICT classes before and after adopting solar power, indicating significant improvements in both metrics.
Strategic Planning
Education & Training
This slide provides compelling evidence of the benefits of solar power adoption in schools, showing improvements in ICT teaching hours and increased student participation. It advocates for broader implementation of solar solutions to enhance educational outcomes.
Solar Power, ICT, Education, Nigeria, Improvement
Multiple Chart
BCG
Saved
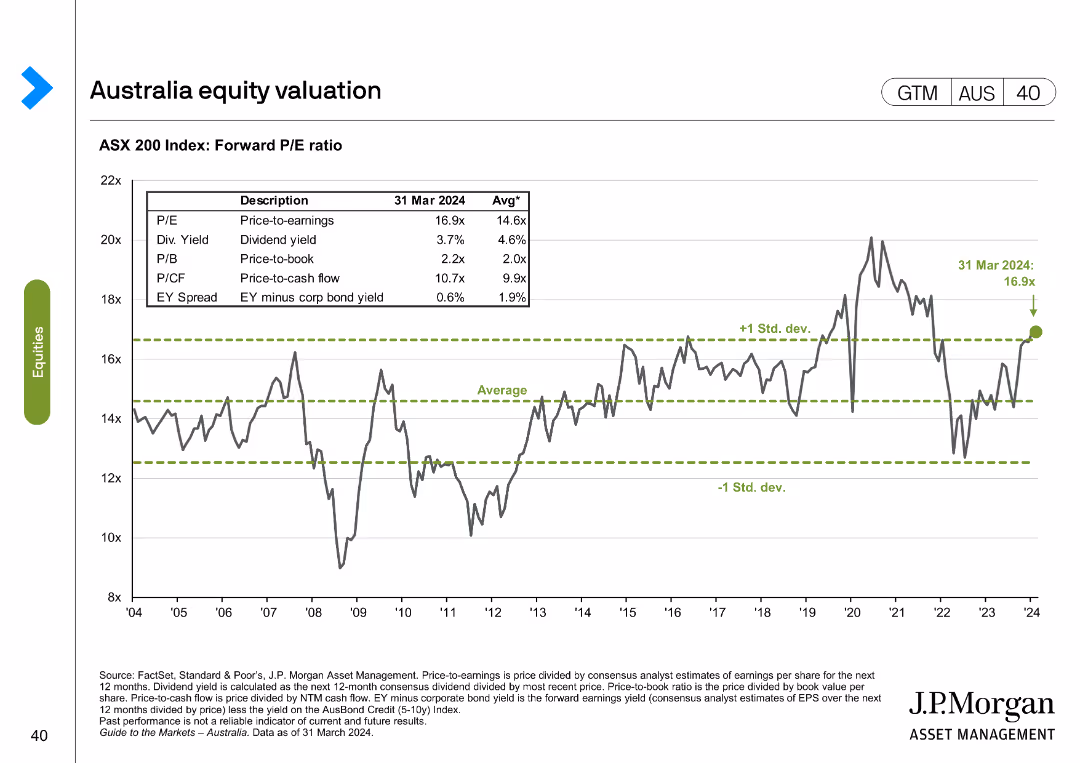
The slide presents a line chart with ASX 200 Index forward P/E ratio over time and a table with different valuation metrics as of March 2024 compared to historical averages.
Financial Performance
Financial Services
This slide evaluates the ASX 200 Index's forward P/E ratio and other valuation metrics, comparing current figures to historical averages.
ASX 200, valuation, metrics, forward P/E, historical
Single Chart
JP Morgan
Saved
This slide showcases bar graphs comparing manufacturing PMI before, during, and after COVID-19, with a color gradient for performance levels.
Market Analysis and Trends
Industrial & Manufacturing
Analyzes the manufacturing PMI to illustrate the economic impact of COVID-19 on different countries and recovery momentum.
PMI, manufacturing, economic impact, COVID-19, recovery
Multiple Chart
BCG
Saved
A column chart showing year-over-year percentage change in real GDP from 2022 to 2025F for BRICS countries and other regions including China, India, LatAm, Brazil, Mexico, ASEAN, MENA, and SSA. Colors represent different years.
Market Analysis and Trends
Financial Services
The slide highlights economic challenges for BRICS in 2024, with India leading growth, China facing structural headwinds, and Brazil and South Africa showing below-trend growth.
BRICS, economic challenges, GDP, 2024, growth forecast, structural headwinds
Single Chart
EY
Saved
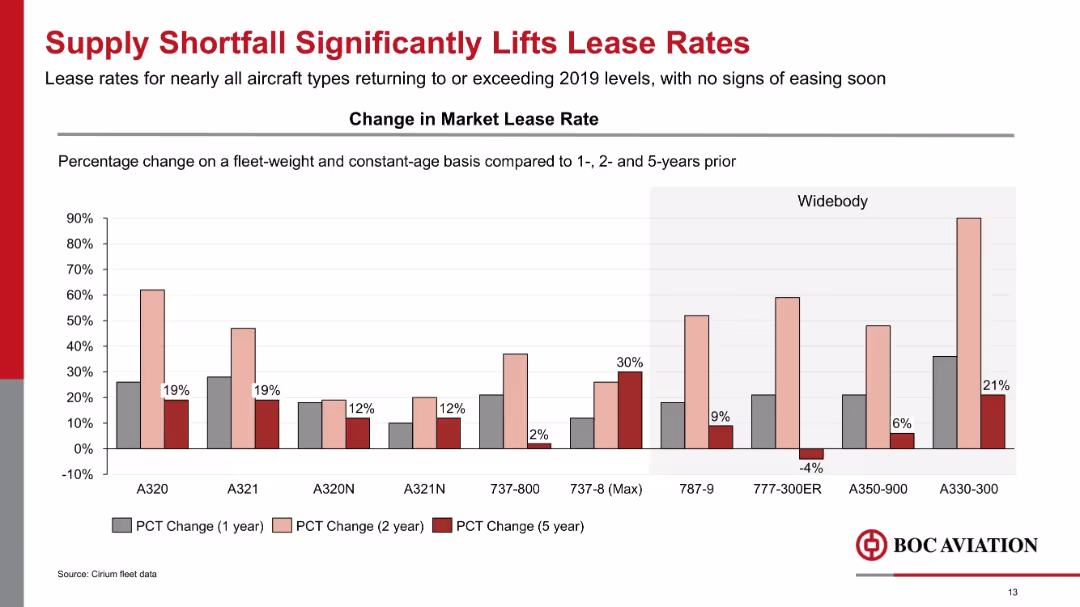
Bar chart showing percentage change in market lease rates for various aircraft types over 1, 2, and 5-year spans.
Pricing Strategies
Transportation & Logistics
Lease rates for aircraft have significantly increased due to supply constraints, with widebodies like A330-300 showing the largest rise. Most models now exceed 2019 lease levels, driven by market shortfalls and high demand.
lease rates, supply shortfall, pricing, A320, A330, widebody, narrowbody, aircraft leasing
Single Chart
Goldman Sachs
Saved
Includes a world map showing global trade flows with a focus on intraregional and interregional exports. Regions are differentiated by color with accompanying pie charts indicating the percentage share of trade.
Market Analysis and Trends
Financial Services
Offers a visual summary of global and regional trade flows, highlighting the importance of intraregional trade. Useful in discussions on global market dynamics and international trade policies.
trade, global, regional, exports, integration
Multiple Chart
Roland Berger
Saved
Features a data table with revenue, client numbers, deposits, and income figures, as well as diagrams depicting business segments and LOBs.
Financial Performance
Financial Services
Provides a snapshot of the firm’s performance in the payments sector, showing revenue, clients, and income data.
Payments, Revenue, Clients, Deposits, Income, Corporate Banking, Treasury Services
Header Horizontal
JP Morgan
Saved
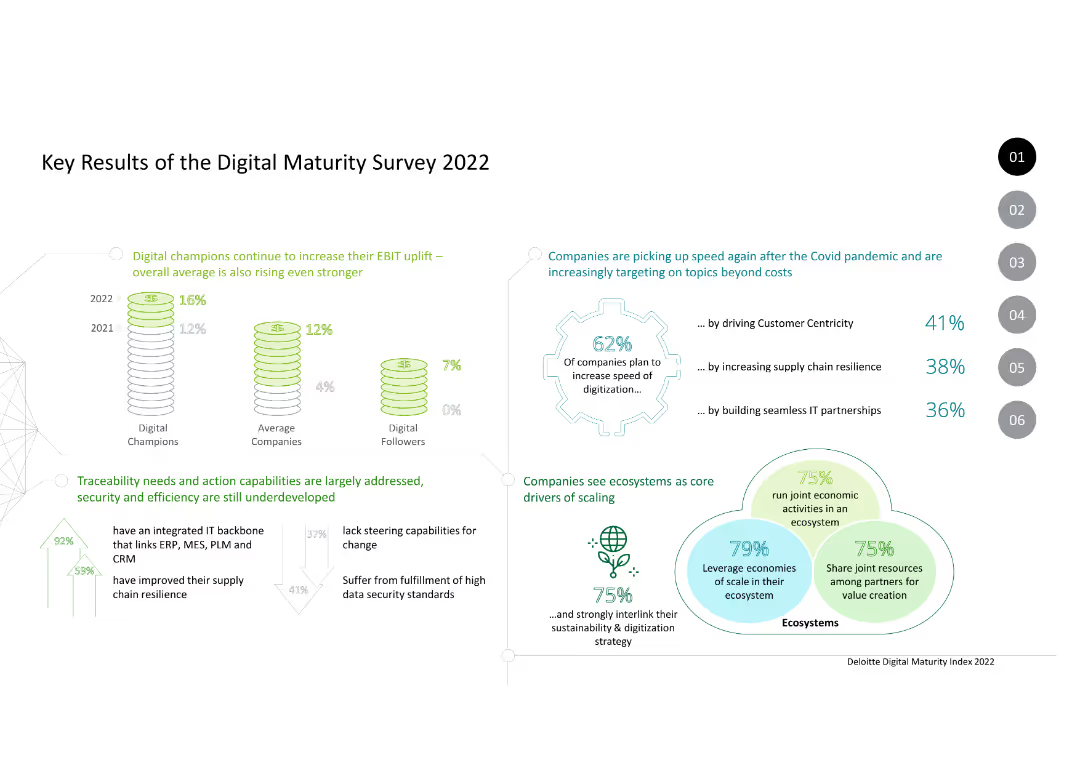
Column charts and text. Data on EBIT uplift, digitization speed, ecosystem drivers, and digital maturity levels of companies.
Market Analysis and Trends
Technology & Software
Summarizes the key results of the Digital Maturity Survey 2022, highlighting trends in digital transformation and ecosystem scaling among companies.
digital maturity, EBIT uplift, digitization, ecosystem, trends, survey, 2022, companies, technology
Mixed Chart
Deloitte
Saved
The slide uses a white background with two large, concentric pie charts contrasting shades of blue and green to depict changes over the years 2020 and 2021. Adjacent to the charts, explanatory text and percentages are provided in a clear, readable font. The layout is simple and focuses the viewer’s attention on the comparative data of the pie charts.
Market Analysis and Trends
Financial Services
The slide highlights the growing importance of innovation and increased budgets for it over the span of one year. It is likely to be used for demonstrating the trend towards innovation in business strategy, showing a substantial percentage increase in companies prioritizing innovation and allocating budgets accordingly. This slide could serve as a tool for convincing stakeholders of the necessity of increased investment in innovation.
innovation importance, budgets, business strategy, trends, year-over-year increase
Multiple Chart
BCG
Saved
Two line charts showing U.S. unemployment rate vs. Atlanta Fed wage growth and EU unemployment vs. compensation growth.
Market Analysis and Trends
Financial Services
This slide evaluates the labor market trends in the U.S. and EU, highlighting signs of normalization in the U.S. and decline in EU wages compared to the U.S.
Labor Markets, Unemployment, Wage Growth, U.S., EU, Comparison
Multiple Chart
Morgan Stanley
Saved
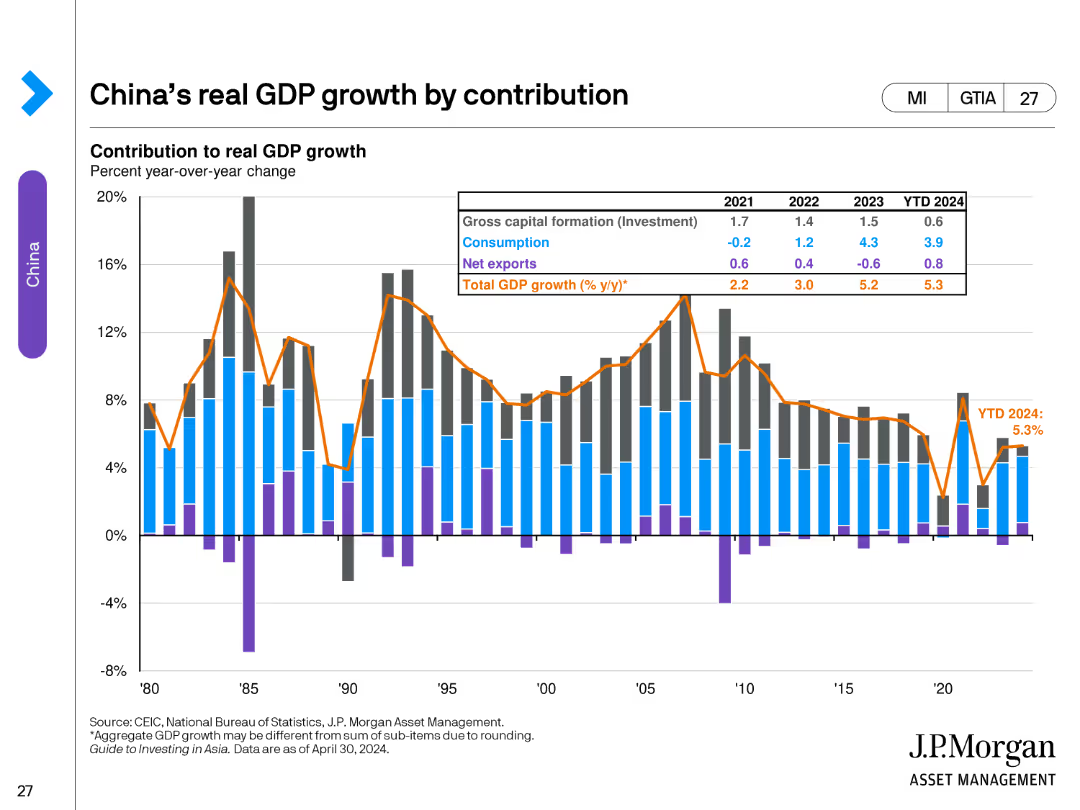
The slide contains a stacked bar chart showing the contribution to real GDP growth by gross capital formation, consumption, net exports, and total GDP growth from 1980 to 2024. A table summarizes year-over-year changes and projections for the near future.
Market Analysis and Trends
Financial Services
This slide analyzes the components of China's real GDP growth over several decades, highlighting the contributions of investment, consumption, and net exports. It provides a historical perspective and future projections of GDP growth rates.
China, GDP, growth, contribution, investment, consumption, net exports, projections, financial services, bar chart
Single Chart
JP Morgan
Saved
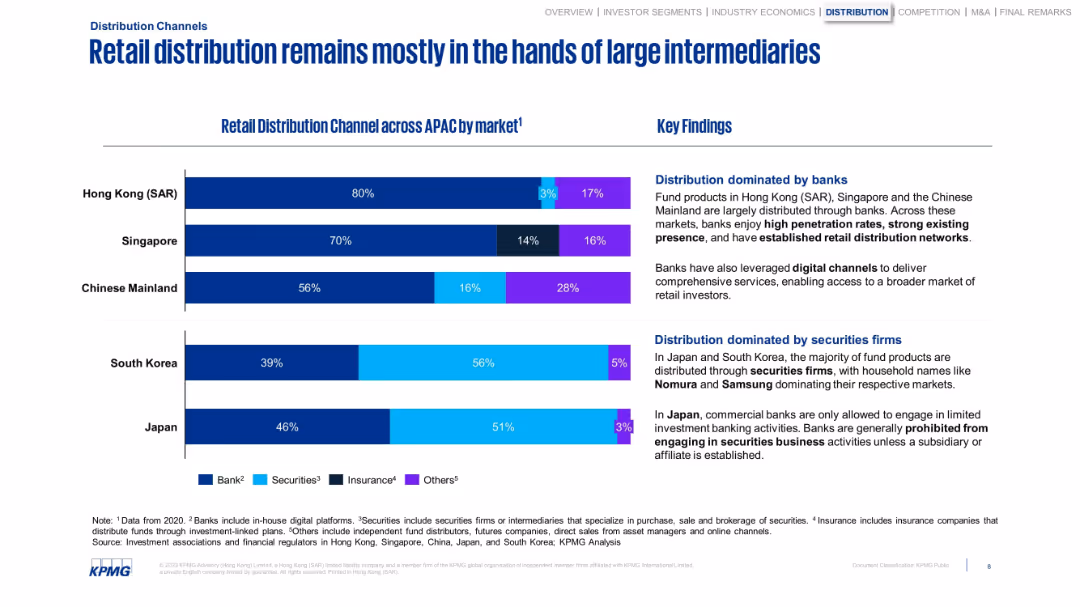
Bar chart showing retail fund distribution by channel and country. Summary insights on the right.
Customer and Market Segmentation
Financial Services
Demonstrates that banks dominate retail distribution in most APAC regions, with securities firms leading in Japan and South Korea. Notes the role of digital channels and regulatory structures affecting distribution dynamics.
banks, retail distribution, APAC, securities firms, intermediaries
Mixed Chart
KPMG
Saved
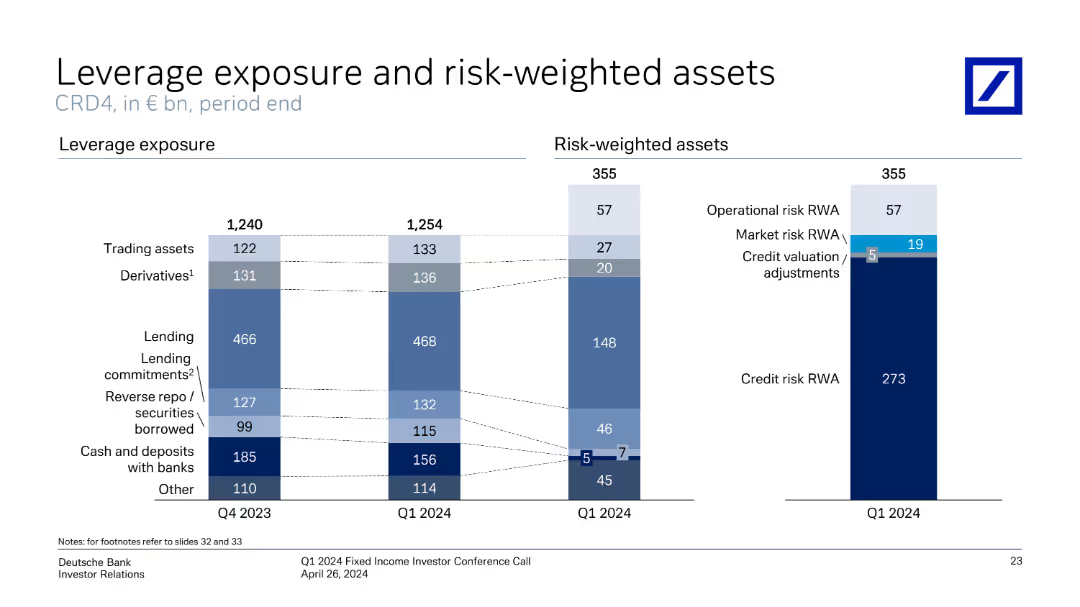
The slide displays bar charts of leverage exposure and risk-weighted assets over time, with detailed breakdowns and key highlights.
Financial Performance
Financial Services
It details Deutsche Bank's leverage exposure and risk-weighted assets, providing insights into different asset classes and risk metrics.
leverage exposure, risk-weighted assets, bar charts, asset classes, risk metrics, Deutsche Bank
Multiple Chart
Deutsche Bank
Saved
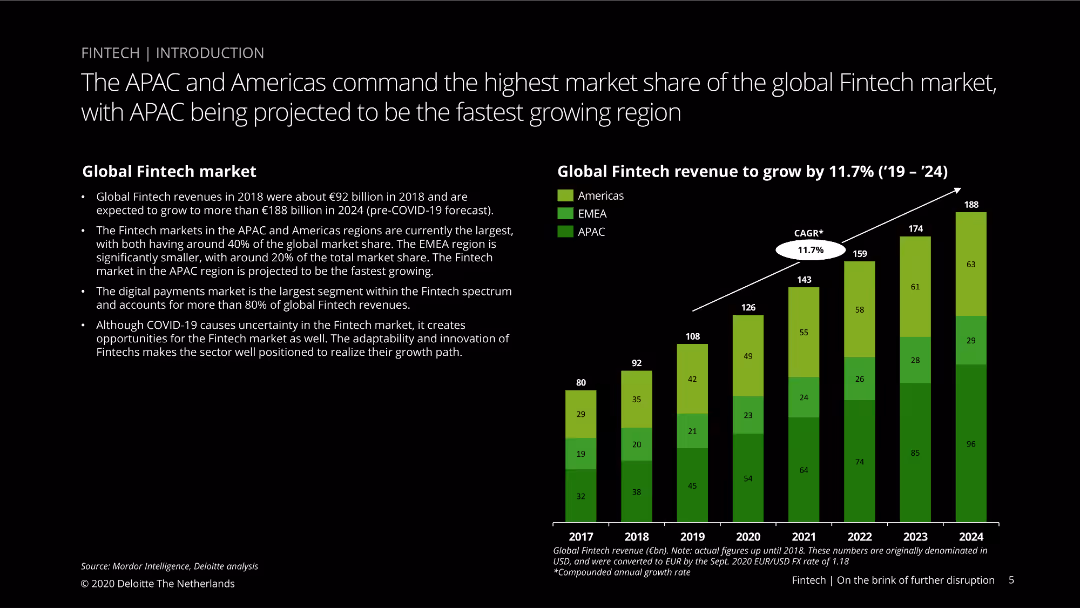
This slide features a column chart showing global fintech revenue growth from 2017 to 2024, segmented by region (Americas, EMEA, APAC), with green, yellow, and blue colors.
Market Analysis and Trends
Financial Services
Discusses the global fintech market size and growth projections, highlighting the dominance of the APAC and Americas regions and the impact of COVID-19 on fintech growth opportunities.
Fintech, market share, APAC, Americas, EMEA, growth, COVID-19, projections, digital payments, innovation
Mixed Chart
Deloitte
Saved
Consists of three pie charts showing the percentage of new Internet economy consumers, their retention post-COVID-19, and changes in online hours spent, respectively, set against a white background.
Market Analysis and Trends
Technology & Software
The slide shows the surge in Vietnam's digital consumer base during COVID-19, the retention rates of digital services post-pandemic, and the increase in average hours spent online.
Digital Consumers, Growth, Vietnam, COVID-19, Retention
Multiple Chart
Bain
Saved
The slide features a line chart comparing the share prices of Credit Suisse and European banks index from Jan 2021 to Apr 2023. Annotations highlight significant drops. The textbox discusses corporate implications of the Credit Suisse crisis and market competition changes.
Risk Assessment and Management
Financial Services
This slide outlines the structural and idiosyncratic issues leading to Credit Suisse's crisis, emphasizing broader repercussions for Swiss and European banking systems. It includes implications for corporates, such as reduced competition and renewed focus on treasury operations.
Credit Suisse, fallout, European banks, share prices, market competition, banking crisis, structural issues, corporate implications, treasury operations, risk
Mixed Chart
Accenture
Saved
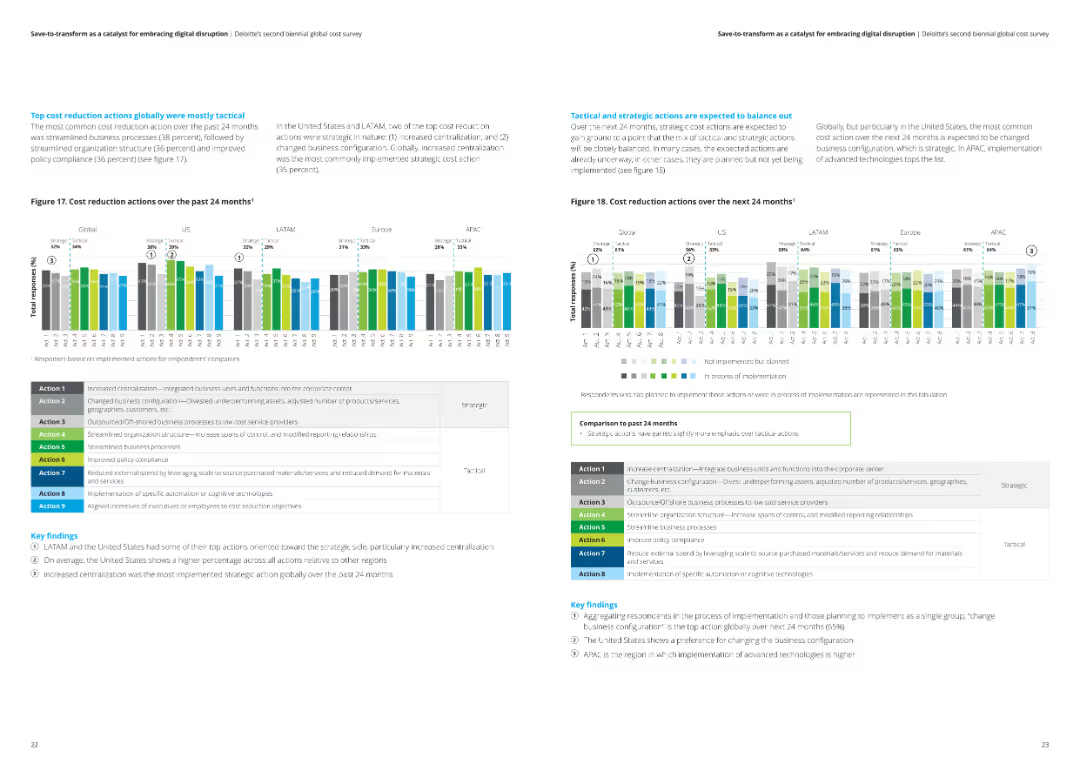
The slide features two column charts showing cost reduction actions over the past and next 24 months across different regions. Key findings are included in text boxes.
Operational Efficiency
Financial Services
The slide details tactical and strategic cost reduction actions taken in various regions over the past 24 months and projected for the next 24 months.
Cost reduction, tactical actions, strategic actions, analysis, financial services
Multiple Chart
Deloitte
Saved
A column chart showing the concern levels about online privacy across different regions, with a focus on the percentages of very concerned and somewhat concerned.
Risk Assessment and Management
Technology & Software
The slide highlights global concerns about online privacy, comparing regions such as LATAM, Middle East, APAC, and Europe.
column chart, online privacy, concern, regions, survey, global
Single Chart
IPSOS
Saved
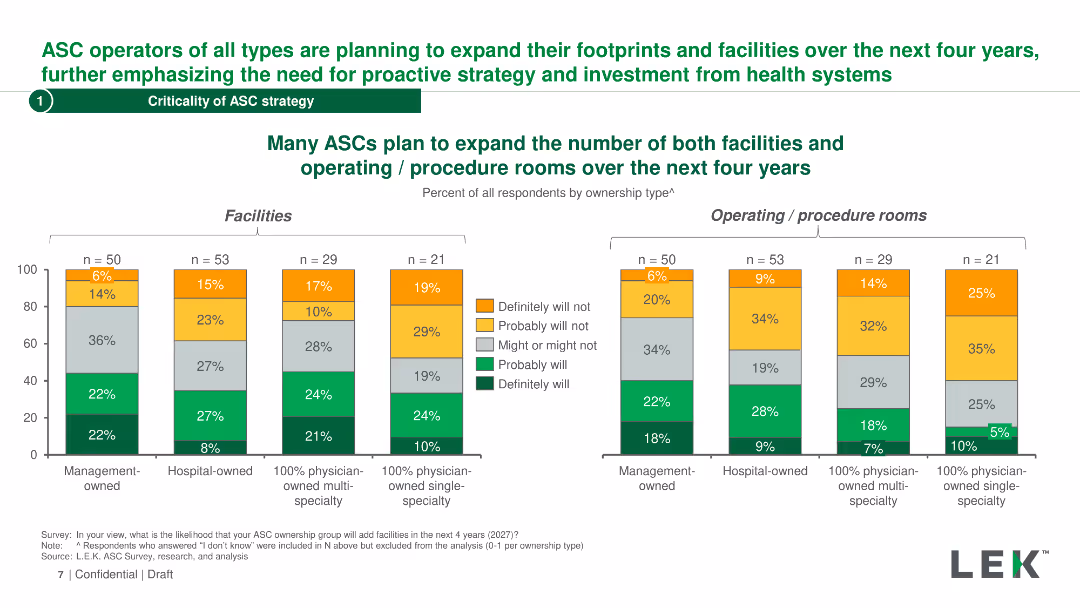
The slide contains two bar charts showing the expansion plans for ASCs in terms of facilities and operating rooms over the next four years, segmented by ownership type.
Strategic Planning
Healthcare & Pharmaceuticals
It highlights the future expansion plans for ASCs, detailing the expected growth in facilities and operating rooms, based on ownership types.
ASC expansion, facilities, operating rooms, ownership type, growth plans
Multiple Chart
LEK
Saved
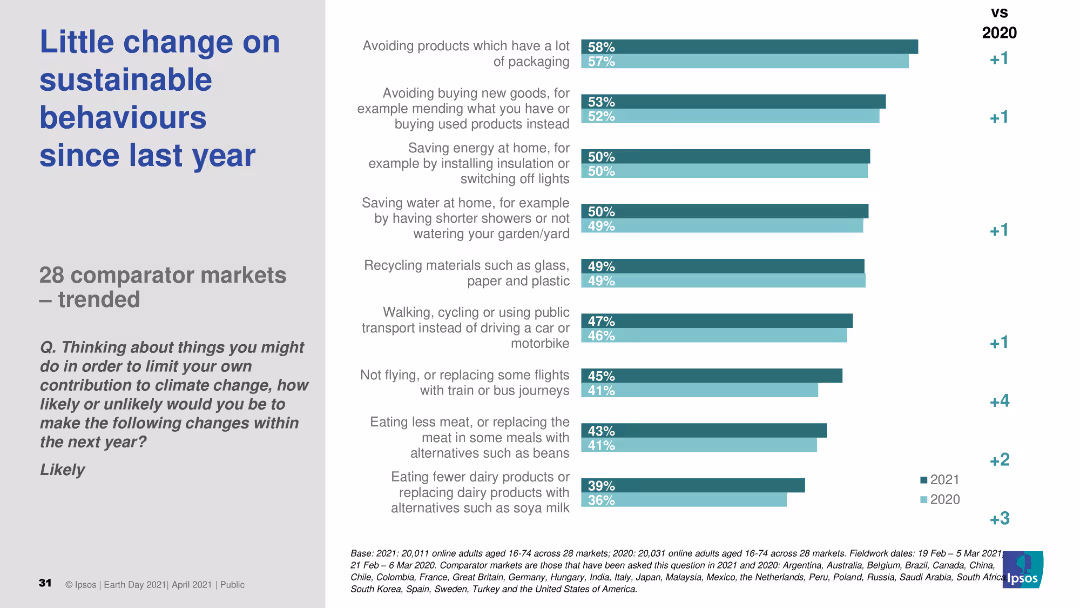
The slide features a column chart comparing sustainable behavior changes across 28 markets from 2020 to 2021. The chart displays percentages for different actions, with a comparison to the previous year.
Market Analysis and Trends
Environmental Services & Sustainability
The slide shows survey results on sustainable behaviors across 28 markets, indicating little change in engagement from 2020 to 2021.
sustainable behaviors, market trends, survey, year comparison, 2021
Single Chart
IPSOS
Saved
Slide includes multiple bar charts detailing marketing budgets as percentages of overall budgets and revenues, segmented by various company attributes.
Financial Performance
Professional Services
Provides a detailed breakdown of how marketing budgets as percentages of overall budgets and revenues differ across company sizes and sectors.
marketing spend, industry comparison, budget analysis, revenue percentages, business analysis
Multiple Chart
Deloitte
Saved
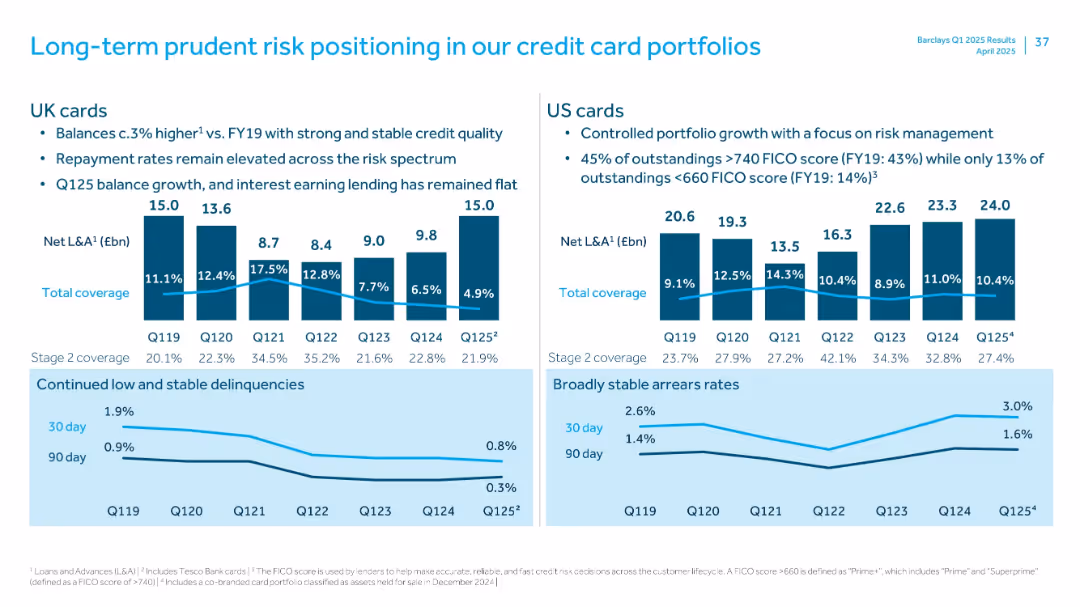
Two vertical bar charts with supporting bullet points and line charts on delinquencies and arrears
Risk Assessment and Management
Financial Services
Demonstrates disciplined credit card portfolio growth in the UK and US, with stable delinquency rates, strong FICO score distribution, and clear risk metrics like stage 2 coverage and net loans & advances.
credit cards, delinquencies, risk, UK, US, FICO
Multiple Chart
Barclays
Saved
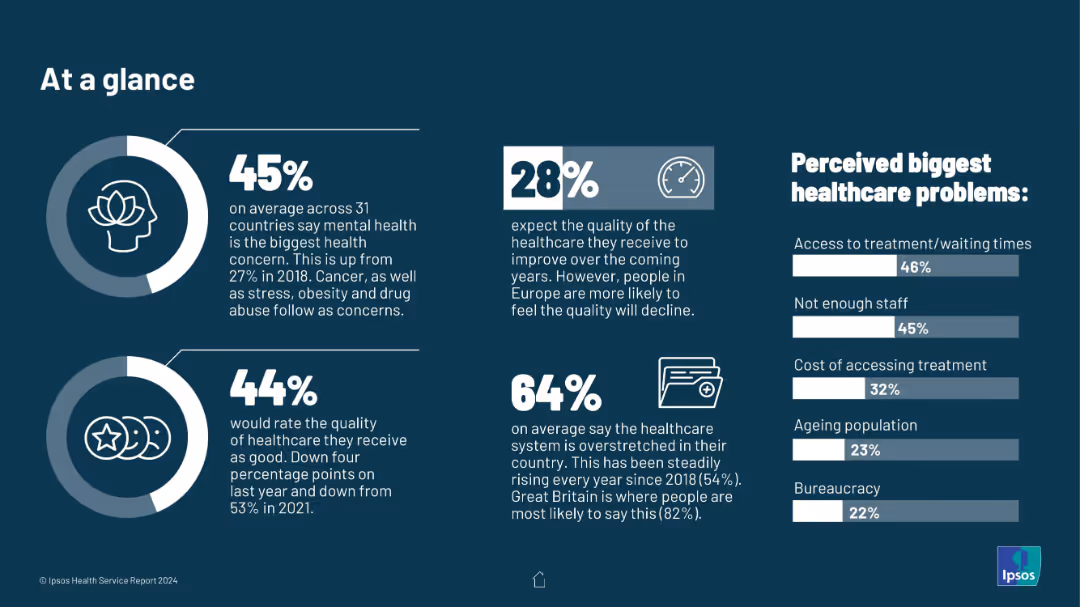
Dark blue background with infographic-style layout. Circular icons, bar charts, and bold percentages highlight healthcare concerns
Market Analysis and Trends
Healthcare & Pharmaceuticals
This slide presents global healthcare concerns: mental health is cited by 45% as the top issue. Other data covers expectations on healthcare quality and perceived biggest healthcare issues.
healthcare, mental health, global trends, access to care, staffing issues, patient concerns, Ipsos health report, data visualization
Multiple Chart
IPSOS
Saved
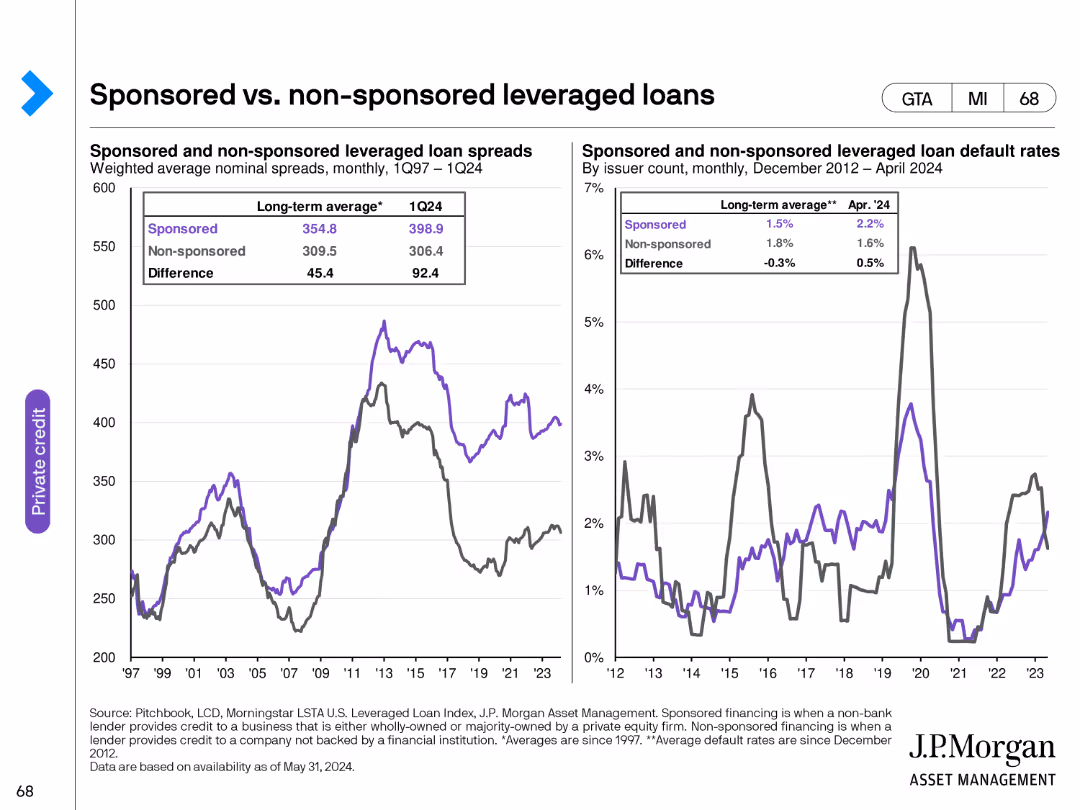
This slide includes two line charts. The first chart compares weighted average nominal spreads of sponsored and non-sponsored leveraged loans from 1997 to Q1 2024. The second chart shows default rates for these loans by issuer count from December 2012 to April 2024.
Risk Assessment and Management
Financial Services
The slide analyzes the differences in spreads and default rates between sponsored and non-sponsored leveraged loans, offering insights into risk and performance characteristics in the leveraged loan market.
leveraged loans, sponsored, non-sponsored, spreads, default rates
Multiple Chart
JP Morgan
Saved
This slide has a simple layout with a clear division between text sections and a central infographic. The infographic is a circular diagram with four segments, each containing an icon and label, indicating a strategic approach.
Organizational Structure and Change
Professional Services
The slide describes an organization's strategy and foundational elements for creating value. It could be used to explain a company's core objectives and strategic guideposts, such as purpose, mission, and impact on various stakeholders.
Strategy, Value Creation, Impact, Growth, Sustainability, Inclusivity
Diagram
McKinsey
Saved
Previous
Next
If nothing, comes up, please save your slides first
Create a FREE account to continue browsing
Receive Instant Access to 1,000+ slides from companies like McKinsey, Google, and Goldman Sachs
First Name
Last Name
Email
Password
I agree to all
Terms & Privacy Policy
Thank you! Your submission has been received!
Oops! Something went wrong while submitting the form.
Have an account?
Sign in
Column Chart
Heatmap
Chevron
Org Chart
Infographic
Callouts
Timeline
List
Graphic
Picture
Process Flow
Diagram
Paragraph
Map
Table
Framework
Subtitle
Takeaway Box
Icon
Other Chart
Radar Chart
Waterfall Chart
Mekko Chart
Pie Chart
Scatter Plot
Line Chart
Bar chart
Bullet points