My Account
My Slides
Leave Feedback
Login
Logout
Get Started
Browse all Slides
Browse Slides Pro
Create a FREE Account
Instant access to 1,000+ real slides from top companies like McKinsey, BCG, Goldman Sachs, Google and many more!
First Name
Last Name
Email
Password
I agree to all
Terms & Privacy Policy
Thank you! Your submission has been received!
Oops! Something went wrong while submitting the form.
Have an account?
Sign in
Welcome,
Welcome
PRO
Show Featured Only
Checkbox 8
Companies
Mckinsey
Bain
BCG
EY
Deloitte
Accenture
PwC/Strategy&
JP Morgan
Goldman Sachs
Morgan Stanley
Citigroup
Deutsche Bank
Barclays
LEK
Kearney
Oliver Wyman
Booz Allen Hamilton
Gartner
IPSOS
Nielsen
Slide type
Text Only
Linear Flow
Vertical Flow
Single Chart
Header Horizontal
Mixed Chart
Header Vertical
Pillar
Multiple Chart
Graphic
Agenda
Title
Table
Framework
Industry
Technology & Software
Financial Services
Retail & E-commerce
Consumer Goods
Industrial & Manufacturing
Transportation & Logistics
Telecommunications
Real Estate & Construction
Hospitality & Tourism
Professional Services
Education & Training
Media & Entertainment
Agriculture & Food Production
Healthcare & Pharmaceuticals
Environmental Services & Sustainability
Government & Public Sector
Use Case
Mergers and Acquisitions
Performance Metrics and KPIs
Client Case Studies
Competitive Landscape
Corporate Finance and Valuation
Product and Service Analysis
Customer and Market Segmentation
Organizational Structure and Change
Industry Overview
Regulatory and Compliance
Risk Assessment and Management
Investment Analysis
Organizational Structure and Change
Human Resources and Talent Management
Financial Performance
Market Analysis and Trends
Sales and Business Development
Human Resources and Talent Management
Clear all
Thank you! Your submission has been received!
Oops! Something went wrong while submitting the form.
Tag
View slide
Slide features a bar chart displaying VC as a percentage of GDP and total VC amount in USD for Brazil, USA, Israel, China
Market Analysis and Trends
Financial Services
Compares venture capital investment as a percentage of GDP and in absolute terms across four countries, highlighting Brazil's position relative to more developed economies
Brazil, VC, GDP, investment, comparison
false
Market Analysis and Trends
Financial Services financial-services
Single Chart
McKinsey
View slide
Features column charts showing the growth of the credit market in Brazil and a breakdown of transaction channels over several years.
Market Analysis and Trends
Financial Services
Analyzes the growth of Brazil's credit market post-pandemic, focusing on the increase in digital payments and credit distribution across different channels.
Brazil, credit market, digital payments, market growth, financial analysis
false
Market Analysis and Trends
Financial Services financial-services
Multiple Chart
Barclays
View slide
The slide contains two line graphs. The left graph plots the Consumer Price Index (CPI) and exchange rate (BRL per USD) over time, marked from 2007 to 2023 with a % change y-o-y. The right graph shows the Bovespa index over the same timespan, indexed to January 2007 = 100. The graphs are color-coded, with annotations and a title at the top.
Market Analysis and Trends
Financial Services
This slide presents economic data for Brazil, comparing inflation and exchange rates with stock market performance. The juxtaposition of CPI and exchange rate trends alongside the Bovespa index indicates a nuanced narrative of economic conditions, suggesting for detailed market analysis.
Brazil, inflation, exchange rate, Bovespa index, economic analysis, CPI, market performance, trend, financial chart, currency valuation
false
Market Analysis and Trends
Financial Services financial-services
Multiple Chart
McKinsey
View slide
Features a world map and portrait of a woman, highlighting Brazil's role as a continental hub attracting global tech companies
Market Analysis and Trends
Technology & Software
Focuses on Brazil's emerging status as a tech hub, mapping major global tech players and their activities within the region
Brazil, tech hub, global, market, innovation
false
Market Analysis and Trends
Technology & Software technology-and-software
Graphic
McKinsey
View slide
Depicts a map with numerical data highlighting the number of unicorns in Brazil compared to other countries
Market Analysis and Trends
Technology & Software
Compares Brazil's capacity to foster high-value startups (unicorns) with other leading countries, emphasizing its growing influence in the global market
Brazil, unicorns, global, comparison, startups
false
Market Analysis and Trends
Technology & Software technology-and-software
Mixed Chart
McKinsey
View slide
This slide features a singular blue line chart tracking the price of Brent crude oil from 2016 to 2023. The layout is clean, with distinct markers for each quarter, and the title prominently displayed at the top.
Market Analysis and Trends
Energy & Utilities
Analyzing the price fluctuations of Brent crude oil, this slide shows a line chart that tracks quarterly data over several years. It can be used to understand trends in the energy sector, make financial predictions, or develop strategies for purchasing and futures contracts in industries like transportation and manufacturing.
Brent crude, oil price, trend analysis, line chart
false
Market Analysis and Trends
Energy & Utilities energy-and-utilities
Single Chart
Morgan Stanley
View slide
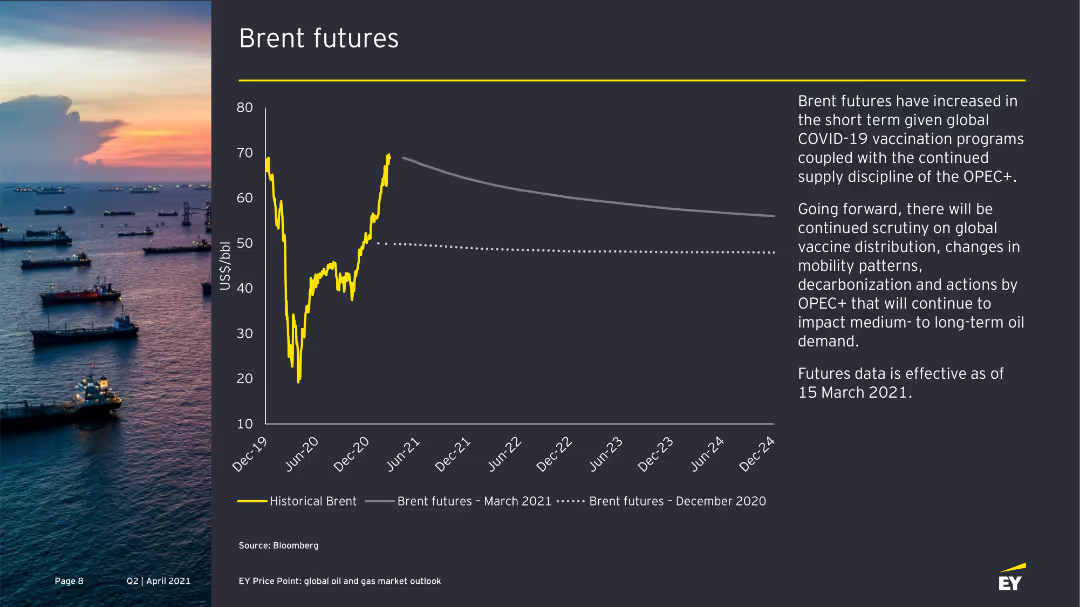
This slide features a line chart showing the historical Brent prices and future estimates with a sunset backdrop of oil tankers at sea. The visual complexity is moderate, with clear graph lines and color contrasts for readability.
Market Analysis and Trends
Energy & Utilities
The slide discusses the short-term increase in Brent futures due to COVID-19 vaccination programs and OPEC+ actions. It highlights the ongoing scrutiny on vaccine distribution, mobility patterns, and OPEC+ actions affecting oil demand.
Brent futures, OPEC+, COVID-19, oil demand, vaccine
false
Market Analysis and Trends
Energy & Utilities energy-and-utilities
Mixed Chart
EY
View slide
The slide includes a line chart showing Brent futures prices from December 2019 to December 2024. It uses yellow lines for historical and future projections, with a background image of an oil rig. Text explains the trends and implications.
Market Analysis and Trends
Energy & Utilities
The slide projects Brent crude oil prices based on global vaccination programs, mobility, and OPEC+ supply discipline. It discusses factors like COVID-19 variants and decarbonization affecting medium- to long-term oil demand and pricing.
Brent futures, oil prices, OPEC+, COVID-19, decarbonization
false
Market Analysis and Trends
Energy & Utilities energy-and-utilities
Mixed Chart
EY
View slide
The slide presents a line chart showing historical Brent prices and Brent futures as of June 2020, with an accompanying narrative on the factors influencing these trends.
Market Analysis and Trends
Energy & Utilities
Analyzes the increase in Brent futures prices due to production cuts and rising demand, with projections for future price trends.
Brent futures, oil prices, market trends, 2020
false
Market Analysis and Trends
Energy & Utilities energy-and-utilities
Mixed Chart
EY
View slide
The slide uses two side-by-side graphs: one for Brent price forecasts and the other for WTI. Each graph compares bank/broker and consultant price estimates, using different shades of yellow for distinction. Text details the forecast ranges.
Market Analysis and Trends
Energy & Utilities
This slide provides forecasts for Brent and WTI oil prices, comparing the estimates of banks, brokers, and consultants. It discusses the factors influencing these estimates and the projected average prices for 2026.
Brent, WTI, oil price forecasts, bank/broker, consultants
false
Market Analysis and Trends
Energy & Utilities energy-and-utilities
Multiple Chart
EY
View slide
Comparative column charts evaluating the impact of Brexit under different scenarios with business leader insights.
Investment Analysis
Government & Public Sector
Evaluates the potential impacts of different Brexit scenarios on French business operations and investments.
Brexit, business impact, France, UK, investment levels, company activity
false
Investment Analysis
Government & Public Sector government-and-public-sector
Multiple Chart
Bain
View slide
The slide features a bar charts with percentage labels, a map highlighting geographic regions, and text blocks. It visually contrasts broadband impact across different socioeconomic areas.
Market Analysis and Trends
Telecommunications
The slide discusses how increased broadband speeds have lifted GDP in lower socioeconomic areas, with a focus on Greater Melbourne, showing that faster broadband access can drive economic growth.
Broadband, GDP, Socioeconomic, Melbourne, Impact
false
Market Analysis and Trends
Telecommunications telecommunications
Multiple Chart
Accenture
View slide
This slide shows a mix of bar charts and a small photograph of Airlie-Whitsundays. It displays broadband speed increases alongside GDP uplift in different regions, marked with colors for emphasis.
Market Analysis and Trends
Telecommunications
This slide outlines how regions with faster broadband have seen significant productivity boosts, with detailed examples from Airlie-Whitsundays and Wyndham Vale, highlighting the transformative impact.
Broadband, Regional, Productivity, Airlie, Wyndham
false
Market Analysis and Trends
Telecommunications telecommunications
Multiple Chart
Accenture
View slide
Features detailed bar charts comparing productivity impacts across various industries. Design elements are used to emphasize significant data points like in Professional, Scientific, and Technical Services.
Market Analysis and Trends
Telecommunications
Discusses the disproportionate benefits of faster broadband across different sectors, notably in services industries, where increased speeds significantly boost productivity and economic contributions.
Broadband, Services, Productivity, Impact, Industry
false
Market Analysis and Trends
Telecommunications telecommunications
Multiple Chart
Accenture
View slide
This slide presents a bar chart detailing expenditure allocations for top 15 ministries for the fiscal year 2019/20, displayed in descending order of funding.
Regulatory and Compliance
Government & Public Sector
Showcases budget allocations across different government ministries, emphasizing financial priorities and allocations.
Budget allocation, government ministries, fiscal management
false
Regulatory and Compliance
Government & Public Sector government-and-public-sector
Single Chart
PwC/Strategy&
View slide
Slide uses multiple bar graphs to compare budget allocations across ten departments, using color coding to differentiate between higher and lower spending areas.
Financial Performance
Government & Public Sector
Showcases Namibia's budget allocation priorities for 2018/19, highlighting significant investments in education, health, and defense. The slide provides a clear view of governmental fiscal priorities and sectoral funding.
Budget, Allocations, Government, Sectors
false
Financial Performance
Government & Public Sector government-and-public-sector
Single Chart
PwC/Strategy&
View slide
The slide is divided into five color-coded sections, each with icons representing different spending priorities like COVID-19 response and infrastructure. Text outlines key initiatives.
Regulatory and Compliance
Government & Public Sector
Describes major spending areas in the national budget, including COVID-19 response, education, public safety, and infrastructure, using simple icons and lists.
Budget, COVID-19, education, public safety, infrastructure, spending
false
Regulatory and Compliance
Government & Public Sector government-and-public-sector
Pillar
PwC/Strategy&
View slide
Features column charts comparing revenue, expenses, and deficits over three fiscal years. The columns are color-coded in pink, gray, and red, respectively.
Regulatory and Compliance
Government & Public Sector
Analyzes the financial figures from past, present, and projected budgets, detailing revenue, expenses, and deficits to assess financial health and planning. This visual helps in understanding the budgetary trends and economic strategies moving forward.
Budget, Revenue, Expenses, Deficit, Fiscal analysis
false
Regulatory and Compliance
Government & Public Sector government-and-public-sector
Single Chart
PwC/Strategy&
View slide
The slide contains a column chart comparing Gen Zs and Millennials on statements related to burnout and employer responses. The layout is clean, with a text section at the top and a chart at the bottom.
Risk Assessment and Management
Professional Services
This slide discusses burnout levels among Gen Zs and Millennials and highlights the percentage of respondents agreeing with statements about workload intensity, organizational burnout, and employer responses to burnout.
Burnout, retention, employers, Gen Z, Millennials, workload
false
Risk Assessment and Management
Professional Services professional-services
Mixed Chart
Deloitte
View slide
Central pie chart divided into four segments, with each segment's percentage and related business area labeled. Below are icons representing each business area.
Market Analysis and Trends
Financial Services
Communicates the proportional contributions of different business sectors to the overall company portfolio, emphasizing diversification and growth strategy.
Business Banking, Investment Services
false
Market Analysis and Trends
Financial Services financial-services
Mixed Chart
Goldman Sachs
View slide
Two pie charts showing the distribution of business banking relationships, accompanied by a column chart showing the growth of talech customers, using blue tones.
Sales and Business Development
Financial Services
Presents the expansion strategy in business banking, indicating the potential for deepening customer relationships and adding new customers through various payment solutions.
Business Banking, talech, Bento, Growth
false
Sales and Business Development
Financial Services financial-services
Multiple Chart
Goldman Sachs
View slide
This slide features a line graph over time, showing trends in investor priorities related to business capabilities and EPS guidance. It's a data-driven layout with a focus on chronological changes and comparison.
Strategic Planning
Financial Services
Shows how investor priorities have shifted over the past year regarding business capabilities and EPS guidance, useful for strategic planning and performance evaluation.
Business Capabilities, EPS Guidance, Investor Priorities, Trend Analysis, Corporate Strategy, Long-term Focus, Performance Evaluation, Investment Trends, Strategic Development, Guidance Compliance
false
Strategic Planning
Financial Services financial-services
Single Chart
BCG
View slide
Similar to slide 11, with the addition of 'Opportunities' in a third column; uses a simple and clean layout.
Strategic Planning
Financial Services
Strategic insights into future business development, focusing on opportunities stemming from secular changes.
Business Development, Opportunities, Strategy, Future
false
Strategic Planning
Financial Services financial-services
Linear Flow
Goldman Sachs
View slide
Slide with title, two comparative column charts on revenues and rankings for different financial services, showing growth over time with arrows and brief text descriptions.
Financial Performance
Financial Services
Summarizes the growth and improvement in rankings of the firm's debt underwriting and asset & wealth management, showcasing its track record in building successful businesses.
Business Growth, Debt Underwriting, Wealth Management, Rankings
false
Financial Performance
Financial Services financial-services
Multiple Chart
Goldman Sachs
View slide
Bar charts showing future business focus and projections.
Strategic Planning
Financial Services
Details plans and projections for future business areas with potential for growth.
Business Growth, Projections, Strategic Focus, Financial Services
false
Strategic Planning
Financial Services financial-services
Multiple Chart
Barclays
View slide
A structured layout featuring four main content blocks: about Palsgaard, challenge/opportunity, solution, and results and benefits, with accompanying icons and bullet points.
Client Case Studies
Environmental Services & Sustainability
This slide presents a case study on Palsgaard, illustrating how integrating SDG 12 (Responsible Consumption) and SDG 13 (Climate Action) into their core strategy has fueled business growth and decreased externalities, focusing on sustainable operations and CO2 reduction initiatives across global production sites.
Business Growth, Sustainability, SDG 12, SDG 13, Case Study
false
Client Case Studies
Environmental Services & Sustainability environmental-services-and-sustainability
Table
McKinsey
View slide
The slide has a text area with a header and two line graphs comparing the perspectives of millennials and Gen Z on businesses' societal impact from 2016 to 2021. The design is straightforward with a mix of green and yellow lines against a white backdrop.
Organizational Structure and Change
Technology & Software
This slide reflects the shifting perspectives of millennials and Gen Z regarding the role of businesses in society. It discusses a trend where fewer individuals view businesses as a force for good, with line graphs showing the percentage of those who agree with this sentiment from 2016 to 2021. The information is vital for understanding corporate reputation and social responsibility practices.
Business Impact, Society, Millennials, Gen Z, Line Graph, Corporate Responsibility, Trends, Sentiment Analysis
false
Organizational Structure and Change
Technology & Software technology-and-software
Mixed Chart
Deloitte
View slide
This slide features a comparative layout with percentage data across various Southeast Asian countries, highlighting the use of business messaging. It uses a mix of text, rectangular elements for data representation, and an image of a woman using her phone, likely to represent the practical use of business messaging. The design is modern and clean with a balance between visual elements and informational content.
Market Analysis and Trends
Retail & E-commerce
The slide presents statistics on business messaging use in Southeast Asia, comparing it by country. It includes a key message about the challenges of integration and automation in business messaging for large organizations and reasons for using business messaging, emphasizing convenience and communication.
Business Messaging, Southeast Asia, Market Comparison, Communication Trends, Automation Challenges, Convenience, Integration, Usage Statistics, Digital Interaction
false
Market Analysis and Trends
Retail & E-commerce retail-and-e-commerce
Boxed
Bain
View slide
A conceptual slide with two distinct graphs showing targeted share gains and accelerated growth, using color-coded bubbles to represent different business sectors.
Market Analysis and Trends
Financial Services
It offers a strategic view on Citibank's business mix and share gains, used for discussions on market trends and business growth. The visual elements make it suitable for presentations that involve financial analysis and planning.
Business Mix, Share Gains, Growth, Market Trends, Citibank, Financial Strategy
false
Market Analysis and Trends
Financial Services financial-services
Single Chart
Citigroup
View slide
Circular diagram showing factors interconnected with business model innovation and column charts projecting global retail e-commerce sales and its share of total retail sales from 2015 to 2024.
Technology and Digital Transformation
Technology & Software
This slide explores the dynamics of business model innovation within Industry 4.0, highlighting factors such as digital communications and emerging markets. It projects significant growth in global retail e-commerce sales and its increasing share of total retail sales, indicating a shift towards online business models.
Business Model Innovation, E-commerce, Industry 4.0
false
Technology and Digital Transformation
Technology & Software technology-and-software
Mixed Chart
Roland Berger
Previous
Loading...
Hold On!
We are searching in our database
If nothing, comes up, please try different filters!
Column Chart
Heatmap
Chevron
Org Chart
Infographic
Callouts
Timeline
List
Graphic
Picture
Process Flow
Diagram
Paragraph
Map
Table
Framework
Subtitle
Takeaway Box
Icon
Other Chart
Radar Chart
Waterfall Chart
Mekko Chart
Pie Chart
Scatter Plot
Line Chart
Bar chart
Bullet points
Create a FREE account to continue browsing
Receive Instant Access to 8,000+ of the internet's best slides
First Name
Last Name
Email
Password
I agree to all
Terms & Privacy Policy
Thank you! Your submission has been received!
Oops! Something went wrong while submitting the form.
Have an account?
Sign in
Upgrade to PRO to Save slides
Advanced Search and Filters
Access to 8,000+ slides
Access to Category Pages
Save/Bookmark Slides
PowerPoint Template Library
(Coming Soon)
Pick a Plan
MONTHLY
$12/month
Billed every month, Cancel anytime.
YEARLY
$9/year
Billed $108 annually, Cancel anytime.
Checkout for $12/month
Checkout for $108/yr
Secured by Stripe | AES-256 bit encryption