My Account
Leave Feedback
Login
Logout
Get Started
Browse all Slides
Create a FREE Account
- Instant access to 7,500+ real slides
- Advanced search and filters
- Links to presentation source
- Early access to SlideStart Pro
(coming soon!)
First Name
Last Name
Email
Password
I agree to all
Terms & Privacy Policy
Thank you! Your submission has been received!
Oops! Something went wrong while submitting the form.
Have an account?
Sign in
Welcome,
Welcome
Show Featured Only
Checkbox 8
Companies
Mckinsey
Bain
BCG
EY
Deloitte
Accenture
PwC/Strategy&
JP Morgan
Goldman Sachs
Morgan Stanley
Citigroup
Deutsche Bank
Barclays
LEK
Kearney
Oliver Wyman
Booz Allen Hamilton
Choose slide types
Text Only
Linear Flow
Vertical Flow
Single Chart
Header Horizontal
Header Vertical
Mixed Chart
Graphic
Mixed Flow
Boxed
Pillar
Multiple Chart
Diagram
Image
Graphic
Agenda
Title
Table
Framework
Takeaway Box
Text Only
Linear Flow
Vertical Flow
Single Chart
Header Horizontal
Header Vertical
Mixed Chart
Graphic
Mixed Flow
Boxed
Pillar
Multiple Chart
Diagram
Image
Graphic
Agenda
Title
Table
Framework
Takeaway Box
Reset
Thank you! Your submission has been received!
Oops! Something went wrong while submitting the form.
Tag
Showing
0
of
0
false
We see significant variance in resilience levels amongst Nordic companiesIntroduction to Bain & Company
Single Chart
Bain
false
Digital financial services steam ahead; H1 2021 deal values alone have surpassed those of full year 2020e-Conomy SEA 2021 Roaring 20s: The SEA Digital Decade
Mixed Chart
Bain
false
...that could reshape the future markets and industries in the next few decades.The top trends in tech - executive summary
Text Only
McKinsey
false
COVID-19 US impact could exceed anything since the end of WWIICovid 19: Briefing Materials
Single Chart
McKinsey
false
Clarion profileDeutsche Bank Global Auto Industry Conference
Mixed Chart
Deutsche Bank
false
e-conomy: SEA 2021e-Conomy SEA 2021 Roaring 20s: The SEA Digital Decade
Title
Bain
false
Commodities and Global Markets Results driven by strong performance in commoditiesGoldman Sachs 16thAnnual Australia and New Zealand Investment Forum
Mixed Chart
Goldman Sachs
false
COVID-19 epidemic continues to progress globally while disease hotspots are changing and lockdown strategies are evolvingCOVID-19 BCG Perspectives Series Global Restart: Key Dynamics
Header Horizontal
BCG
false
2021/22 Annual Budget Speech: Tax Revenue CompositionDissecting the 2021/22 Annual Budget Speech
Single Chart
PwC/Strategy&
false
icG Revenue Items and Selected Business Drivers and StatisticsEarnings Results Presentation Second Quarter 2023
Header Vertical
Citigroup
false
We expect expense growth to remain at low to mid single digits over the medium term as our investments are fully at scaleInverstors Day 2023
Mixed Chart
JP Morgan
false
Large variation in triggers and barriersDigital consumer spending in India: A $100 Bn opportunity
Header Horizontal
BCG
false
Strong home loan, business lending, platforms and deposits growth and lower credit impairment charges partially offset by higher expensesMorgan Stanley Virtual Hong Kong Summit
Multiple Chart
Morgan Stanley
false
The dominance of laggards in tier 2 and tier 3 cities explains why less than 50% of respondents are aware of most digital activities.Unlocking the next wave of digital growth: beyond metropolitan Indonesia
Single Chart
Kearney
false
Expanding our reach in business bankingGoldman Sachs U.S. Financial Services Conference 2021
Multiple Chart
Goldman Sachs
false
Demand managementStrategic Cost Transformation Grab’n Go session
Table
Deloitte
false
Macquarie Asset Management Actively manages funds for investors across multiple asset classesGoldman Sachs 16thAnnual Australia and New Zealand Investment Forum
Mixed Chart
Goldman Sachs
false
Manchester: Tech investmentUnlocking growth: Creating tech ecosystems to stimulate local economies
Mixed Chart
Barclays
false
Improving operating performance leveraging One SantanderEuropean Financials Conference Morgan Stanley
Table
Morgan Stanley
false
TALENT MANAGEMENT % of deficient rating (1-2)2021 P&C Underwriting Survey
Mixed Chart
Accenture
false
Chase Offers has seen tremendous engagement in the first few monthsConsumer & Community Banking 2019
Linear Flow
JP Morgan
false
How work is experienced… Future of Work - How work is experienced?
Text Only
Deloitte
false
Benefits in the SpotlightState of the Workplace III
Single Chart
Goldman Sachs
false
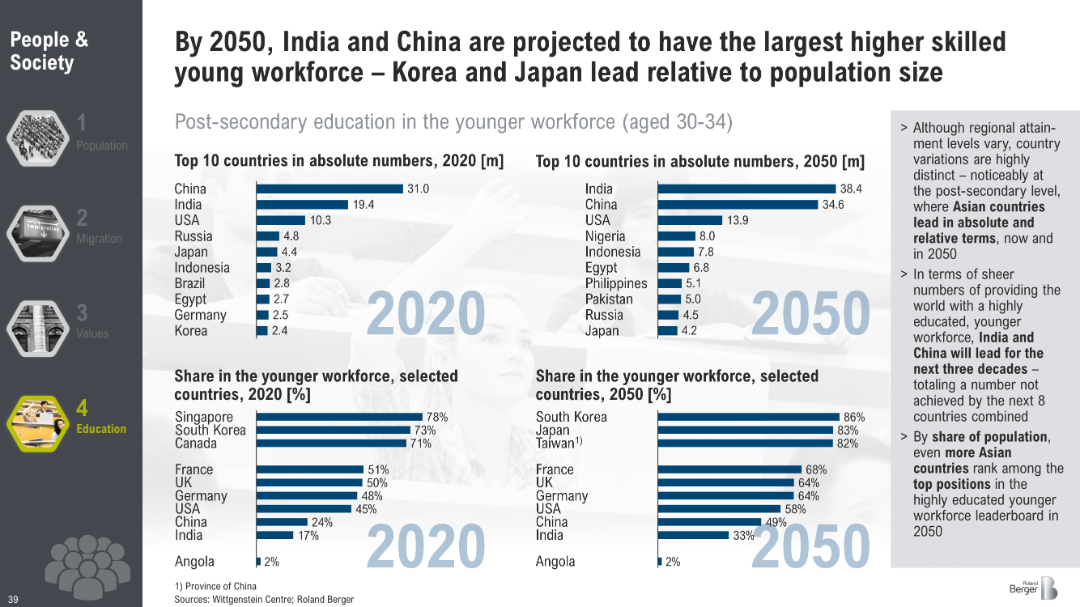
By 2050, India and China are projected to have the largest higher skilled young workforce Korea and Japan lead relative to population sizeRoland Berger Trend Compendium 2030: Megatrend 1 People & Society
Multiple Chart
Roland Berger
false
Optimism for the U.S. economy dips, returning to historic averageThe CMO Survey The Highlights and Insights Report February 2022
Mixed Chart
Deloitte
false
We’re pursuing strategies to lead and innovate in payments, lending, and commerceConsumer & Community Banking
Table
JP Morgan
false
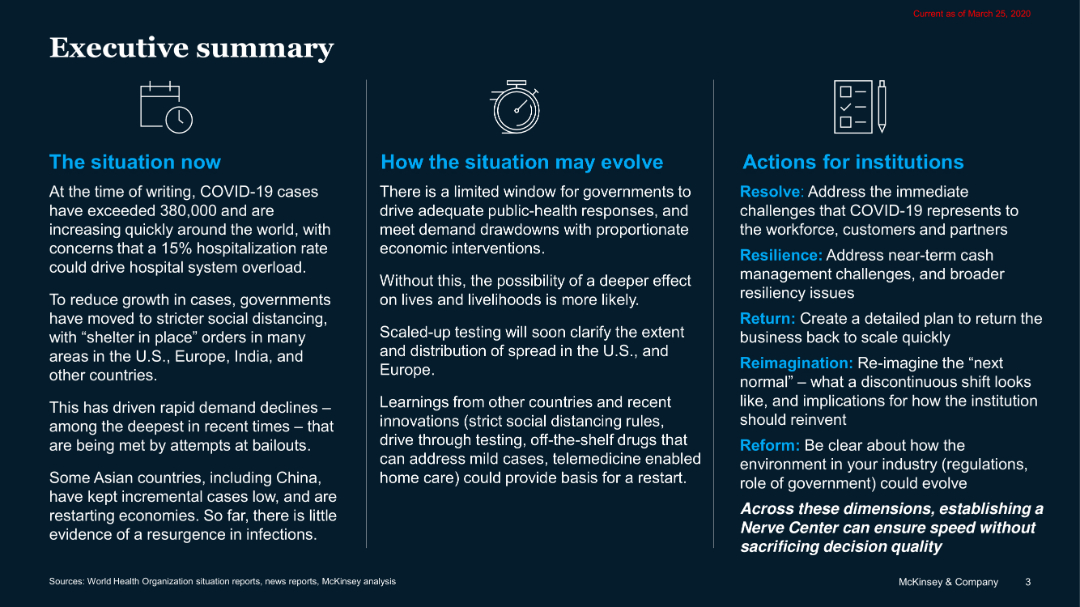
Executive summaryCOVID-19: Briefing Note
Header Horizontal
McKinsey
false
MONITORING OF AIR QUALITY COPERNICUS BENEFITS FOR AIR QUALITY ACTIVITIESCOPERNICUS Market report February 2019
Mixed Chart
PwC/Strategy&
false
SACU ReceiptsNational Budget 2024/25 For Our Humanity: Now's the time to work together.
Single Chart
PwC/Strategy&
false
Survey question: If applicable, what is the average level of effort/time taken by speakers for the below speaker programs including preparation and service time (in hours)?HCP ENGAGEMENT END-TO-END CONTINUUM
Multiple Chart
Deloitte
false
Society: Growing pressure on companies from customers, investors, and stakeholders to advance the social goodRethink & Broaden Diversity, Equity, and Inclusion to Create a Competitive Advantage
Multiple Chart
BCG
false
Stable income in different macro-economic and market environmentsFY 2023 Results Announcement
Single Chart
Barclays
false
04 Mergers and AcquisitionsDoing business in the Philippines 2021
Mixed Chart
Deloitte
false
AS WE LOOK AHEAD: 3 STRATEGY MANTRAS AND 1 FUNDAMENTAL ENABLER TO BEAR IN MINDALTAGAMMA 2018 WORLDWIDE LUXURY MARKET MONITOR
Mixed Chart
Bain
false
The IBKR AdvantageGoldman Sachs US Financial Services Conference 2022
Diagram
Goldman Sachs
false
The nbn effect: How the nbn network adds value to our livesAccenture Consumer Value Report 2021
Title
Accenture
false
Our physical network has been critical to achieving industry-leading deposit growthConsumer & Community Banking 2019
Mixed Chart
JP Morgan
false
We are making progress against our DEI ambitionsFY23 ESG Investor Presentation
Multiple Chart
Barclays
false
Sharing Beauty With All: 2017 achievementsDEUTSCHE BANK 2018 A very dynamic 1st quarter
Header Vertical
Deutsche Bank
false
Companies are implementing a range of measures to increase resiliencyCovid 19: Briefing Materials
Multiple Chart
McKinsey
false
Strong revenue trajectory supported by resilient and diversified franchise positioningQ4 / FY 2023 Fixed Income Investor Conference Call
Mixed Chart
Deutsche Bank
false
Most of the additional demand from non-OECD countries comes from Asia, especially from China and IndiaRoland Berger Trend Compendium 2030: Megatrend 3 Scarcity of resources
Multiple Chart
Roland Berger
true
Fast and stringent lockdowns shorten outbreaks; but neither is sufficient aloneCOVID-19 BCG Perspectives Series Global Restart: Key Dynamics
Multiple Chart
BCG
false
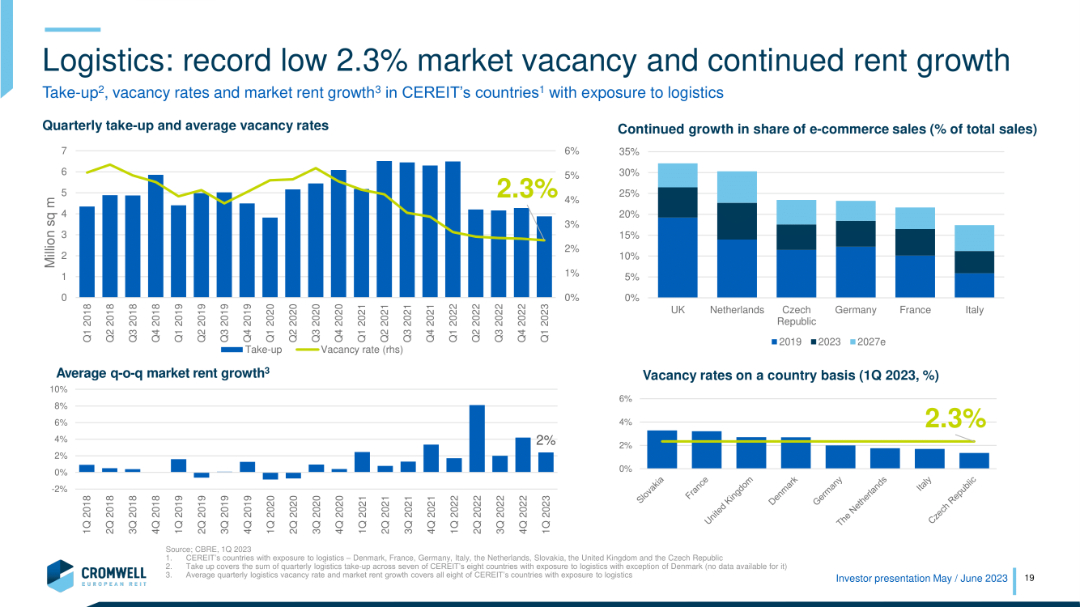
Logistics: record low 2.3% market vacancy and continued rent growthMorgan Stanley Conference Investor presentation
Multiple Chart
Morgan Stanley
false
Better talent management. One of the biggest challenges SSOs face is providing career paths and development opportunities that will make it an attractive place to work.Global Business Services Performance improvement
Multiple Chart
Deloitte
false
Median of value/sales multiplesTransport & Logistics Barometer
Multiple Chart
PwC/Strategy&
false
Impact of AutomationGoldman Sachs US Financial Services Conference 2022
Mixed Chart
Goldman Sachs
false
The EU’s Hydrogen Strategy aims at achieving a renewable hydrogen mass market based on a 3-phase-roadmapChilean Hydrogen Pathway
Mixed Chart
McKinsey
false
Costs: lower regulatory change spend facilitates investments in growthFY 2023 Results Announcement
Single Chart
Barclays
false
Cultivating an Innovation Ecosystem2022 Environmental, Social, Governance Report
Text Only
Booz Allen Hamilton
false
Lasting adoption of e-Commerce is expected across the regione-Conomy SEA 2020 At full velocity: Resilient and racing ahead
Single Chart
Bain
false
Stable and well diversified deposit portfolioQ4 / FY 2023 Fixed Income Investor Conference Call
Multiple Chart
Deutsche Bank
false
Four million people in the UK have used Generative AI for workDigital Consumer Trends 2023
Mixed Chart
Deloitte
false
Cards: Using Our Playbook to Drive Opportunity Outside U.S.Global Consumer Banking
Mixed Chart
Citigroup
false
Executive summary Digging deeper into investor action, one sees many bright spots across asset classes and themes – yet far from full potentialSoutheast Asia’s Green Economy 2022 Report
Text Only
Bain
false
Companies consider innovation and talent management as key value drivers across the SDGsSDG Guide for Business Leaders
Table
McKinsey
false
OVERALL, EASTERN AFRICA HAD THE GREATEST PROPORTION OF HIGH RANKING APPLICATIONS (18.6%) COMPARED TO OTHER REGIONSTEF APPLICATION EVALUATION 2019
Multiple Chart
Accenture
false
Figure 3. Future-ready organizations excel in many business areasThe Value Multiplier: Intelligent Operations Maturity
Multiple Chart
Accenture
false
In NA, we have launched and scaled new US$100m+ business lines with a portfolio of incremental opportunities ahead of usBarclays Global Credit Bureau Forum
Multiple Chart
Barclays
false
We are making strong progress against our strategyInverstors Day 2023
Table
JP Morgan
1
...
Next
Hold On!
We are searching in our database
If nothing, comes up, please try different filters!
Create a FREE account to continue browsing
Receive Instant Access to 7,500+ of the internet's best slides
First Name
Last Name
Email
Password
I agree to all
Terms & Privacy Policy
Thank you! Your submission has been received!
Oops! Something went wrong while submitting the form.
Have an account?
Sign in
Column Chart
Heatmap
Chevron
Org Chart
Infographic
Callouts
Timeline
List
Graphic
Picture
Process Flow
Diagram
Paragraph
Map
Table
Framework
Subtitle
Takeaway Box
Icon
Other Chart
Radar Chart
Waterfall Chart
Mekko Chart
Pie Chart
Scatter Plot
Line Chart
Bar chart
Bullet points