My Account
My Slides
Search by Category
Companies
Slide Type
Use Case
Industry
Pricing
Templates
View All Templates
Download Template Slides
✦ AI
AI Prompt Library
AI Search
Feedback
Login
Logout
Get Started
Browse all Slides
Browse all Slides
Create a FREE Account
Instant access to 1,000+ real slides from top companies like McKinsey, BCG, Goldman Sachs, Google and many more!
First Name
Last Name
Email
Password
I agree to all
Terms & Privacy Policy
Thank you! Your submission has been received!
Oops! Something went wrong while submitting the form.
Have an account?
Sign in
Saved Slides
Total No. of slides saved
0
↻ Refresh
✖ Clear all
The slide outlines key strategies for leaders in sales and marketing, advocating for a customer-first approach and integration across functions with vibrant graphics and a clear layout.
Technology and Digital Transformation
Retail & E-commerce
Encourages leaders to personalize customer journeys and reinvent sales channels to stay competitive in
false
Technology and Digital Transformation
Retail & E-commerce
Vertical Flow
BCG
Add to my slides
Remove from favorites
Incorporating charts and graphs, this slide provides a visual representation of population growth, arable land per person, and meat consumption trends.
Investment Analysis
Agriculture & Food Production
An analysis of agricultural market drivers globally, emphasizing the influence of population growth and dietary changes on the industry.
false
Investment Analysis
Agriculture & Food Production
Multiple Chart
EY
Add to my slides
Remove from favorites
Gradient pink-purple background with white text; icons and labeled segments describing drivers; bottom section outlines research methodology
Strategic Planning
Financial Services
Identifies four main drivers of customer advocacy—Reassure me, Remember me, Delight me, Reward me—based on global banking study findings. Describes methodology used (49,300 surveyed, 194 variables analyzed) to derive 21 significant variables into 4 key groups.
false
Strategic Planning
Financial Services
Pillar
Accenture
Add to my slides
Remove from favorites
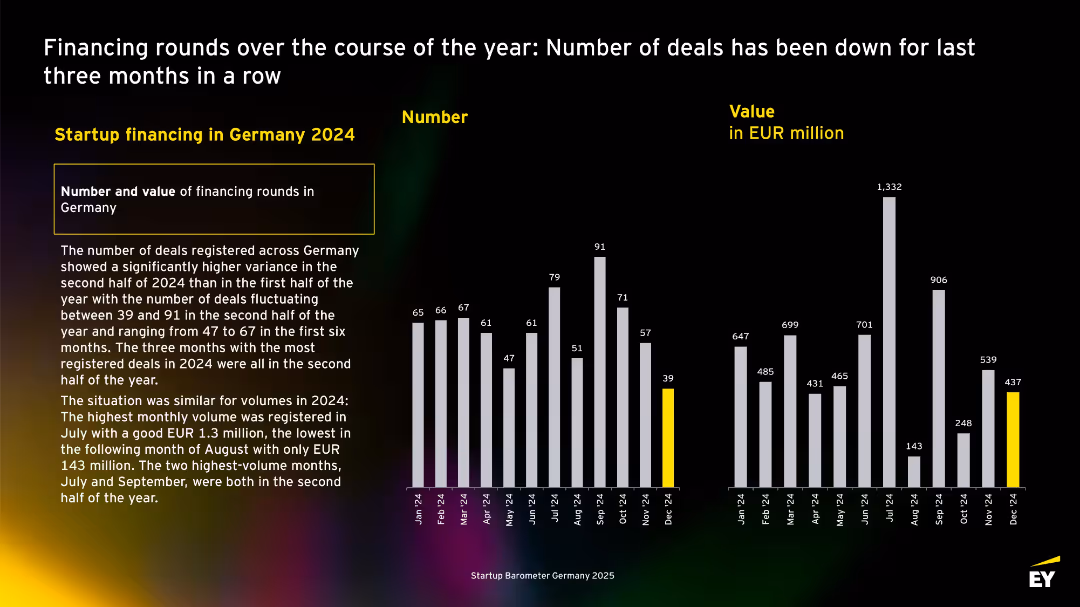
Monthly bar charts of deal numbers and values for 2024, with descriptive text on the left. Yellow highlight for December data.
Investment Analysis
Professional Services
Illustrates monthly fluctuations in startup deal counts and values for 2024. Highest activity was in Q3, while December marked the lowest. Emp
false
Investment Analysis
Professional Services
Multiple Chart
EY
Add to my slides
Remove from favorites
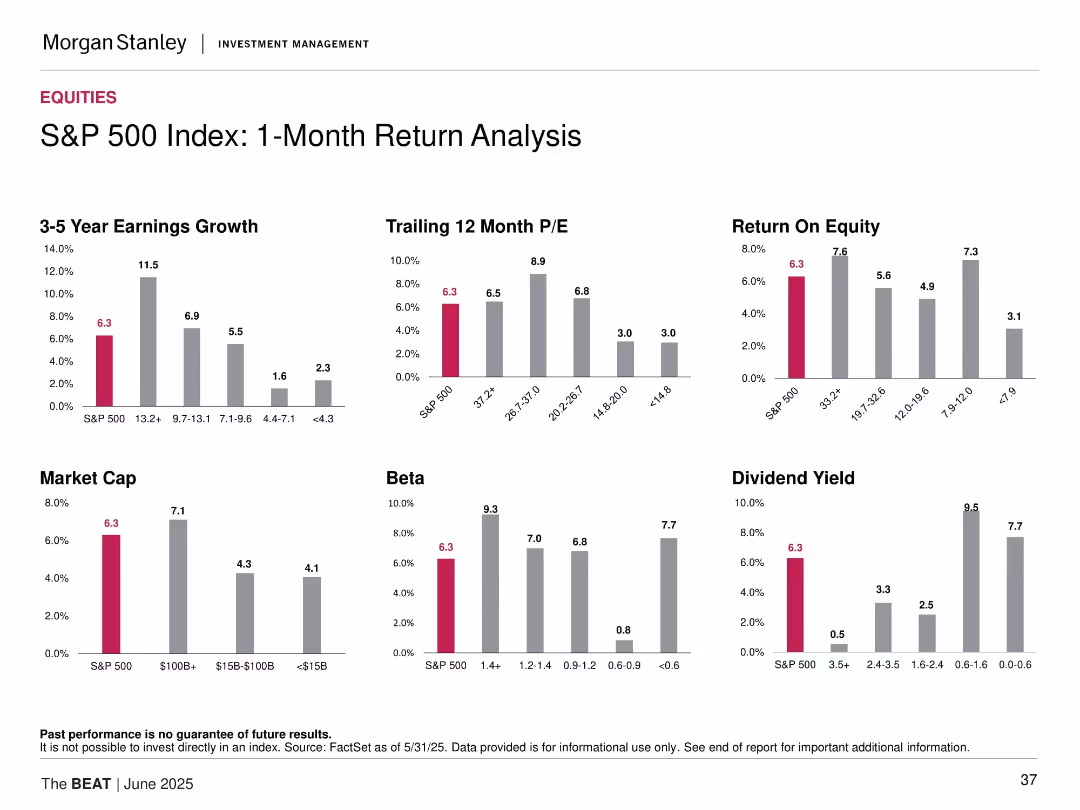
Grid of bar charts showing various metrics like ROE, P/E, dividend yield, earnings growth across different market cap and beta groups.
Performance Metrics and KPIs
Financial Services
This slide breaks down 1-month return data for the S&P 500 based on factors such as beta, market cap, and valuation. It compares the S&P 500's return against various cohorts and attributes performance to key financial metrics. Each subplot visualizes a different performance driver.
1-month return, S&P 500, financial metrics, ROE, dividend yield, beta, market cap, comparative analysis
false
Performance Metrics and KPIs
Financial Services
Multiple Chart
Morgan Stanley
Add to my slides
Remove from favorites
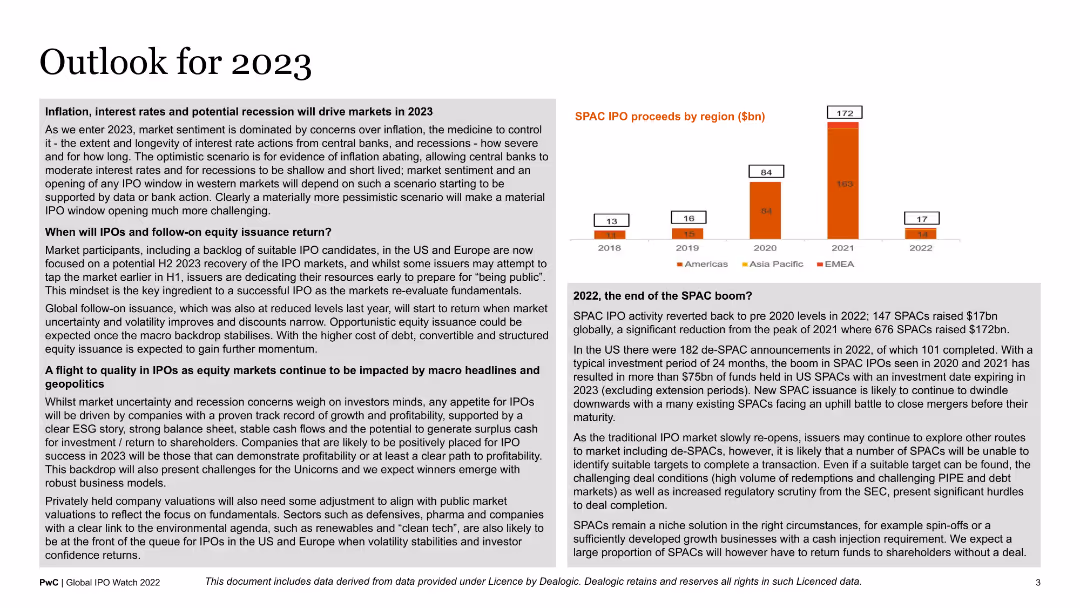
The slide contains a detailed text analysis on market expectations for 2023, accompanied by a small bar chart showing SPAC IPO proceeds by region from 2018 to 2022. It is text-heavy, with key points highlighted in bullet form for readability.
Strategic Planning
Financial Services
This slide outlines predictions for 2023 market trends, focusing on potential impacts of inflation, interest rates, and recession fears. It is aimed at market analysts and financial strategists planning for the upcoming year.
2023 outlook, market trends, SPAC IPOs, inflation, recession
false
Strategic Planning
Financial Services
Mixed Chart
PwC/Strategy&
Add to my slides
Remove from favorites
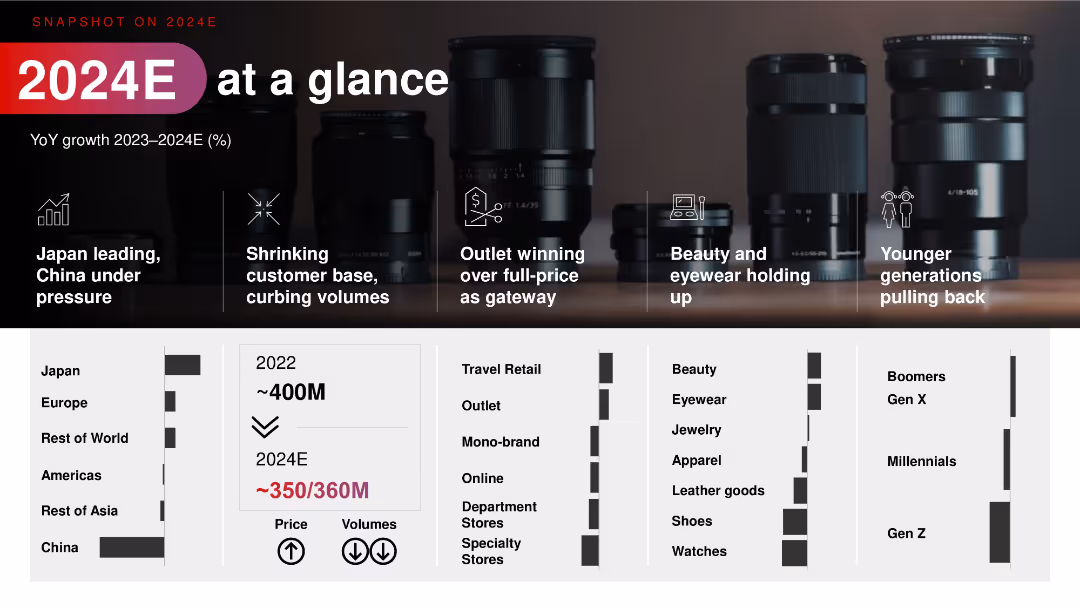
Visual collage of camera lenses in the background. Icons highlight 5 major themes, with a lower matrix showing segment and channel performance across regions and categories.
Strategic Planning
Consumer Goods
Offers a visual summary of 2024 luxury performance. Japan is leading while China is under pressure. Outlets outperform full-price stores. Eyewear and beauty hold strong, while Gen Z and Millennials are pulling back. Breakdowns by retail type, product category, and generation offer insights into shifting consumption behavior.
2024 summary, outlet channels, generational shifts, product trends, China, Japan
false
Strategic Planning
Consumer Goods
Mixed Chart
Bain
Add to my slides
Remove from favorites
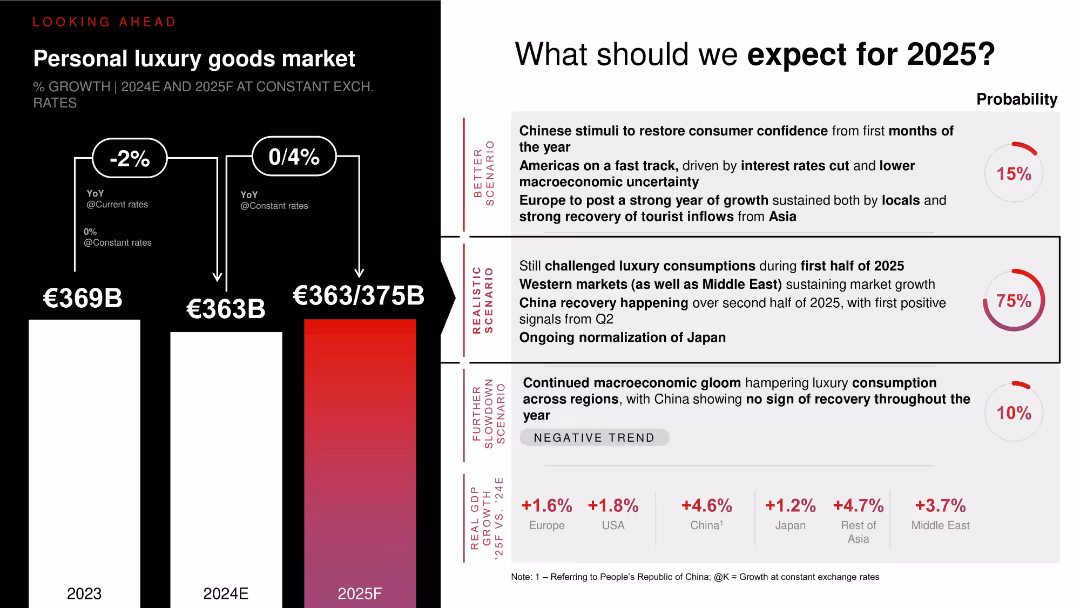
Vertical bar chart projecting 2025 scenarios with arrows and probability indicators (realistic, better, worse). Accompanied by scenario descriptions and macro trends.
Market Analysis and Trends
Consumer Goods
Outlines three potential scenarios for personal luxury goods market growth in 2025, with a realistic scenario (75% probability) expecting recovery led by China, Western markets, and Japan. Charts suggest flat to moderate growth (€363–375B). Also includes economic growth rates across regions to support expectations.
2025 forecast, luxury market, scenario planning, China recovery, global consumption trends
false
Market Analysis and Trends
Consumer Goods
Multiple Chart
Bain
Add to my slides
Remove from favorites
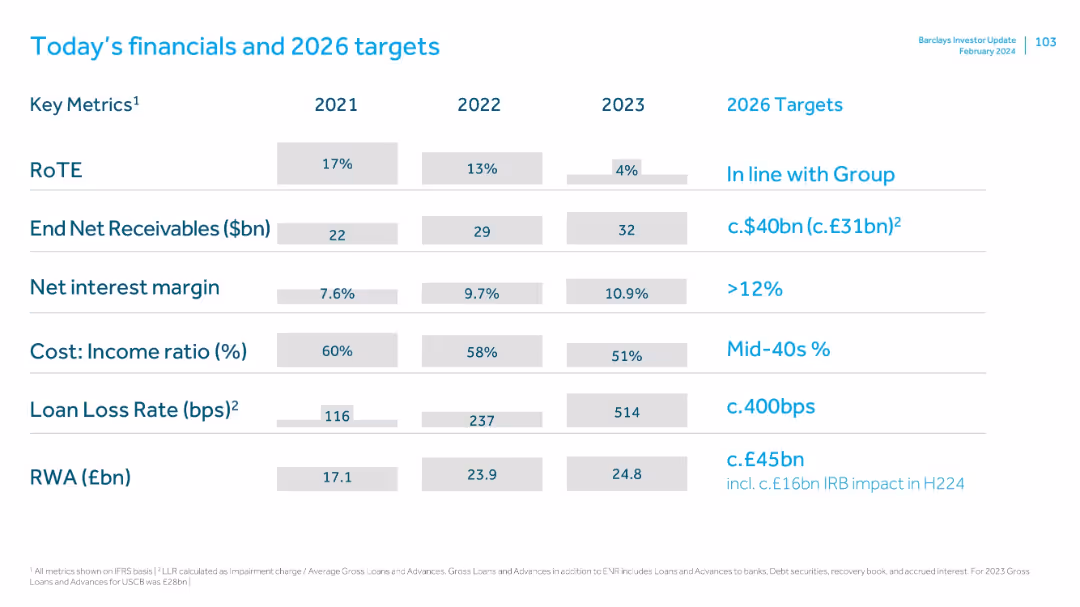
Tabular comparison of 2021–2023 metrics with 2026 targets. Uses grey and blue text to distinguish years vs goals.
Strategic Planning
Financial Services
Provides a consolidated snapshot of Barclays' current financials and 2026 strategic goals, showing targets for receivables, RoTE, margin, CIR, loan loss rate, and risk-weighted assets. Aligns expectations with broader Group objectives.
2026 targets, RoTE, receivables, margin, CIR, RWA, loan loss, financial planning
false
Strategic Planning
Financial Services
Single Chart
Barclays
Add to my slides
Remove from favorites
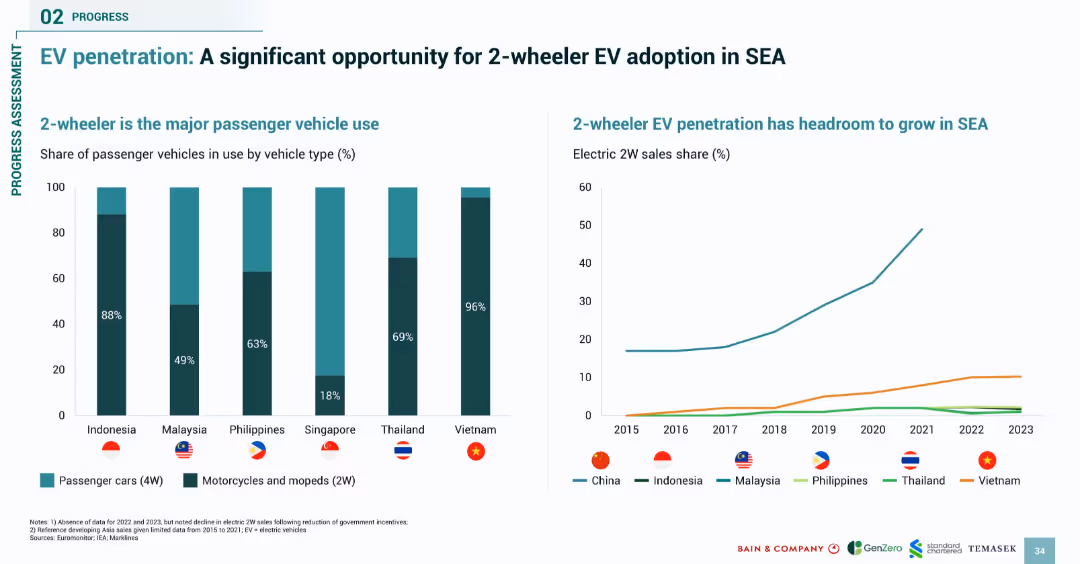
Dual-chart slide with a bar chart (vehicle type usage) and line chart (2W EV sales); clean modern layout
Market Analysis and Trends
Transportation & Logistics
This slide illustrates the dominance of 2-wheelers in Southeast Asia and the growth opportunity for 2W EVs. It compares current vehicle types in use and trends in 2W EV penetration, noting that countries like Vietnam have seen strong adoption compared to others.
2-wheeler, EV adoption, SEA, motorbikes, e-mobility, passenger vehicle use, electric scooters
false
Market Analysis and Trends
Transportation & Logistics
Multiple Chart
Bain
Add to my slides
Remove from favorites
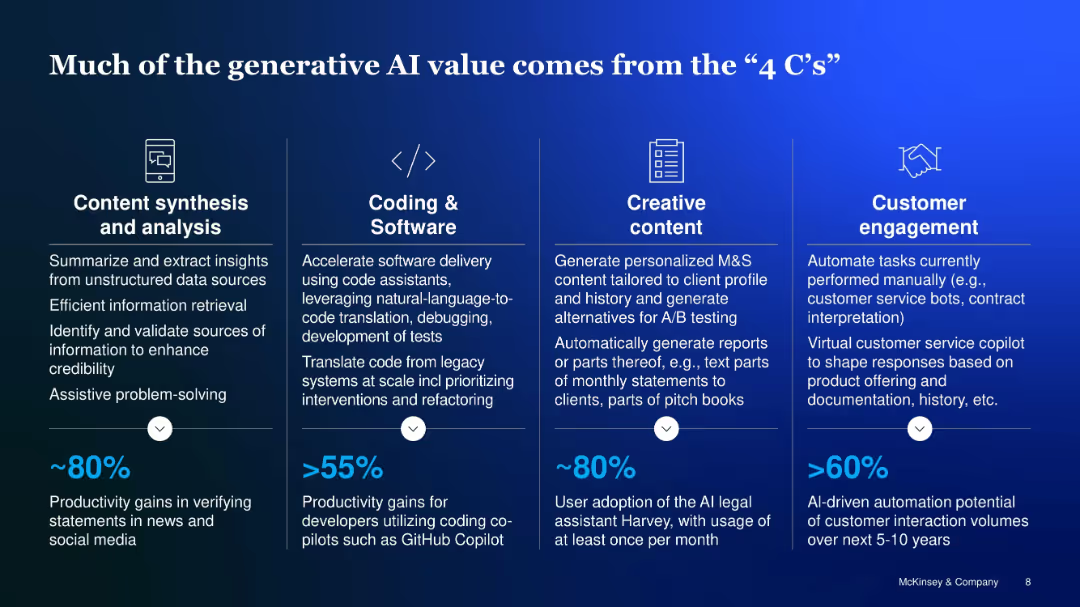
4-column layout, each for Content synthesis, Coding, Creative content, and Customer engagement
Operational Efficiency
Artificial Intelligence
Describes GenAI's value generation across four domains: synthesizing content, coding, creative personalization, and customer interaction. Each area includes specific use cases and productivity gain estimates.
4 Cs, content, coding, engagement, creativity, productivity
false
Operational Efficiency
Artificial Intelligence
Pillar
McKinsey
Add to my slides
Remove from favorites
Contains column charts and bar charts detailing 3G/4G coverage in schools across different regions in Indonesia, and additional data on the proximity of schools to network nodes.
Strategic Planning
Telecommunications
Highlights the superior 4G coverage in Java, Bali, and Sumatra which facilitates better internet connectivity in schools compared to other regions.
4G coverage, Indonesia, Java, Bali, Sumatra, schools, internet connectivity
false
Strategic Planning
Telecommunications
Multiple Chart
BCG
Add to my slides
Remove from favorites
Features two sets of column charts comparing 4G download speeds and availability among major operators from 2018 to 2020. The visual style uses different colors for each operator to facilitate comparison. Annotations emphasize improvements in network quality.
Market Analysis and Trends
Telecommunications
Examines the discrepancies in 4G download speeds across various operators over time, highlighting how smaller operators are improving their services to remain competitive despite having similar levels of 4G network availability.
4G, download speed, network quality, operators, competition, service improvement
false
Market Analysis and Trends
Telecommunications
Multiple Chart
BCG
Add to my slides
Remove from favorites
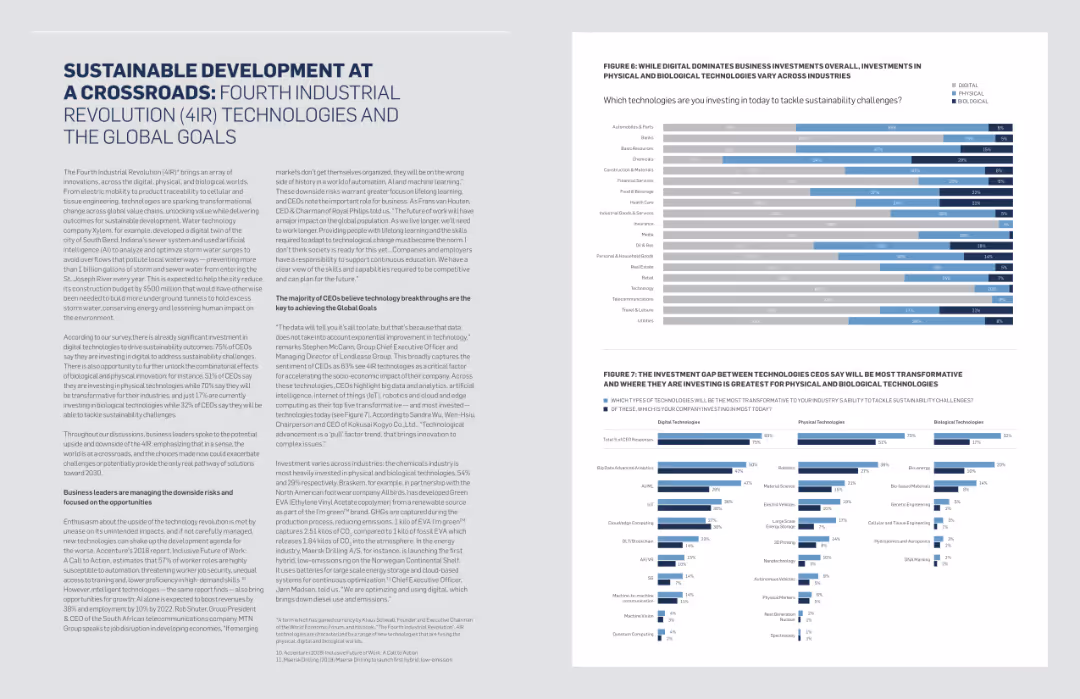
The slide includes a mix of text and two column charts. The charts display data on investments in technologies and their impact on sustainability challenges across industries.
Technology and Digital Transformation
Technology & Software
This slide highlights the role of Fourth Industrial Revolution technologies in achieving global goals, focusing on investment trends and sustainability challenges.
4IR, Technology, Sustainability, Investment, Global Goals, Digital Transformation, Industrial Revolution
false
Technology and Digital Transformation
Technology & Software
Multiple Chart
Accenture
Add to my slides
Remove from favorites
Slide with a column chart detailing underlying PBT for 4Q23, with additional charts showing related metrics and financial performance for the same period.
Financial Performance
Financial Services
The slide provides an overview of UBS's underlying PBT for 4Q23, highlighting key financial metrics and performance indicators.
4Q23 PBT, financial performance, underlying profit, UBS quarterly results
false
Financial Performance
Financial Services
Mixed Chart
UBS
Add to my slides
Remove from favorites
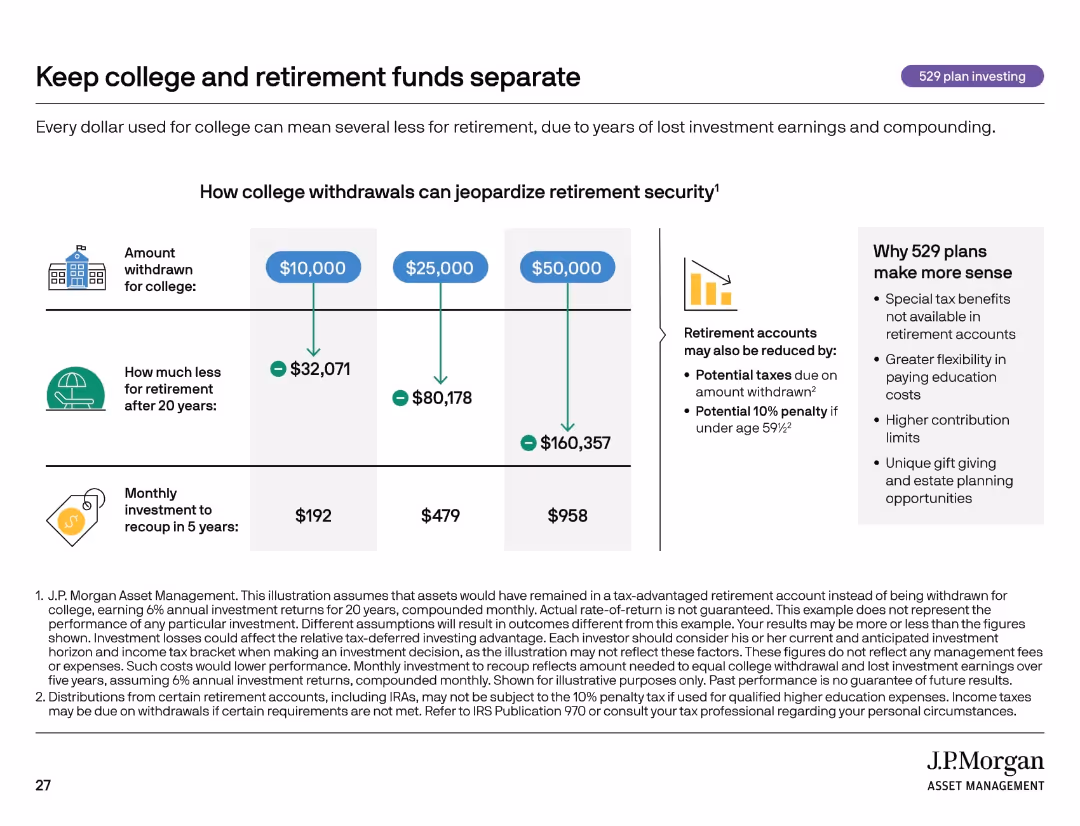
Informational slide with infographic-style design, three-column layout comparing withdrawal scenarios, side panel.
Strategic Planning
Financial Services
Highlights the long-term cost of withdrawing retirement funds to pay for college. It quantifies the loss to retirement savings and monthly investment needed to recoup those losses. Promotes using 529 plans for tax-advantaged education savings.
529 plan, retirement, education funding, compounding, taxes, investing
false
Strategic Planning
Financial Services
Mixed Chart
JP Morgan
Add to my slides
Remove from favorites
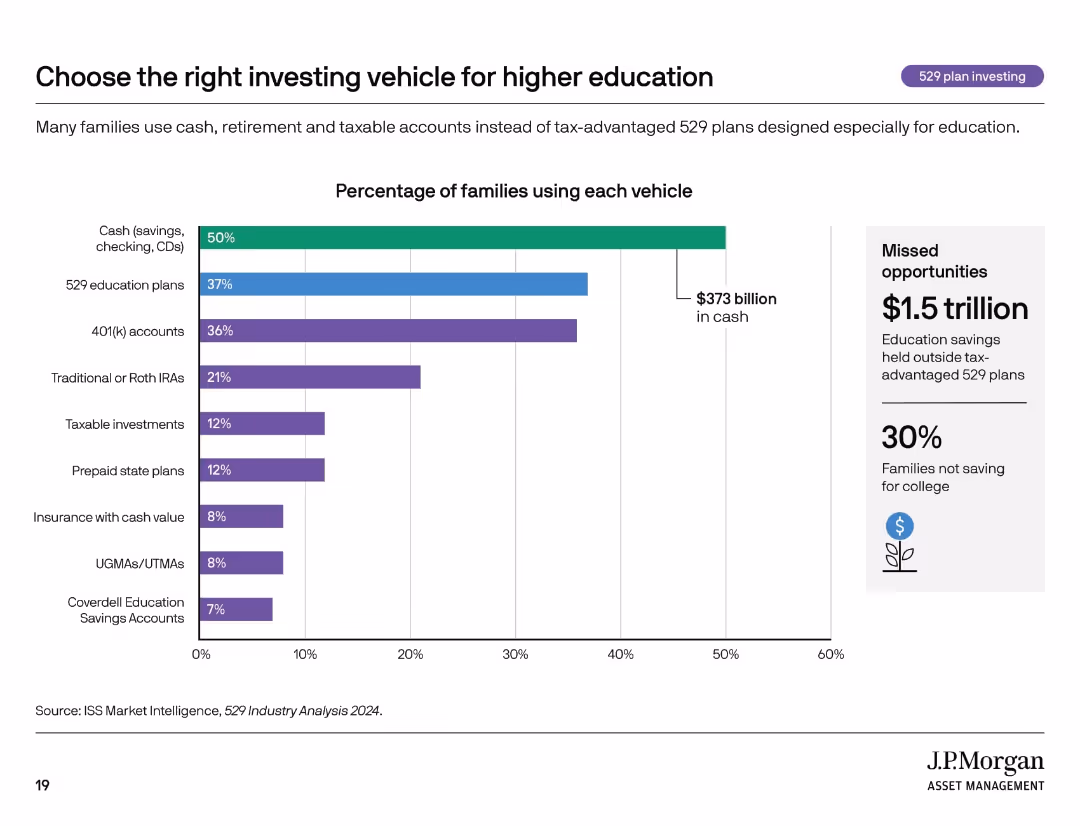
Horizontal bar chart with eight categories, includes monetary value and sidebar showing missed opportunity.
Investment Analysis
Financial Services
This slide outlines the most common savings vehicles families use for education and highlights underutilization of tax-advantaged 529 plans. It compares the percentage of families using different options, including cash, IRAs, and insurance, while emphasizing $1.5 trillion in missed savings efficiency.
529 plans, savings, education investing, cash savings, financial strategy
false
Investment Analysis
Financial Services
Mixed Chart
JP Morgan
Add to my slides
Remove from favorites
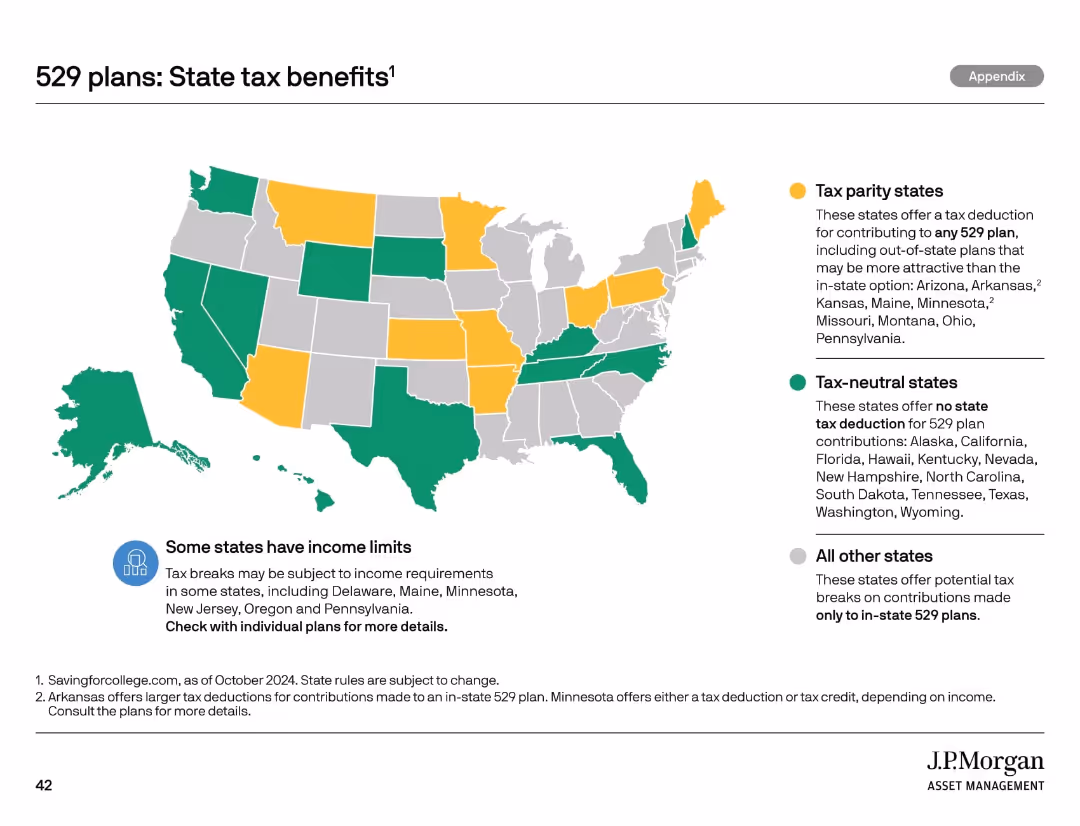
U.S. map color-coded by tax benefit categories. Text boxes explain tax rules and conditions per state.
Regulatory and Compliance
Financial Services
Displays the differences in state tax benefits for 529 plan contributions. Distinguishes between tax parity, tax-neutral, and in-state-only benefit states. Encourages checking local rules for contribution advantages.
529 plan, state tax, map, regulation, contributions
false
Regulatory and Compliance
Financial Services
Mixed Chart
JP Morgan
Add to my slides
Remove from favorites
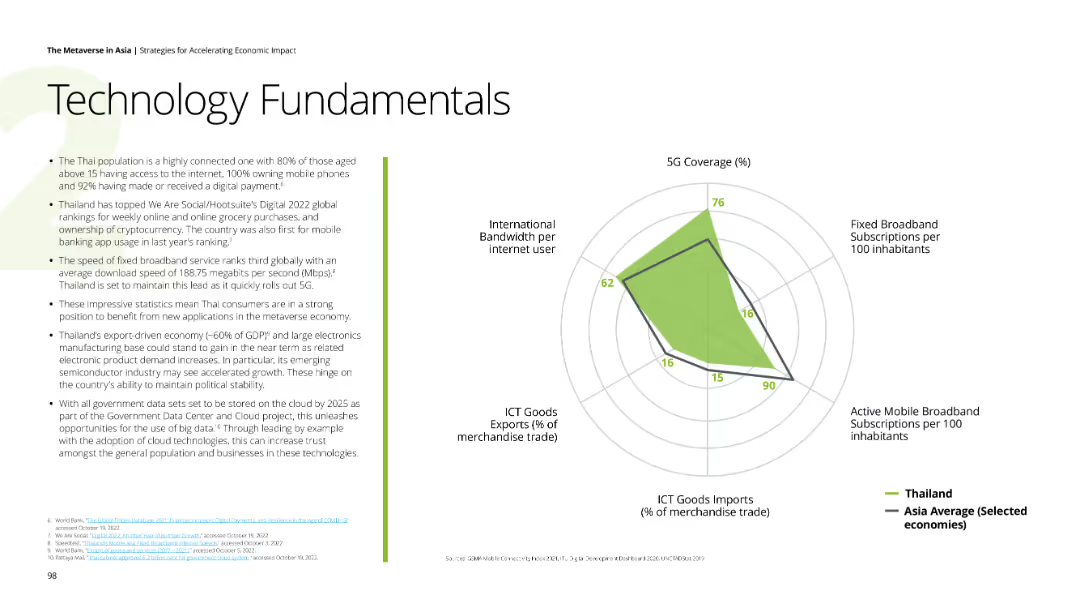
The slide features a radar chart comparing Thailand’s tech metrics against the Asia average. Textual information on the left discusses Thailand’s connectivity, broadband speed, and digital economy initiatives.
Technology and Digital Transformation
Telecommunications
Discusses Thailand’s technological advancements, including 5G coverage, broadband speed, and digital economy, with a focus on enhancing consumer and business tech use.
5G, broadband, digital economy, Thailand, connectivity
false
Technology and Digital Transformation
Telecommunications
Mixed Chart
Deloitte
Add to my slides
Remove from favorites
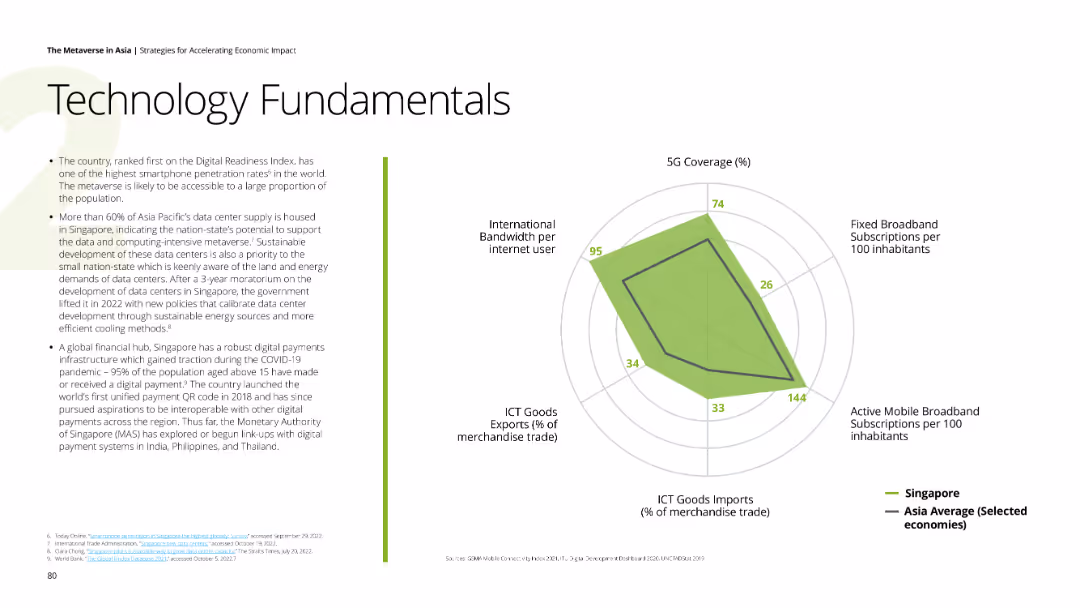
The slide features a radar chart comparing various metrics between Singapore and the Asia average, including 5G coverage, fixed broadband subscriptions, and ICT goods trade. It also includes textual information on the left side of the slide.
Technology and Digital Transformation
Telecommunications
Discusses Singapore’s strong digital infrastructure, high smartphone penetration rate, and the country's leading role in metaverse readiness and data center developments.
5G coverage, broadband, ICT exports, metaverse, digital infrastructure
false
Technology and Digital Transformation
Telecommunications
Mixed Chart
Deloitte
Add to my slides
Remove from favorites
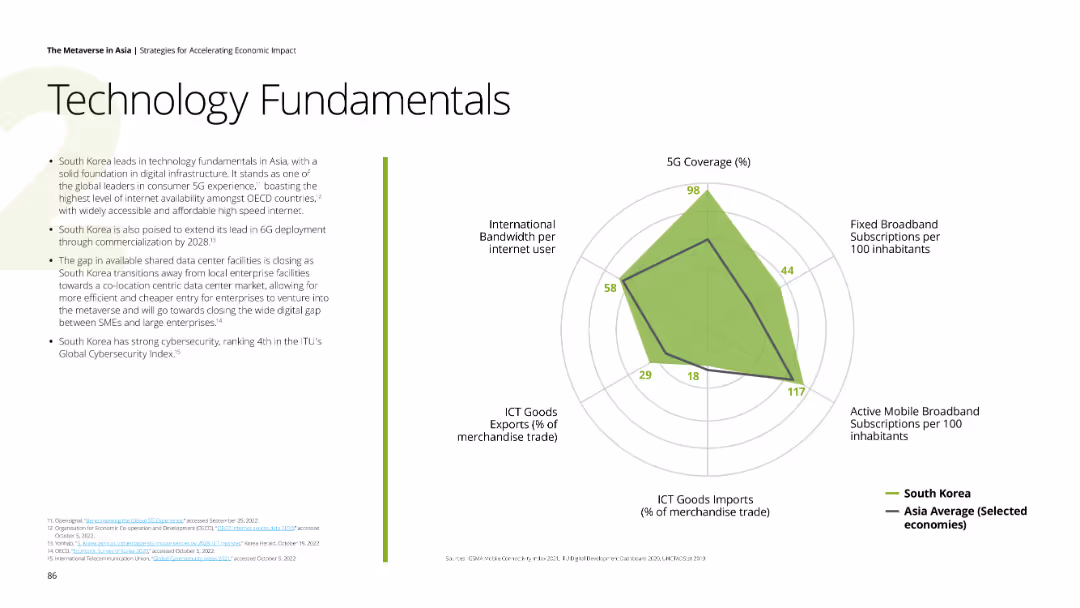
The slide features a radar chart comparing South Korea’s tech metrics against the Asia average. Textual information on the left discusses South Korea’s leadership in digital infrastructure and cybersecurity.
Technology and Digital Transformation
Telecommunications
Describes South Korea’s advancements in technology, 5G coverage, and cybersecurity, with a focus on future developments like 6G and shared data centers.
5G, cybersecurity, digital infrastructure, South Korea, 6G
false
Technology and Digital Transformation
Telecommunications
Mixed Chart
Deloitte
Add to my slides
Remove from favorites
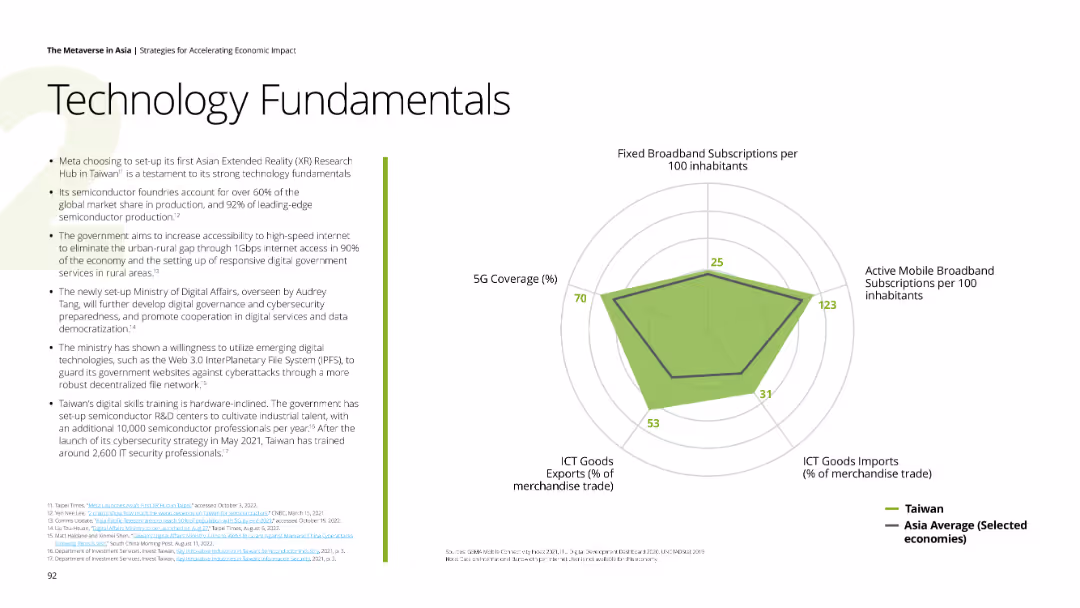
The slide features a radar chart comparing Taiwan’s tech metrics against the Asia average. Textual information on the left discusses Taiwan’s advancements in digital infrastructure and high-speed internet access.
Technology and Digital Transformation
Telecommunications
Highlights Taiwan’s tech fundamentals, including 5G coverage, semiconductor production, and initiatives to enhance digital governance and cybersecurity.
5G, digital infrastructure, semiconductor, Taiwan, cybersecurity
false
Technology and Digital Transformation
Telecommunications
Mixed Chart
Deloitte
Add to my slides
Remove from favorites
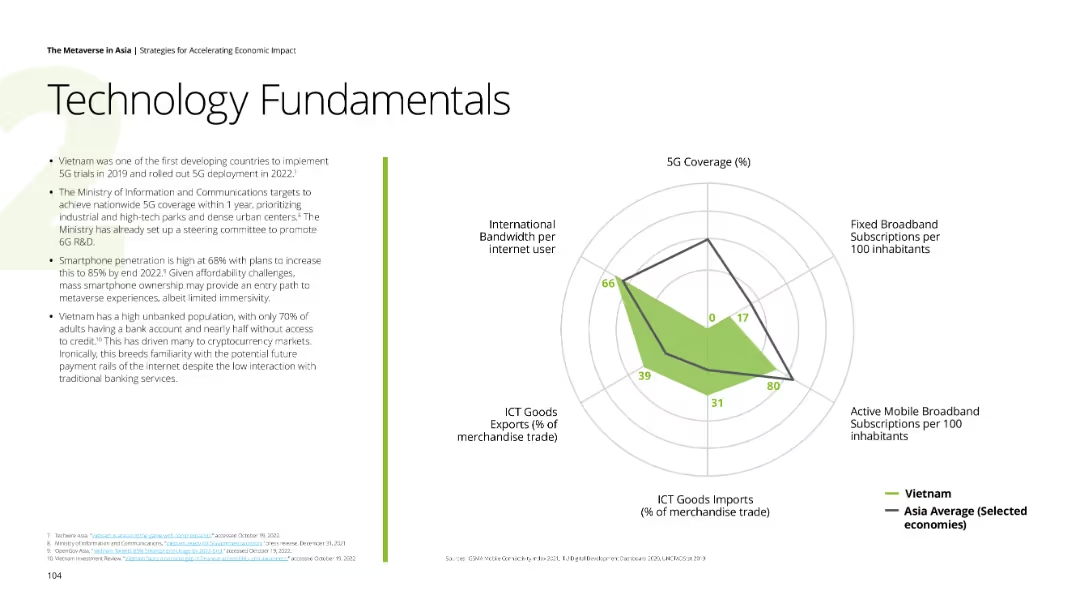
The slide features a radar chart comparing Vietnam’s tech metrics against the Asia average. Textual information on the left discusses Vietnam’s advancements in 5G and smartphone penetration.
Technology and Digital Transformation
Telecommunications
Highlights Vietnam’s technology fundamentals, including 5G coverage, smartphone penetration, and initiatives to enhance digital infrastructure and accessibility.
5G, digital infrastructure, smartphone, Vietnam, accessibility
false
Technology and Digital Transformation
Telecommunications
Mixed Chart
Deloitte
Add to my slides
Remove from favorites
Contains a pie chart comparing user experiences between 4G and 5G networks, using a balanced color scheme to differentiate responses. The slide is visually straightforward and focused.
Technology and Digital Transformation
Telecommunications
Discusses user perceptions of 5G compared to 4G, highlighting improvements and challenges in mobile internet quality. This slide can be used to assess the impact of technological advancements in mobile networks.
5G, mobile internet, user experience, 4G, technology
false
Technology and Digital Transformation
Telecommunications
Mixed Chart
Deloitte
Add to my slides
Remove from favorites
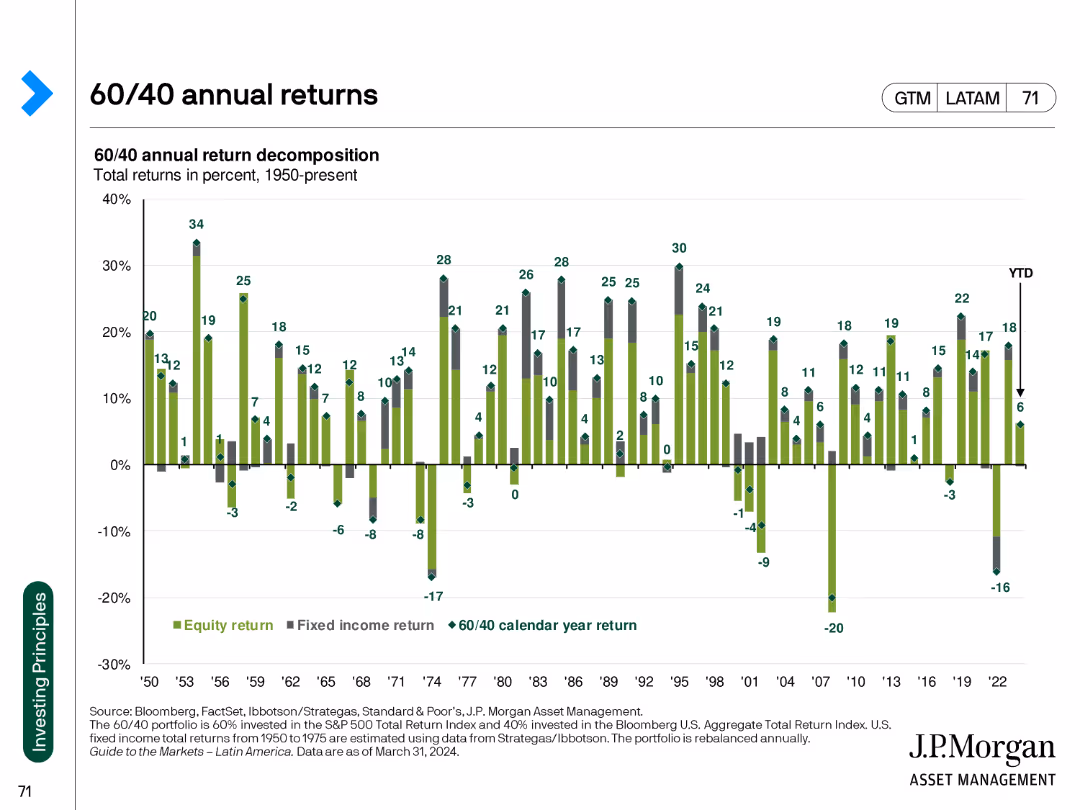
The slide presents a bar chart comparing annual returns of a 60/40 equity and fixed income portfolio over several decades.
Market Analysis and Trends
Financial Services
The slide analyzes the historical performance of a balanced 60/40 portfolio, useful for understanding long-term investment returns and risk management.
60/40 portfolio, annual returns, historical performance, equity, fixed income, investment strategy, financial analysis, market trends
false
Market Analysis and Trends
Financial Services
Single Chart
JP Morgan
Add to my slides
Remove from favorites
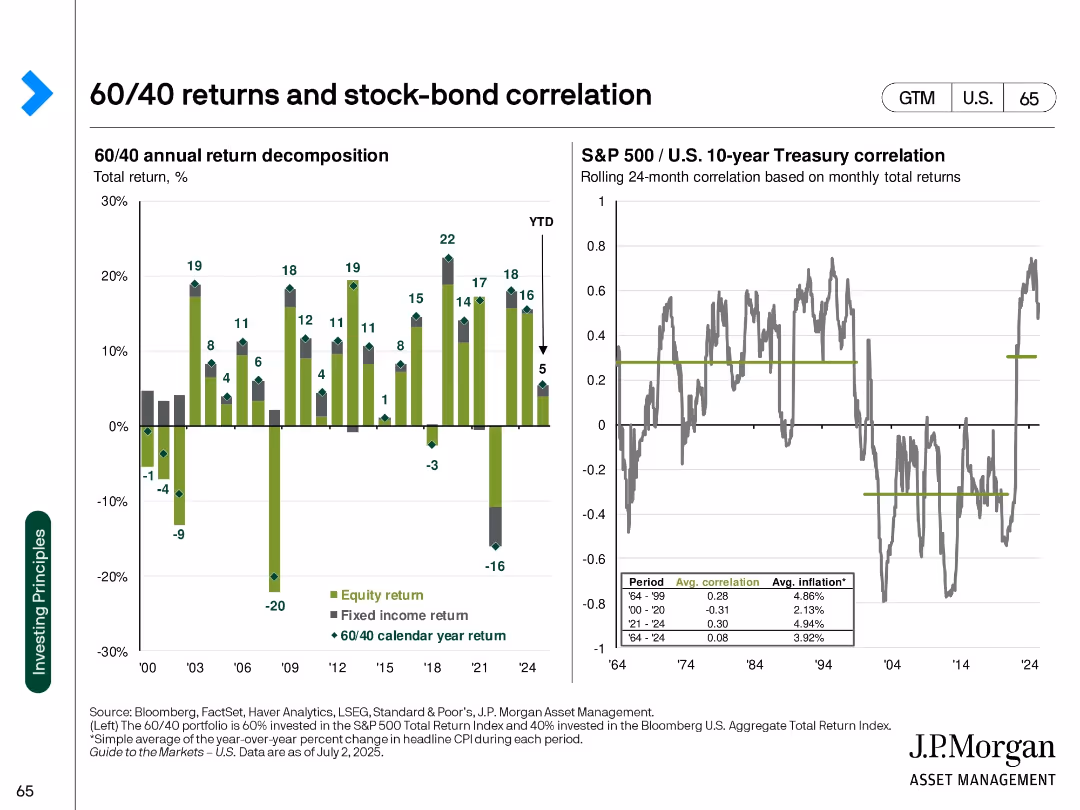
Two-panel chart with bar chart (return decomposition) and line chart (correlation over time)
Financial Performance
Financial Services
Shows yearly breakdown of 60/40 portfolio returns into equity and fixed income components, alongside historical correlation between stocks and bonds. Analyzes inflation periods as well.
60/40 returns, stock-bond correlation, equity return, fixed income, annual performance, inflation, diversification
false
Financial Performance
Financial Services
Multiple Chart
JP Morgan
Add to my slides
Remove from favorites
Timeline diagram comparing wireless communication networks (1G to 6G) across selected KPIs. List of use cases benefiting from 6G technology on the right.
Technology and Digital Transformation
Technology & Software
The slide explores the advancements in wireless communication technologies from 1G to 6G, highlighting the improvements in KPIs like peak data rate and latency. It lists potential use cases for 6G, emphasizing its role in supporting data-hungry applications and enabling fundamental innovations.
6G, Wireless Communication, Innovation, KPIs
false
Technology and Digital Transformation
Technology & Software
Mixed Chart
Roland Berger
Add to my slides
Remove from favorites
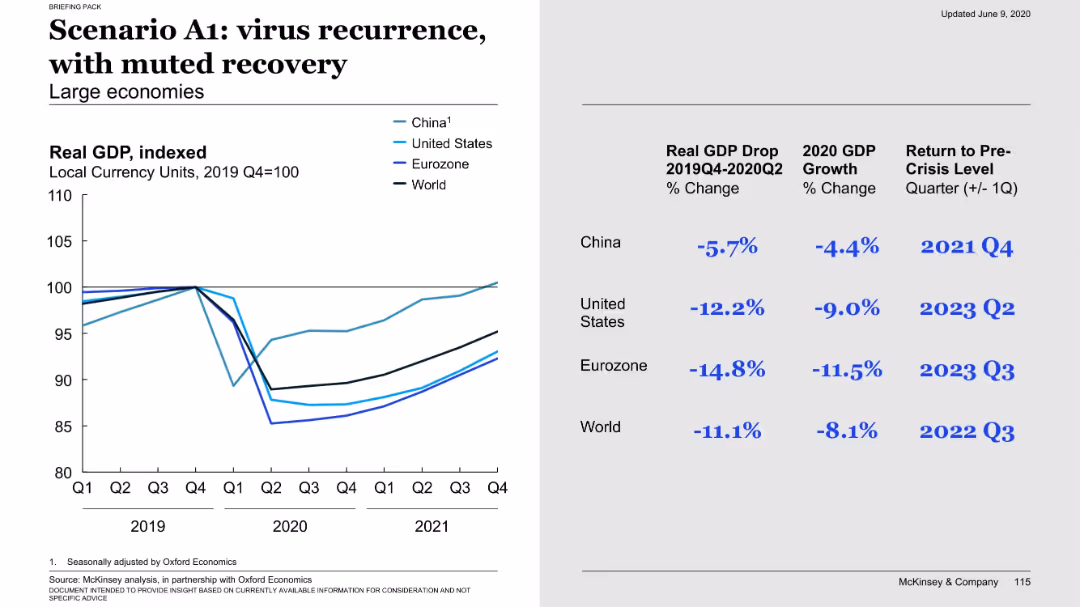
Similar layout to 17457, with graph and economic stats. Displays more prolonged and weaker recovery paths for all regions.
Financial Performance
Government & Public Sector
The A1 scenario models virus recurrence with slow economic recovery. It shows deeper GDP drops and delayed return to pre-crisis levels, especially for the US and Eurozone. This represents a pessimistic but plausible recovery path.
A1, virus recurrence, GDP decline, muted recovery, slow growth, scenario, economic impact, crisis
false
Financial Performance
Government & Public Sector
Mixed Chart
McKinsey
Add to my slides
Remove from favorites
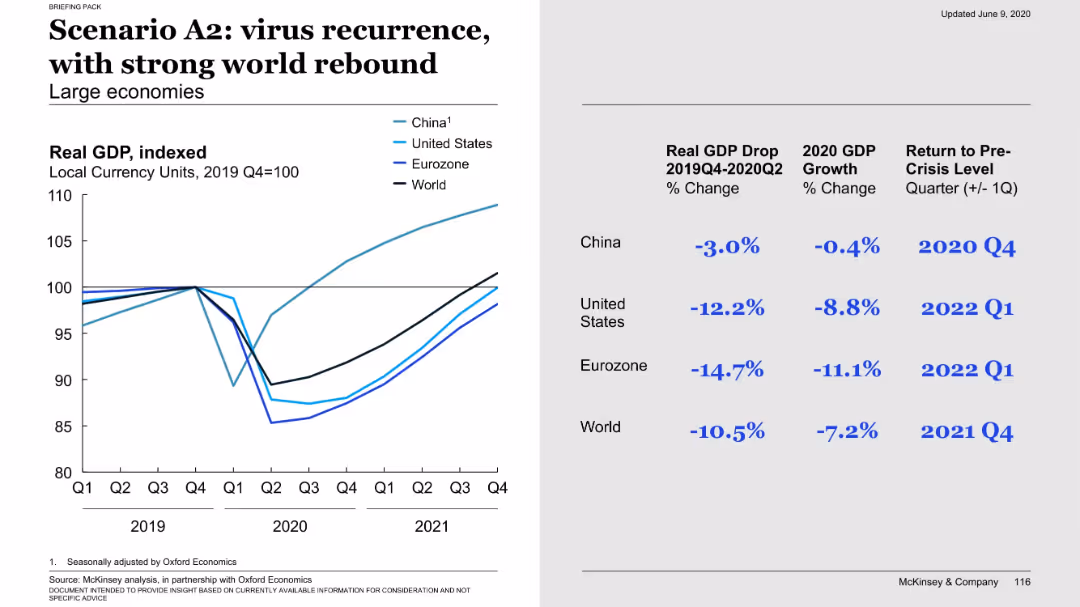
Graph on left shows faster rebound than A1; economic data on right shows a more optimistic path for all major economies.
Financial Performance
Government & Public Sector
A more optimistic recurrence scenario (A2) where strong global policy response drives a sharp recovery. GDP drops are significant but the rebound is faster, especially for China, returning to pre-crisis levels by late 2021 or early 2022.
A2, virus recurrence, strong rebound, GDP recovery, global policy, economic impact, scenario, growth
false
Financial Performance
Government & Public Sector
Mixed Chart
McKinsey
Add to my slides
Remove from favorites
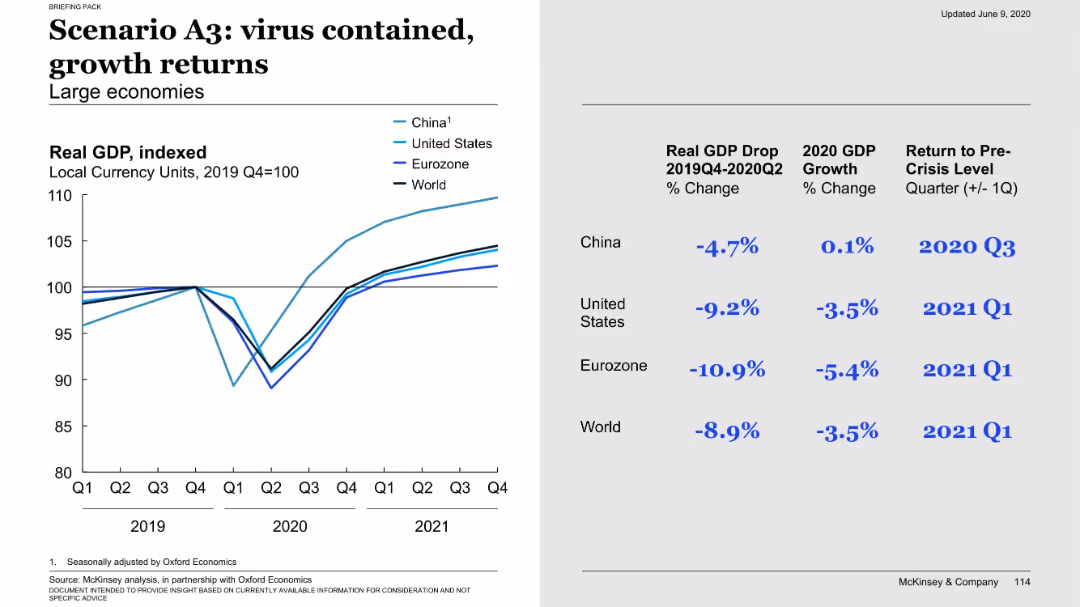
Left side graph showing GDP recovery curves; right side contains economic data for China, US, Eurozone, and World.
Financial Performance
Government & Public Sector
A best-case scenario where the virus is contained and economic growth returns quickly. The chart compares GDP index recovery for major economies and highlights minimal GDP contraction for China with faster recovery compared to the US and Europe.
A3, growth, GDP, virus contained, recovery, economic rebound, China, US, Eurozone, scenario
false
Financial Performance
Government & Public Sector
Mixed Chart
McKinsey
Add to my slides
Remove from favorites
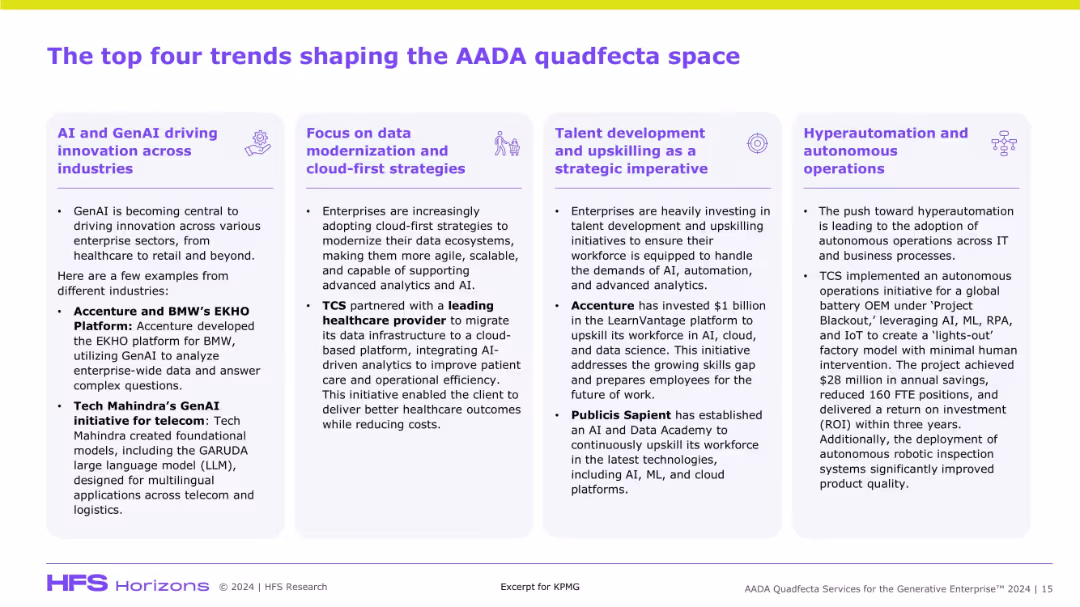
Four-column layout with bold headings and icons per trend. Purple and white color palette with bullet point explanations and industry use cases.
Technology and Digital Transformation
Artificial Intelligence
The slide outlines key trends influencing AADA (Analytics, Automation, Data, AI), including GenAI innovation, cloud modernization, talent upskilling, and hyperautomation. Examples like BMW, TCS, and Accenture support each trend’s relevance across sectors.
AADA, GenAI, cloud, talent, automation, TCS, Accenture, data strategies, transformation, AI initiatives
false
Technology and Digital Transformation
Artificial Intelligence
Pillar
KPMG
Add to my slides
Remove from favorites
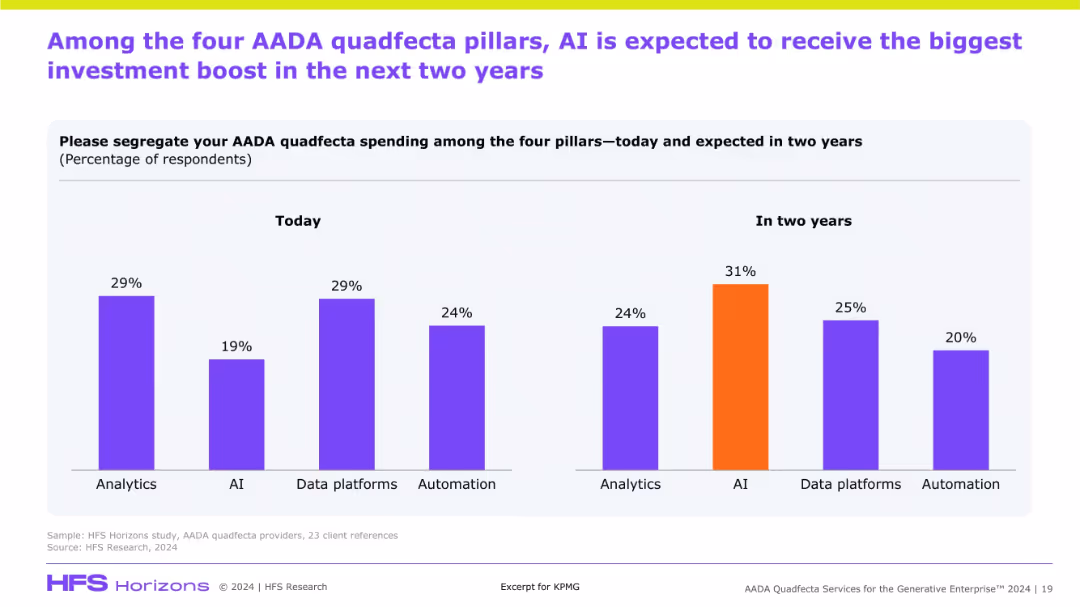
Double bar chart comparing current and future investment allocation across AADA pillars. AI shows the highest projected increase.
Investment Analysis
Artificial Intelligence
The slide compares current and expected investment distribution across AADA pillars, showing AI as the largest growth area. It illustrates a shift in strategic focus toward AI over the next two years.
AADA investment, AI, analytics, automation, data platforms, future spend, strategic focus
false
Investment Analysis
Artificial Intelligence
Multiple Chart
KPMG
Add to my slides
Remove from favorites
White background with a bar chart showing the marginal abatement cost curve. Clear labeling and color coding for different cost ranges.
Financial Performance
Environmental Services & Sustainability
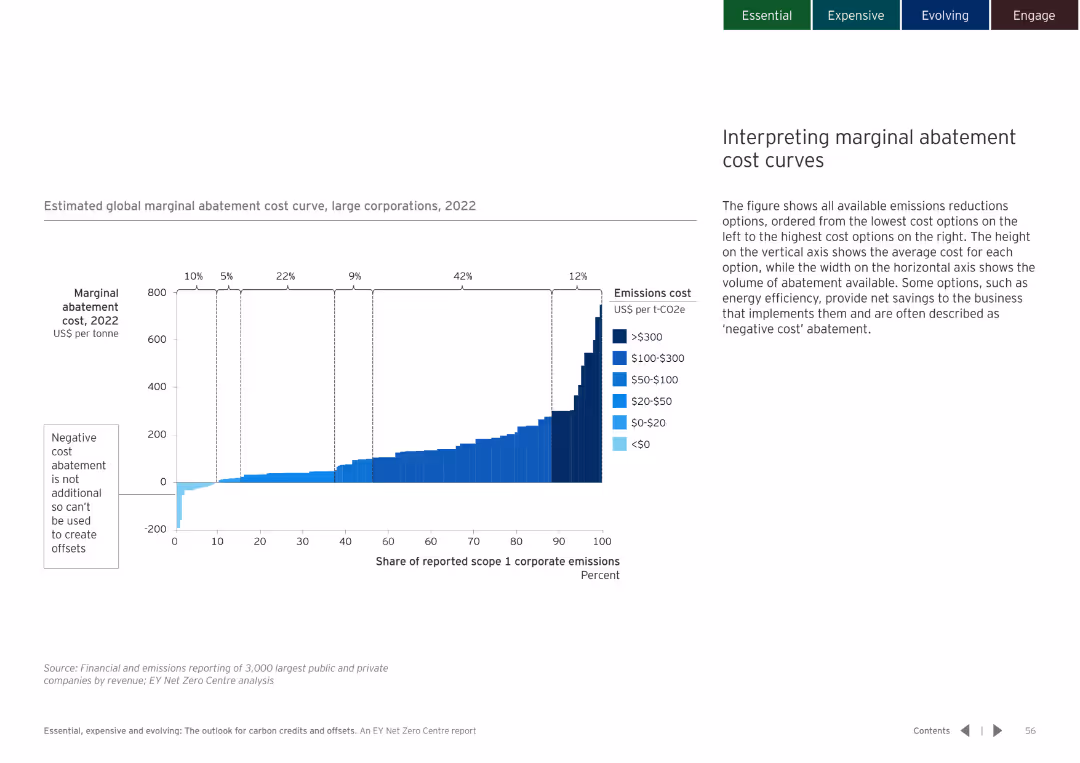
Explains the interpretation of marginal abatement cost curves and the implications for emissions reduction strategies.
abatement cost curves, emissions reduction, cost interpretation
false
Financial Performance
Environmental Services & Sustainability
Mixed Chart
EY
Add to my slides
Remove from favorites
The slide includes a column chart showing abatement potential versus cost for various materials. The chart uses different shades of blue to represent different materials.
Operational Efficiency
Energy & Utilities
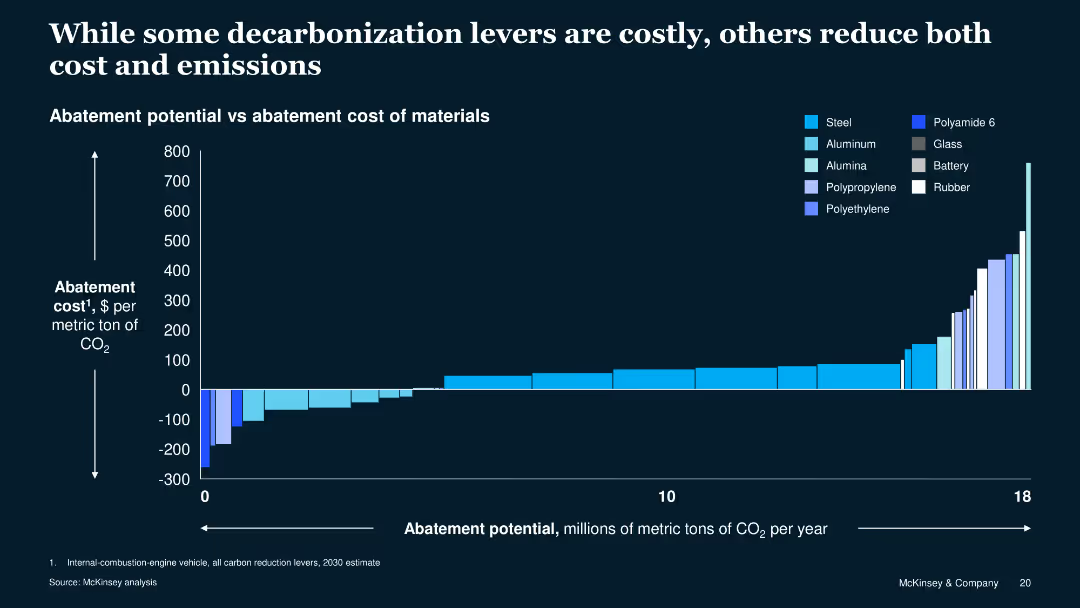
This slide compares the cost and potential CO2 reduction of various materials used in manufacturing, illustrating that some options can reduce both costs and emissions.
abatement, cost, emissions, materials, comparison, manufacturing, energy, efficiency, sustainability, decarbonization
false
Operational Efficiency
Energy & Utilities
Single Chart
McKinsey
Add to my slides
Remove from favorites
Scatterplot showing 16 ideas by potential and deployability; legend on the right lists the top 13 ideas with category color codes.
Strategic Planning
Environmental Services & Sustainability
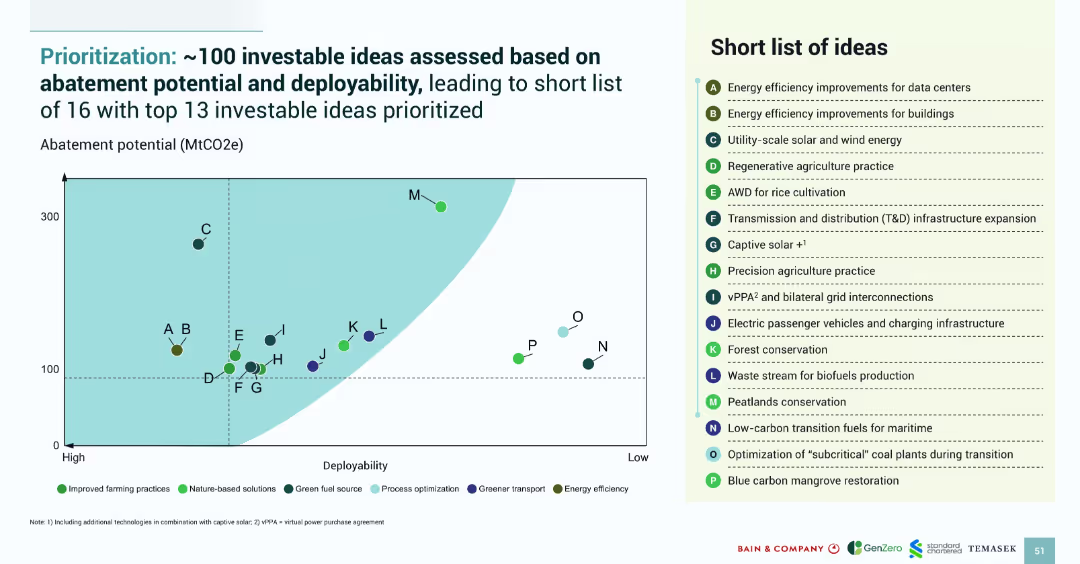
This slide displays the prioritization of 100 green investment ideas, highlighting the top 13 based on abatement potential and deployability. The scatterplot visually identifies top opportunities, such as regenerative agriculture and solar/wind, with category-based color groupings.
abatement potential, deployability, prioritization, green ideas, SEA investments, climate strategy
false
Strategic Planning
Environmental Services & Sustainability
Mixed Chart
Bain
Add to my slides
Remove from favorites
The slide features bar charts and a column chart showing ABS debt by servicer, transaction amounts by year, and current outstanding debt by tranche.
Market Analysis and Trends
Financial Services
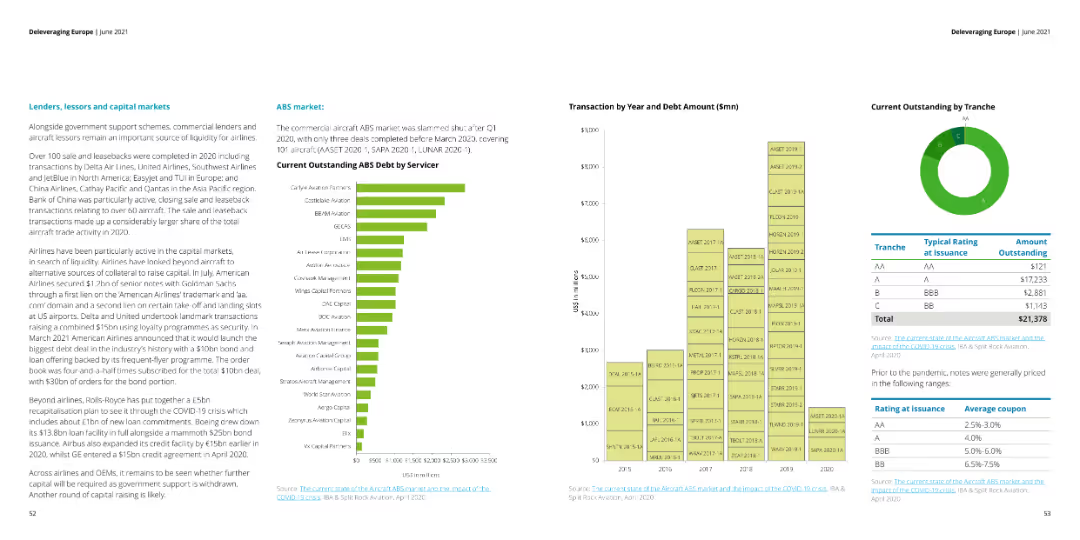
This slide provides an analysis of the capital markets for lenders, lessors, and ABS debt, highlighting trends in transactions, outstanding debt, and market activity.
ABS debt, capital markets, transactions, trends
false
Market Analysis and Trends
Financial Services
Mixed Chart
Deloitte
Add to my slides
Remove from favorites
The slide shows a dual-axis line chart tracking accelerator attendance and equity investment over time, with text descriptions on accelerator impacts.
Market Analysis and Trends
Technology & Software
It discusses the role and impact of accelerators in Edinburgh, showing trends in equity investment and accelerator attendance from 2011 to 2020, with a focus on local technology growth.
accelerators, investment, Edinburgh, technology, growth, equity, government role, startup support, local ecosystem, economic development
false
Market Analysis and Trends
Technology & Software
Mixed Chart
Barclays
Add to my slides
Remove from favorites
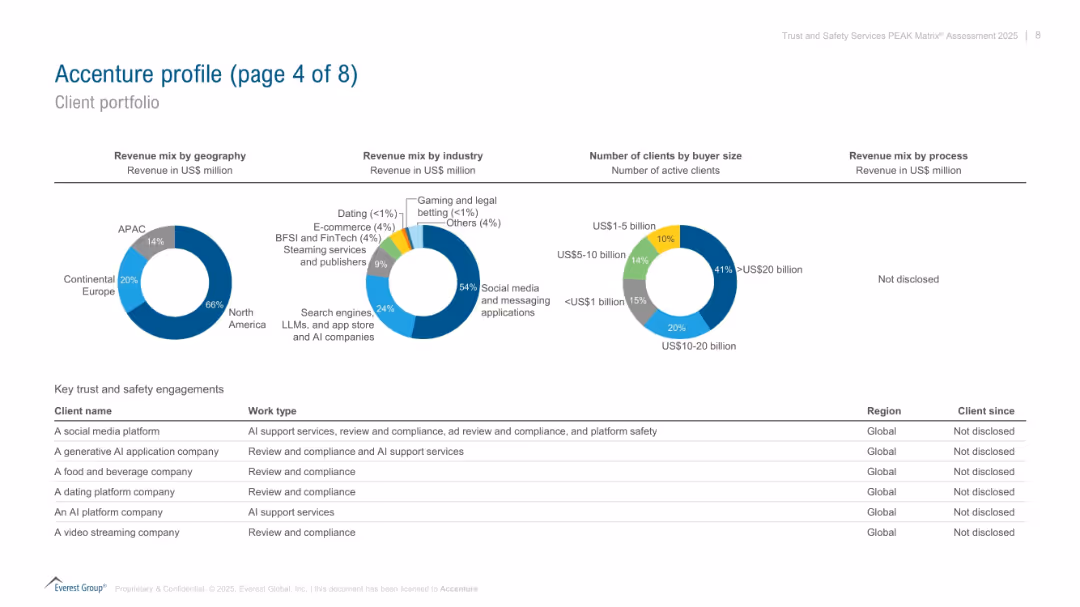
Combination of three pie charts (revenue breakdown by geography, industry, buyer size) and client list table below; data-rich and structured.
Client Case Studies
Technology & Software
Analyzes Accenture’s client portfolio in trust and safety services, with breakdowns by geography, industry, and client size. Lists sample client engagements across social media, AI platforms, streaming, and more, without disclosing client names.
Accenture, client portfolio, trust and safety, revenue, AI, industry breakdown, client size
false
Client Case Studies
Technology & Software
Mixed Chart
Accenture
Add to my slides
Remove from favorites
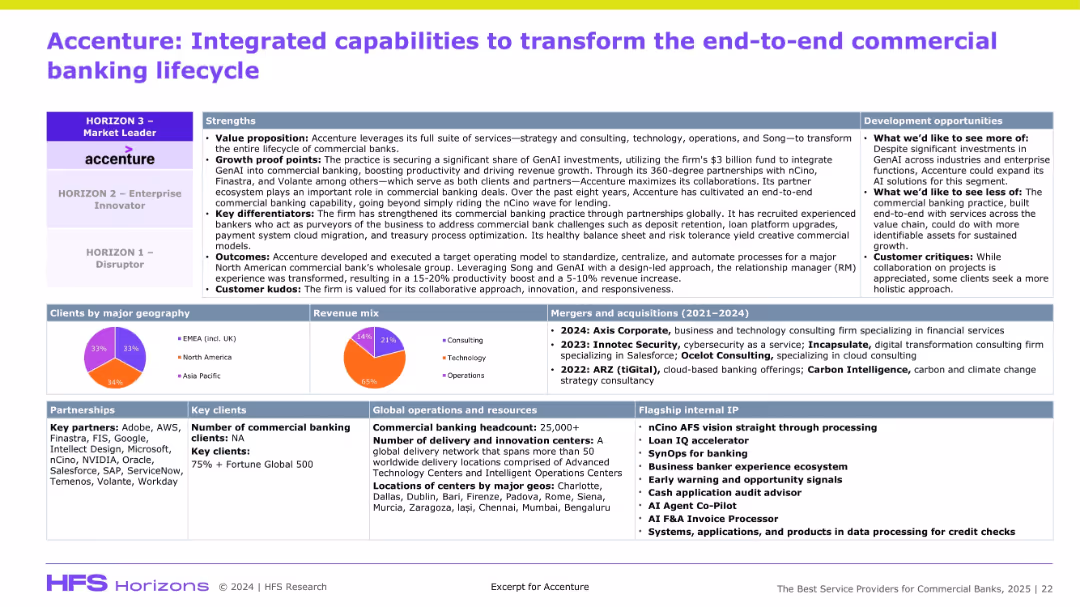
Dense slide divided into multiple boxed sections: strengths, clients by geography, revenue mix, partnerships, acquisitions, internal capabilities, and flagship IP. Uses colorful pie charts and icons with a corporate report-style layout.
Product and Service Analysis
Professional Services
The slide details Accenture’s strategic capabilities in commercial banking, emphasizing GenAI integration, ecosystem partnerships, revenue sources, and operational footprint. It highlights Accenture’s positioning as a market leader, key acquisitions, and its geographic and technological depth in banking services.
Accenture, Commercial Banking, GenAI, Partnerships, Revenue Mix, Strategy, M&A, Flagship IP, Digital, Operations
false
Product and Service Analysis
Professional Services
Mixed Chart
Accenture
Add to my slides
Remove from favorites
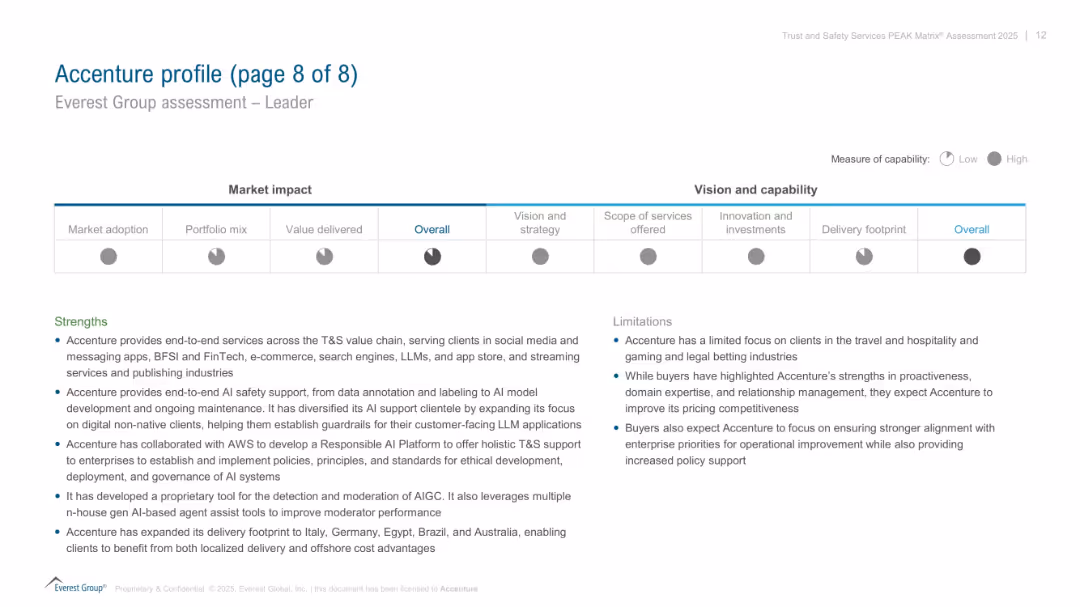
Split layout: radar-style visual for capabilities (top), text sections for strengths and limitations (bottom); corporate and professional style.
Competitive Landscape
Technology & Software
Final profile summary of Accenture in the PEAK Matrix assessment. Visualizes its performance across several dimensions (vision, services, investments). Text highlights Accenture’s strengths in AI safety and end-to-end solutions, with noted client and pricing focus limitations.
Accenture, PEAK Matrix, AI safety, capabilities, limitations, client focus, strengths
false
Competitive Landscape
Technology & Software
Mixed Chart
Accenture
Add to my slides
Remove from favorites
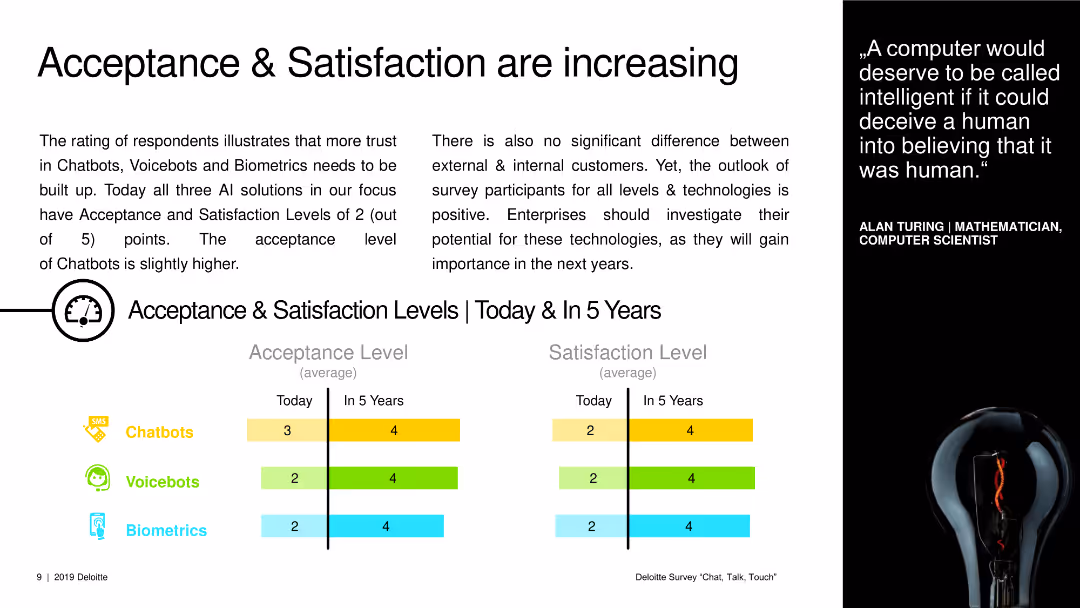
A text slide with charts showing current and future acceptance and satisfaction levels for chatbots, voicebots, and biometrics.
Market Analysis and Trends
Technology & Software
The slide presents data on current and projected acceptance and satisfaction levels for various AI technologies over the next five years.
acceptance levels, satisfaction levels, AI technologies, chatbots, voicebots, biometrics, future trends
false
Market Analysis and Trends
Technology & Software
Multiple Chart
Deloitte
Add to my slides
Remove from favorites
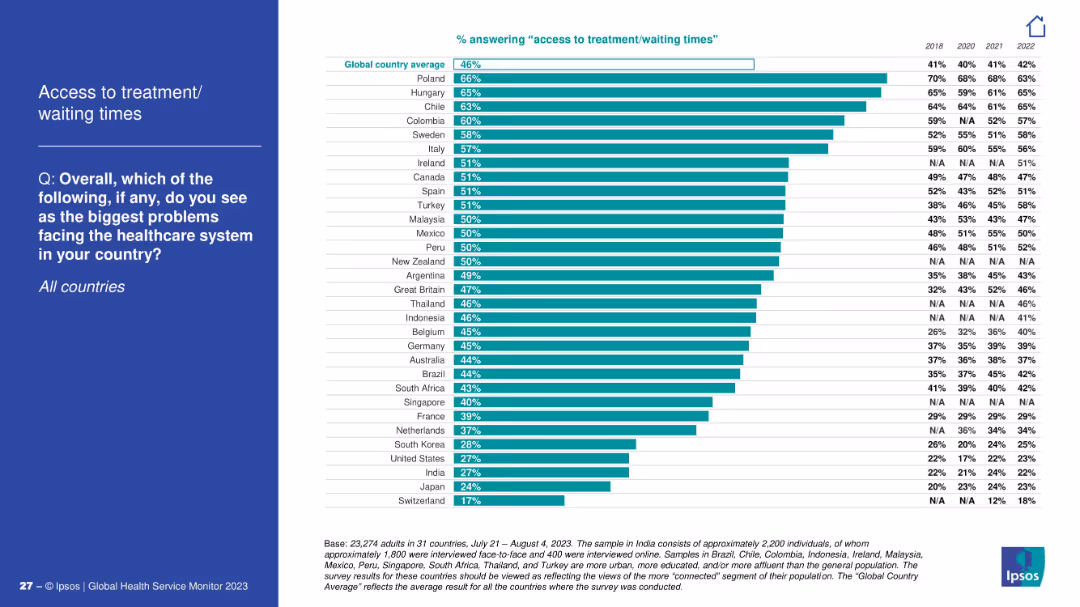
Vertical bar chart by country; left panel contains the title and question.
Performance Metrics and KPIs
Healthcare & Pharmaceuticals
This slide compares perceived issues with access to treatment and wait times across countries. Poland, Hungary, and Chile report the highest concern. Yearly comparison data is shown from 2018 to 2022.
access to care, wait times, global healthcare
false
Performance Metrics and KPIs
Healthcare & Pharmaceuticals
Mixed Chart
IPSOS
Add to my slides
Remove from favorites
Includes a donut chart and a gauge chart detailing managerial accountability in performance. The visual elements are color-coded to represent different levels of agreement or disagreement among respondents.
Human Resources and Talent Management
Professional Services
Discusses the accountability of managers for both their performance and their team’s, valuable for leadership training and development workshops.
accountability, management, performance
false
Human Resources and Talent Management
Professional Services
Multiple Chart
PwC/Strategy&
Add to my slides
Remove from favorites
A pie chart showing an 80% reduction in time spent on payables and expenses, with icons representing benefits such as cost savings and improved control.
Technology and Digital Transformation
Financial Services
Highlights the benefits of automating accounts payable within finance, notably in time savings and enhanced spend visibility and control.
accounts payable, automation, finance, time savings, cost savings, spend visibility, control, digital transformation
false
Technology and Digital Transformation
Financial Services
Mixed Chart
Deloitte
Add to my slides
Remove from favorites
The slide features four product images of Horlicks and Boost brands with circular charts above them depicting market share and profitability. There is also a large text box on the left displaying financial metrics.
Market Analysis and Trends
Consumer Goods
This slide highlights the acquisition of Horlicks and Boost, emphasizing their market positions and financial significance within the functional nutrition sector.
acquisition, nutrition, market share, profitability, functional nutrition
false
Market Analysis and Trends
Consumer Goods
Multiple Chart
Deutsche Bank
Add to my slides
Remove from favorites
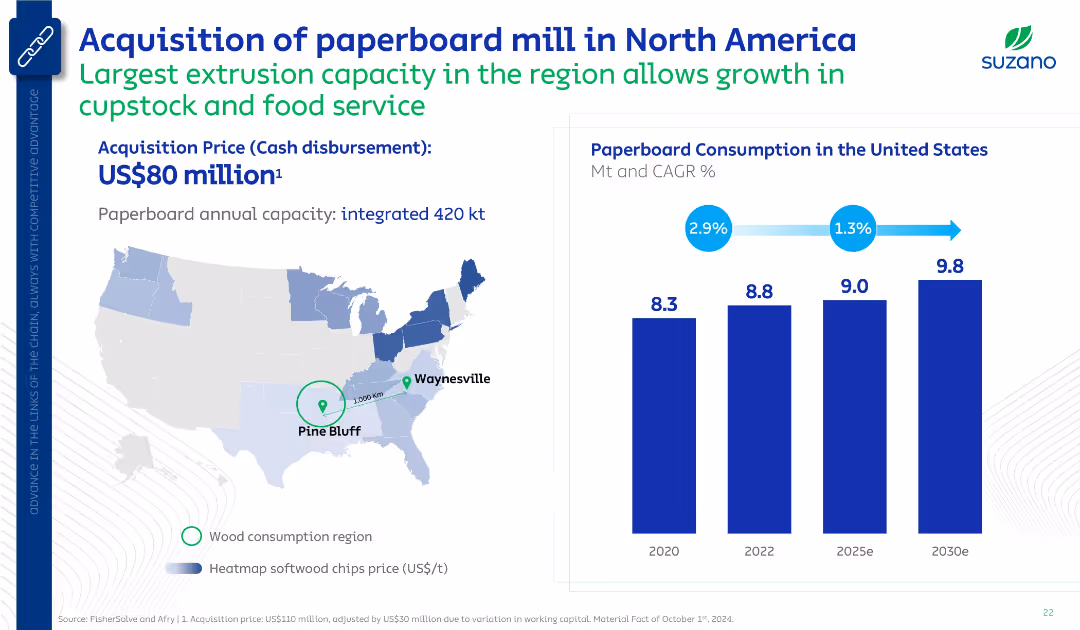
Mixed layout with map and bar chart. Shows location and details of new mill plus projected paperboard consumption in the U.S. Uses corporate blue branding and minimal text for clarity.
Mergers and Acquisitions
Industrial & Manufacturing
Announces acquisition of a paperboard mill with high extrusion capacity to target food service markets. Supports growth in U.S. paperboard demand with estimated increase from 8.3 Mt (2020) to 9.8 Mt (2030e).
acquisition, paperboard, Suzano, North America, capacity, Pine Bluff
false
Mergers and Acquisitions
Industrial & Manufacturing
Multiple Chart
Goldman Sachs
Add to my slides
Remove from favorites
Text explaining the acquisition's impact on payment capabilities, graphs displaying revenue and growth projections, and logos of payment services. An image of the Newline™ service by Fifth Third.
Investment Analysis
Financial Services
Discusses the impact of the Rize acquisition on enhancing embedded payment capabilities and growth projections. Used for investor communications and showcasing digital transformation in payments.
acquisition, payments, digital transformation, fintech, growth projection, technology
false
Investment Analysis
Financial Services
Mixed Chart
Morgan Stanley
Add to my slides
Remove from favorites
Features comparative pie charts showing revenue breakdowns, efficiently comparing data pre- and post-acquisition.
Mergers and Acquisitions
Financial Services
Analyzes the geographical revenue impact of Faurecia's acquisition of Clarion, highlighting the strategic benefits and increased market presence in Asia, particularly with Japanese OEMs.
acquisition, revenue, market presence, Asia, automotive, OEMs
false
Mergers and Acquisitions
Financial Services
Multiple Chart
Deutsche Bank
Add to my slides
Remove from favorites
The slide includes a quote, a bar chart, and a conclusion section. The background features an abstract visual with a burst of colors.
Mergers and Acquisitions
Financial Services
The slide discusses the role of communication teams in acquisitions, emphasizing their importance throughout the transaction lifecycle.
Acquisitions, communication, stakeholder, HR, IR, integration, synergies, corporate, lifecycle, challenges
false
Mergers and Acquisitions
Financial Services
Mixed Chart
IPSOS
Add to my slides
Remove from favorites
The slide includes a column chart with blue and red columns for assets, deposits, and loans, a map of branch footprints, and two company logos. The layout is balanced between text and visuals.
Financial Performance
Financial Services
This slide presents financial data highlighting the growth due to acquisitions, emphasizing market position and customer base expansion. It's used to communicate business growth and performance metrics.
acquisitions, customer base, financial data, growth, market position
false
Financial Performance
Financial Services
Multiple Chart
Goldman Sachs
Add to my slides
Remove from favorites
Slide with multiple 3D column charts showing capital deployment over fiscal years and the number of acquisitions.
Mergers and Acquisitions
Technology & Software
Analyzes Accenture’s strategic investments in acquisitions, highlighting the capital deployed and the increased number of acquisitions to enhance capabilities.
acquisitions, investments, skills, capital deployment, strategic growth, Accenture, capabilities, fiscal year, enhancement
false
Mergers and Acquisitions
Technology & Software
Mixed Chart
Accenture
Add to my slides
Remove from favorites
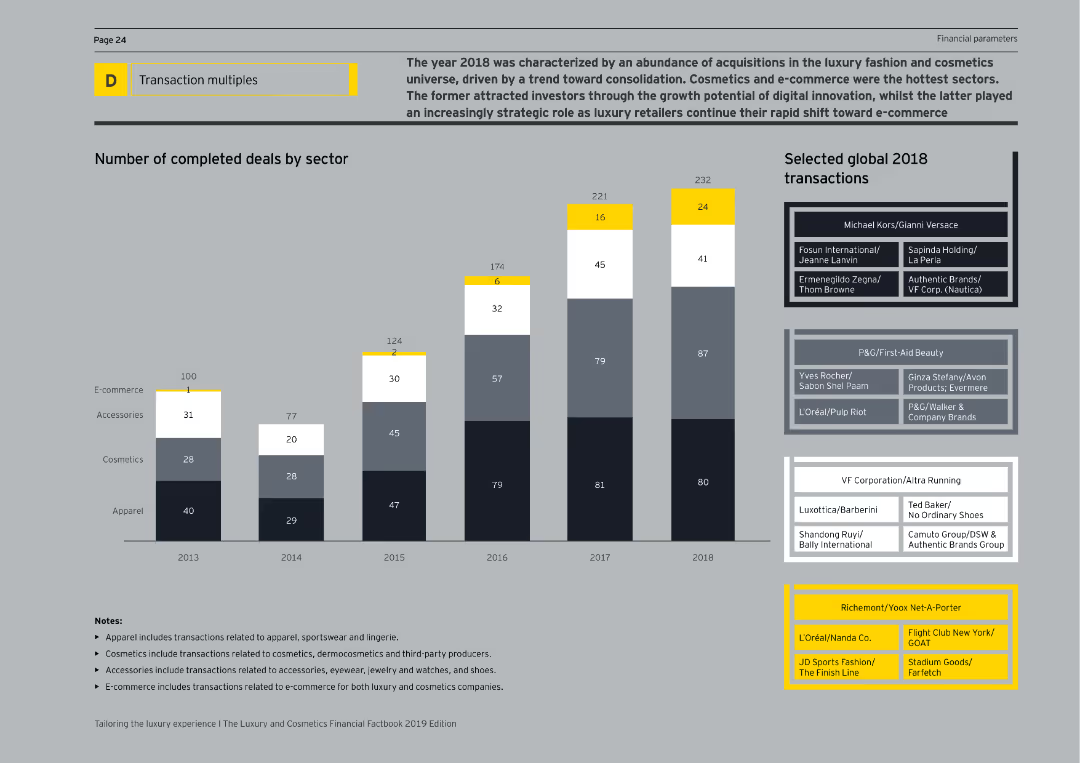
The slide features a column chart displaying the number of completed deals by sector from 2013 to 2018, and a list of selected global 2018 transactions on the right. The visual complexity is moderate, with clear labels and sector breakdowns.
Mergers and Acquisitions
Consumer Goods
The slide summarizes the acquisition activities in the luxury fashion and cosmetics sectors for 2018, highlighting the number of deals completed in various sectors such as e-commerce, accessories, cosmetics, and apparel, along with notable global transactions.
Acquisitions, Luxury, Fashion, Cosmetics, Deals
false
Mergers and Acquisitions
Consumer Goods
Mixed Chart
EY
Add to my slides
Remove from favorites
The slide features a stacked column chart showing the use of proceeds for M&A, refinancing, and other purposes from 2006 to 2018.
Investment Analysis
Financial Services
The slide highlights the use of leveraged finance proceeds in M&A activities in 2018 and the strong outlook for M&A in 2019, supported by data.
acquisitions, M&A, leveraged finance, proceeds, 2018, 2019, outlook, refinancing, investment analysis
false
Investment Analysis
Financial Services
Mixed Chart
Credit Suisse
Add to my slides
Remove from favorites
The slide features text with a survey bar chart and an image illustrating the importance of communication in acquisitions and stakeholder management.
Mergers and Acquisitions
Professional Services
Analyzes the role of corporate communications in successful acquisitions, emphasizing the need for stakeholder management and communication strategies.
Acquisitions, stakeholder communication, survey, mergers, corporate strategy
false
Mergers and Acquisitions
Professional Services
Mixed Chart
IPSOS
Add to my slides
Remove from favorites
Features column charts detailing the financial aspects of an acquisition, including breakdowns of loans, deposits, and expected impacts on financial metrics.
Mergers and Acquisitions
Financial Services
Details the acquisition of Tesco Bank's retail banking division, focusing on the financial benefits, expected impacts, and integration strategies.
acquisition, Tesco Bank, financial impact, retail banking, integration, Barclays, deposits, loans
false
Mergers and Acquisitions
Financial Services
Multiple Chart
Barclays
Add to my slides
Remove from favorites
Details acquisition impacts with financial metrics and future growth opportunities.
Mergers and Acquisitions
Financial Services
Explains the strategic benefits of Tesco Bank acquisition for growth and market presence.
acquisition, Tesco Bank, growth, strategy, market presence
false
Mergers and Acquisitions
Financial Services
Linear Flow
Barclays
Add to my slides
Remove from favorites
The slide features a large logo of Xperiti, a text description on the left, and a Venn diagram on the right showing the integration of traditional research firms, tech-enabled expert networks, and traditional expert networks.
Mergers and Acquisitions
Technology & Software
The slide describes the acquisition of Xperiti, highlighting its digital platform for AI-driven professional recruitment and its integration into Ipsos' market research capabilities.
acquisition, Xperiti, tech-enabled, market research, AI
false
Mergers and Acquisitions
Technology & Software
Framework
IPSOS
Add to my slides
Remove from favorites
Slide is a straightforward table layout listing acronyms used in the presentation. Each row has the acronym and its full meaning.
Market Analysis and Trends
Education & Training
Serves as a reference material providing definitions for various acronyms related to green economy and investments used throughout the presentation, facilitating better understanding for the audience.
acronyms, glossary, green economy
false
Market Analysis and Trends
Education & Training
Text Only
Bain
Add to my slides
Remove from favorites
This slide uses a mix of text and simple graphics to outline three main actions: leadership commitment, allyship, and employee-centric programs. It has a clean and organized layout.
Human Resources and Talent Management
Government & Public Sector
The slide provides actionable steps for corporate Canada to enhance diversity and inclusion: fostering leadership commitment, promoting allyship, and implementing employee-centric programs.
Actionable Steps, Leadership, Allyship, Employee-Centric, Diversity, Inclusion, Corporate Canada, Commitment, Programs
false
Human Resources and Talent Management
Government & Public Sector
Boxed
BCG
Add to my slides
Remove from favorites
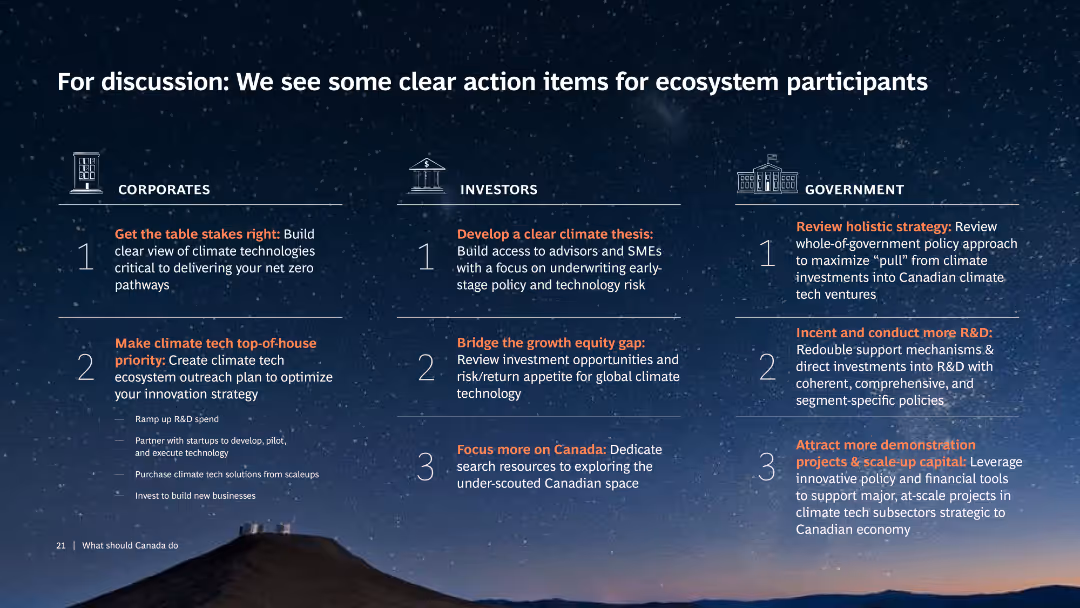
Three-column layout with headings: Corporates, Investors, Government. Each column lists action items with icons and text, over a starry night background.
Strategic Planning
Environmental Services & Sustainability
The slide outlines specific actions for corporates, investors, and government to support ecosystem participants in achieving climate goals.
Action items, Climate tech, Corporates, Investors, Government
false
Strategic Planning
Environmental Services & Sustainability
Pillar
BCG
Add to my slides
Remove from favorites
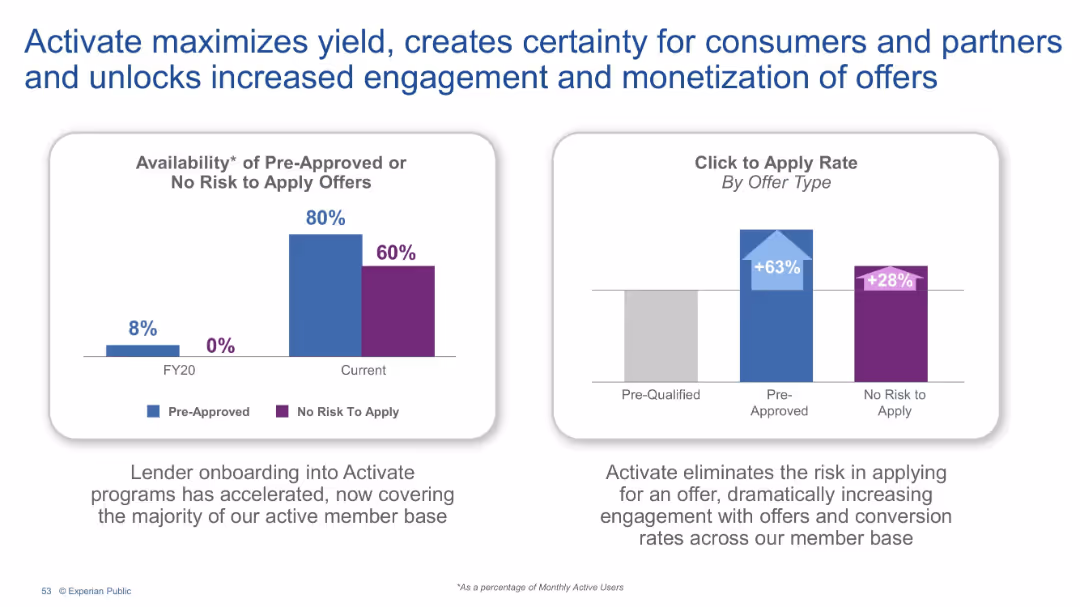
Two bar charts comparing FY20 to current data. Left: availability of pre-approved offers. Right: click-to-apply rates by offer type. Text explanation below.
Pricing Strategies
Financial Services
This slide showcases the impact of Activate, Experian's program that improves offer clarity and reduces application risks. With increased pre-approval availability and click-through rates, Activate drives stronger partner engagement and consumer conversion.
Activate, Pre-approved offers, Monetization, Consumer engagement, Click rate, Offer certainty
false
Pricing Strategies
Financial Services
Multiple Chart
Barclays
Add to my slides
Remove from favorites
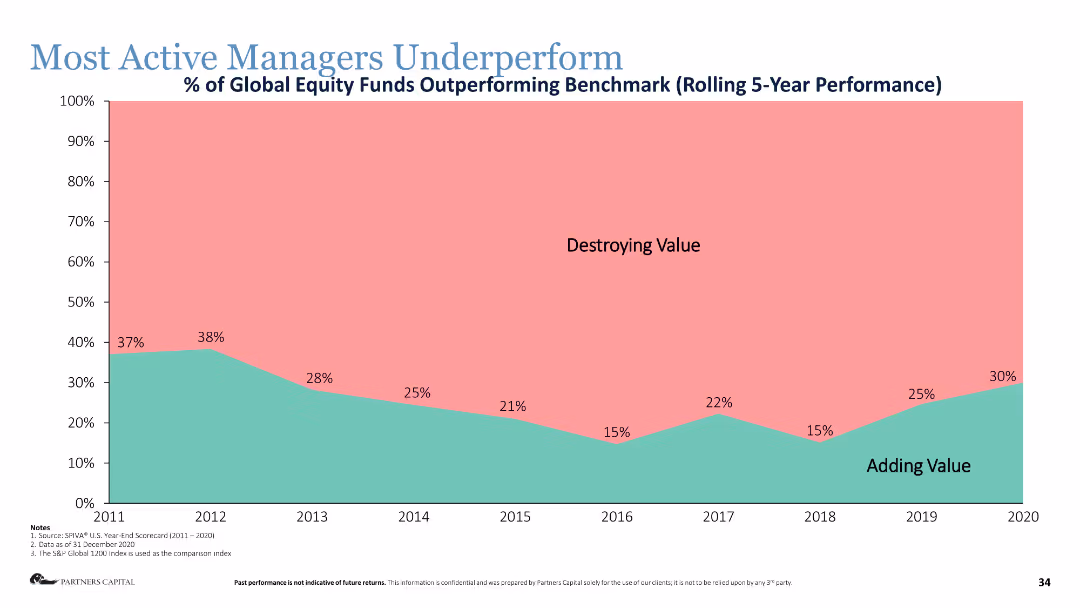
Area chart showing the percentage of global equity funds outperforming the benchmark over a rolling 5-year period.
Human Resources and Talent Management
Financial Services
The slide shows that most active managers underperform relative to benchmarks, highlighting the difficulty in adding value.
active managers, underperformance, equity funds, benchmark, performance metrics
false
Human Resources and Talent Management
Financial Services
Single Chart
Deloitte
Add to my slides
Remove from favorites
Features a table showing Australia’s market presence in manufacturing active materials and electrolytes with a detailed list of planned production activities.
Operational Efficiency
Industrial & Manufacturing
Evaluates Australia's current and upcoming activities in the production of active materials for batteries, including investments and market shares in global context.
active materials, electrolytes, manufacturing, Australia, market analysis
false
Operational Efficiency
Industrial & Manufacturing
Table
Accenture
Add to my slides
Remove from favorites
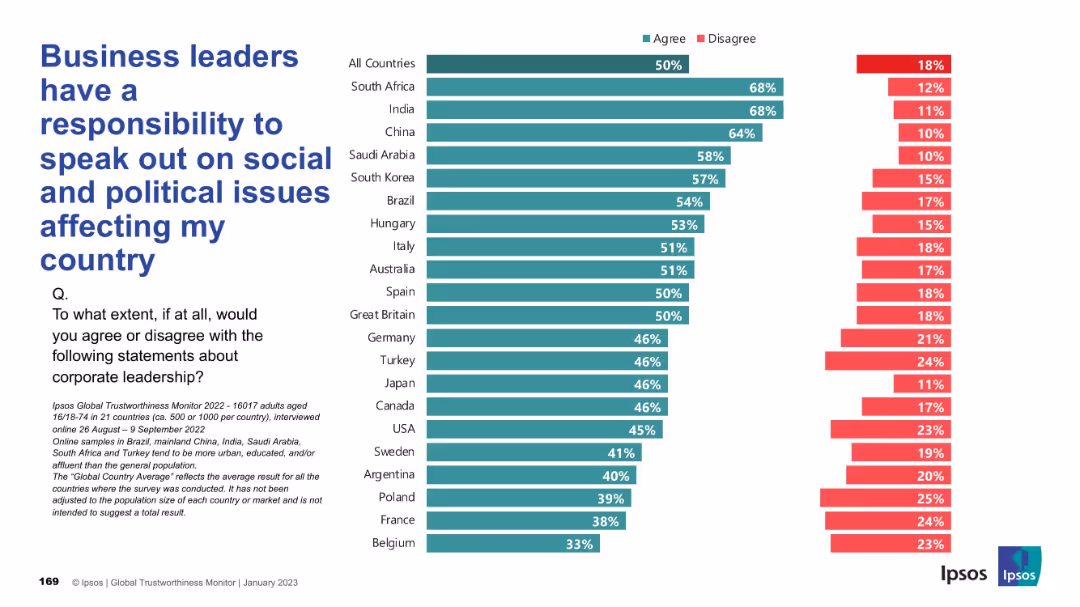
Layout follows the same bar chart format; responses shown per country; design includes clear labels, Ipsos branding, and legible typography.
Regulatory and Compliance
Professional Services
The chart shows varying global opinions on whether corporate leaders should engage in socio-political discourse. Strongest agreement comes from South Africa and India; Belgium and France are least supportive of such involvement.
activism, business role, social responsibility, politics, corporate speech, stakeholder engagement, Ipsos
false
Regulatory and Compliance
Professional Services
Mixed Chart
IPSOS
Add to my slides
Remove from favorites
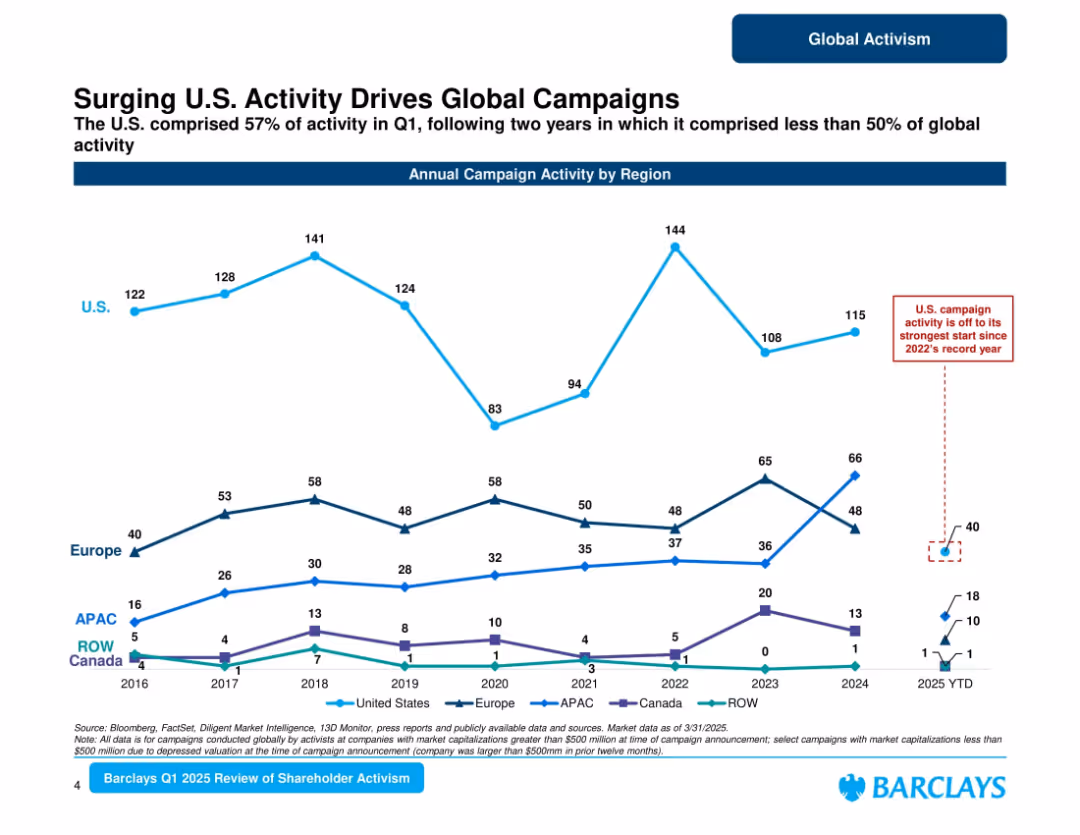
Line chart showing regional campaign trends (U.S., Europe, APAC, Canada, ROW); callouts highlight surges in U.S. activity.
Market Analysis and Trends
Financial Services
Tracks regional activist campaign activity from 2016 through Q1 2025. U.S. drives over 50% of activity in Q1 2025, rebounding strongly after lower share in previous years. Europe and APAC show moderate activity. Emphasizes growing U.S. influence.
activism by region, U.S. activism, campaign surge, Barclays, Q1 2025, regional trends
false
Market Analysis and Trends
Financial Services
Single Chart
Barclays
Add to my slides
Remove from favorites
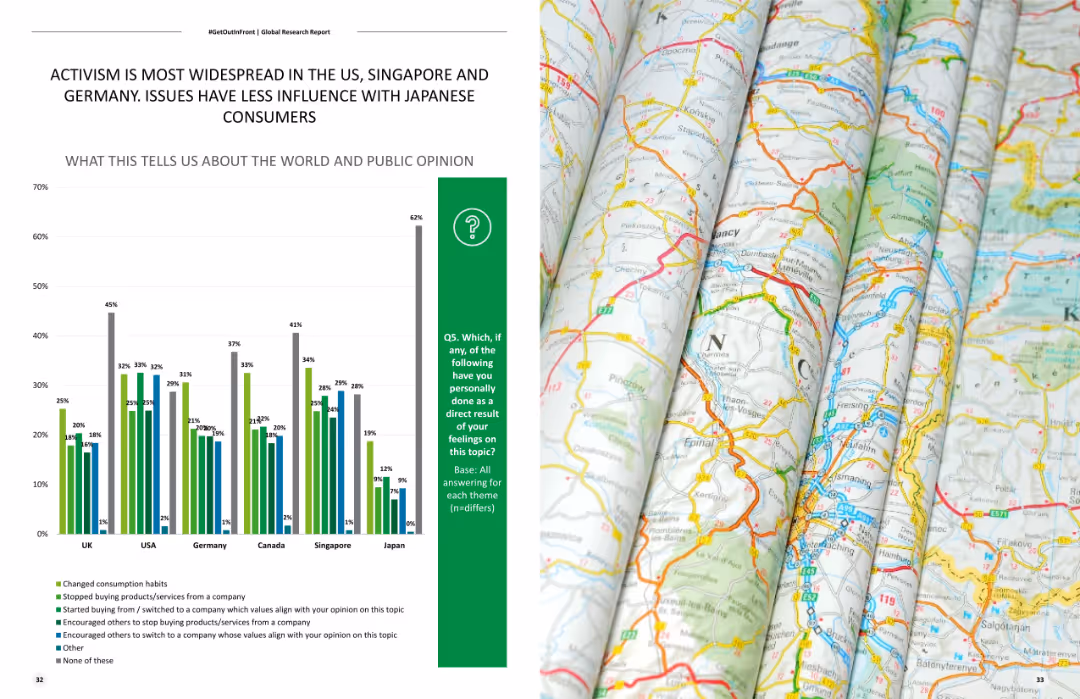
Shows a column chart comparing levels of activism across different countries, highlighting the differences in public engagement with various social issues.
Market Analysis and Trends
Government & Public Sector
Compares levels of activism across multiple countries, focusing on public engagement with social issues in the US, Singapore, Germany, and Japan.
Activism, country comparison, social issues, public engagement, market trends
false
Market Analysis and Trends
Government & Public Sector
Mixed Chart
Deloitte
Add to my slides
Remove from favorites
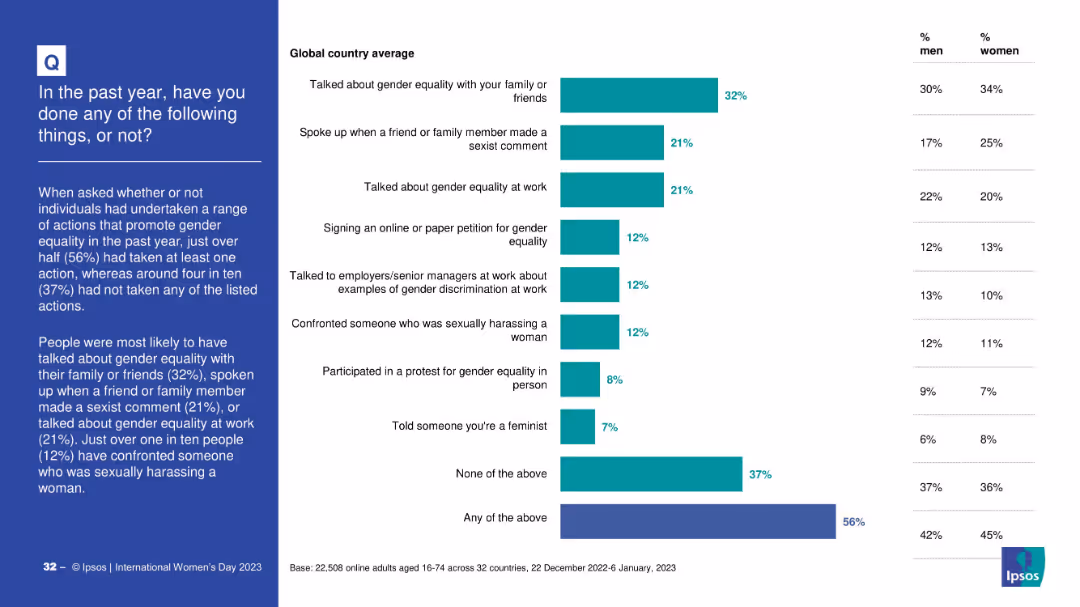
Bar chart listing actions taken to support gender equality, such as speaking up or confronting harassment. Includes gender-specific participation rates.
Strategic Planning
Government & Public Sector
This slide summarizes global participation in actions supporting gender equality. 56% took at least one action, with common actions including discussing equality with others and addressing sexist comments.
activism, gender rights, behavior analysis, participation, public engagement, awareness
false
Strategic Planning
Government & Public Sector
Mixed Chart
IPSOS
Add to my slides
Remove from favorites
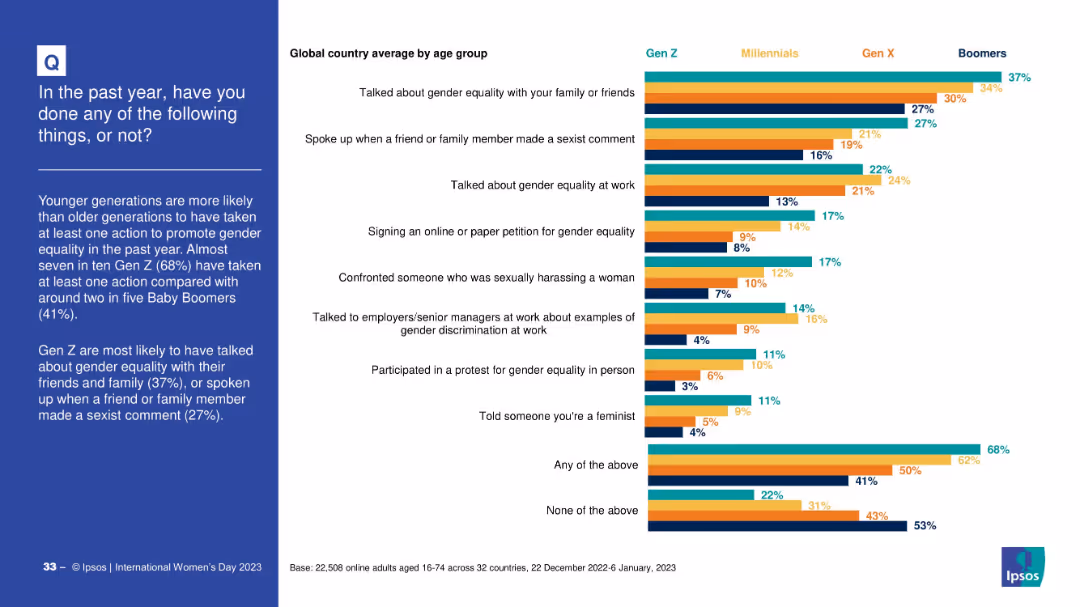
Stacked bar chart by generation showing participation in different actions. Categories include discussing gender equality, confronting harassment, or joining protests.
Strategic Planning
Government & Public Sector
This slide shows generational trends in actions supporting gender equality. Gen Z leads across most categories, especially in discussions and confronting sexism. Boomers report the lowest participation.
activism, generational divide, equality actions, civic behavior, public awareness
false
Strategic Planning
Government & Public Sector
Mixed Chart
IPSOS
Add to my slides
Remove from favorites
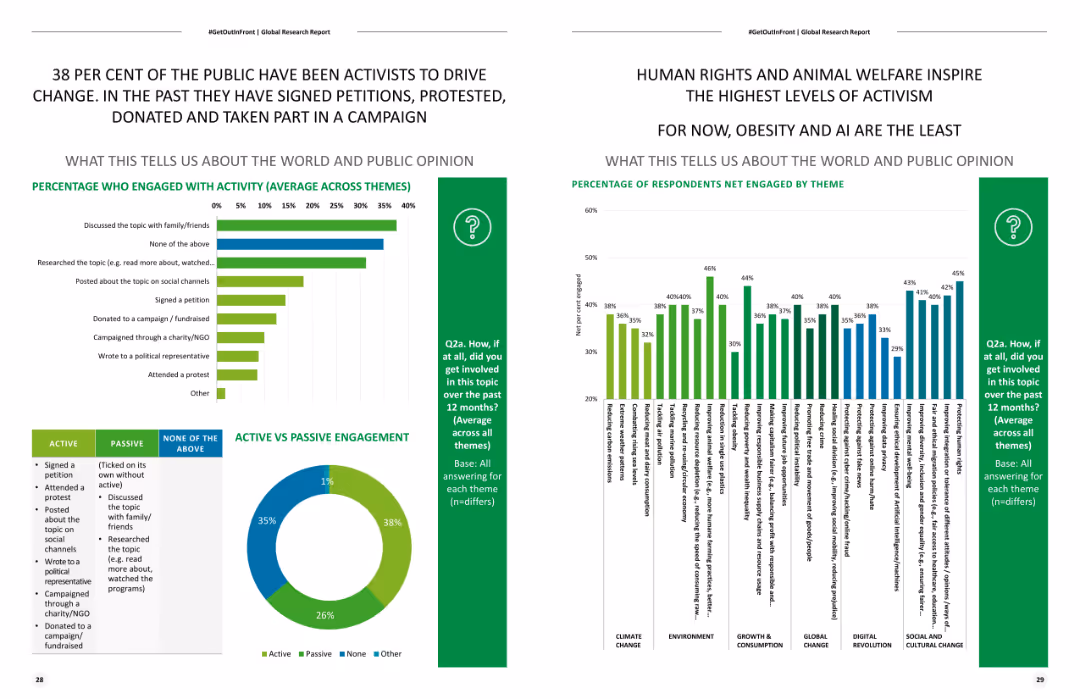
Contains a bar chart on public engagement activities and a pie chart on active vs. passive engagement.
Client Case Studies
Government & Public Sector
Details public engagement in activism, including activities like signing petitions and attending protests, highlighting the level of activism and public opinion.
Activism, public engagement, social change, bar chart, public opinion
false
Client Case Studies
Government & Public Sector
Multiple Chart
Deloitte
Add to my slides
Remove from favorites
The slide features two column charts. The first chart shows the relationship between activism and strategic reviews over time. The second chart presents the global M&A quarterly announced volumes for 2023.
Strategic Planning
Financial Services
The slide discusses the link between activist campaigns and strategic reviews, and how this affects M&A activity. It suggests that increased activism will drive strategic actions.
activism, strategic reviews, M&A, financial services, 2023 trends
false
Strategic Planning
Financial Services
Multiple Chart
JP Morgan
Add to my slides
Remove from favorites
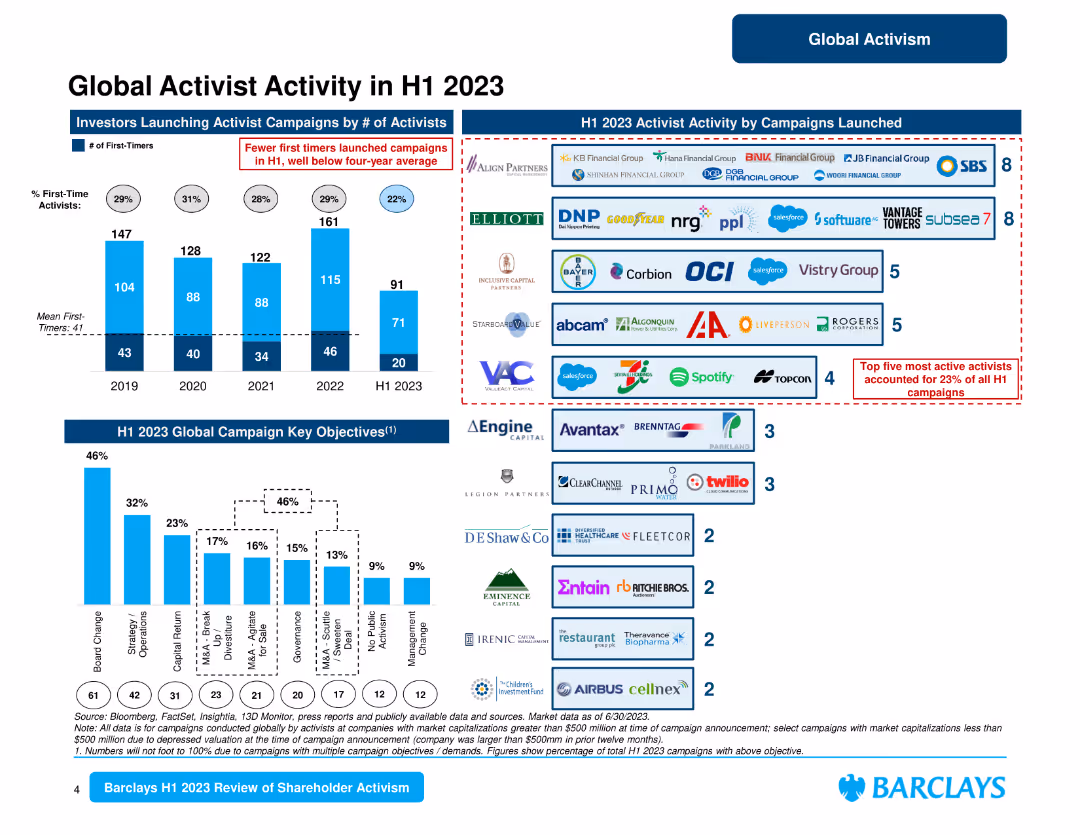
This slide contains several column charts and logos of companies involved in activist campaigns. It visually depicts the number of campaigns, key objectives, and prominent activists.
Competitive Landscape
Financial Services
Provides detailed insights into global activist activities in the first half of 2023, highlighting key objectives, campaign launches, and the most active activists.
activist activity, H1 2023, campaigns, key objectives, global
false
Competitive Landscape
Financial Services
Multiple Chart
Barclays
Add to my slides
Remove from favorites
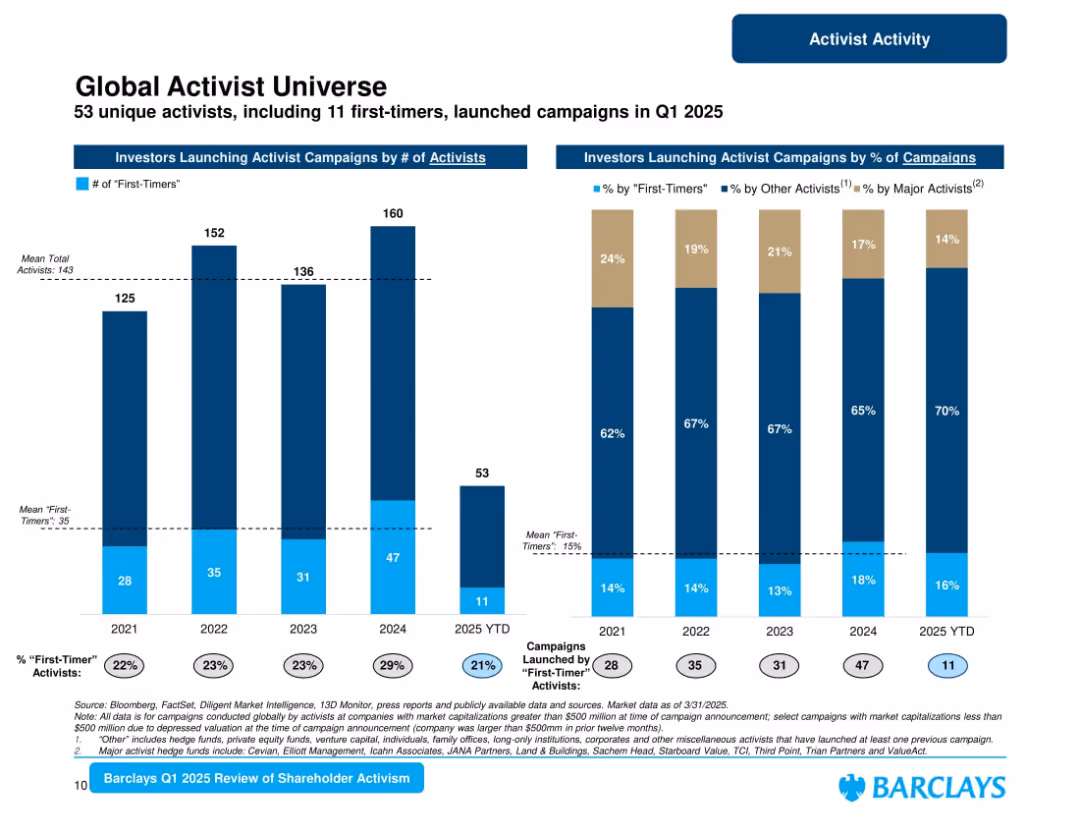
Two vertical charts: number of activists (incl. first-timers) and percentage of campaigns by type of activist.
Market Analysis and Trends
Financial Services
Highlights breadth of activist investors in Q1 2025, with 53 total and 11 first-time participants. Tracks campaign share by major, other, and new activists. Emphasizes growth in major activist influence and slight decline in first-timer share.
activist investors, first-timers, campaign origin, major activists, Barclays, Q1 2025
false
Market Analysis and Trends
Financial Services
Multiple Chart
Barclays
Add to my slides
Remove from favorites
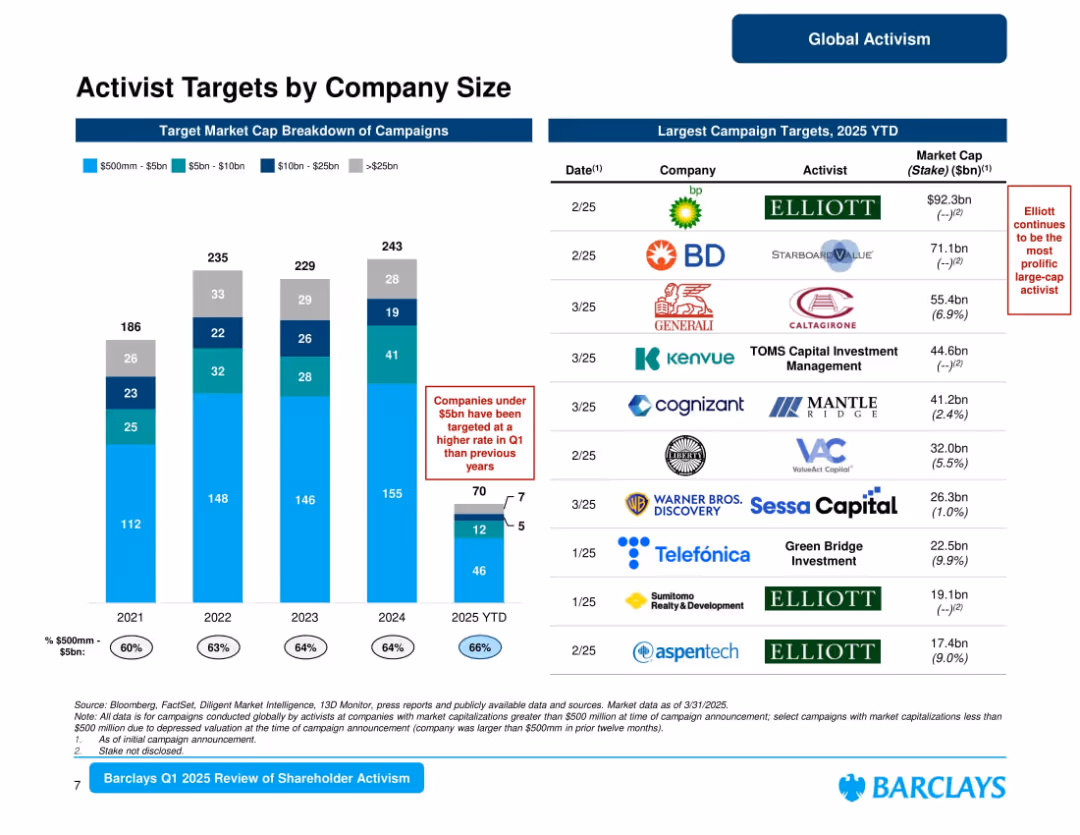
Left: stacked bar chart showing market cap breakdown (2019–2025); Right: list of largest YTD 2025 campaign targets.
Market Analysis and Trends
Financial Services
Analyzes activist campaign targets by market cap, showing increased focus on companies under $5bn in Q1 2025 (66%). Lists largest campaign targets including BP and BD. Elliott highlighted as a key repeat activist. Offers a view into activist targeting preferences.
activist targets, company size, market cap, Elliott, campaign trends, Barclays, Q1 2025
false
Market Analysis and Trends
Financial Services
Mixed Chart
Barclays
Add to my slides
Remove from favorites
Column chart showing the decline in certain activities such as calling/messaging family, engaging with news, and drinking alcohol from May to December 2020.
Market Analysis and Trends
Healthcare & Pharmaceuticals
Highlights the decline in specific activities during the COVID-19 pandemic, comparing data between May 2020 and December 2020.
activity decline, COVID-19, family messaging, news engagement, alcohol consumption
false
Market Analysis and Trends
Healthcare & Pharmaceuticals
Single Chart
IPSOS
Add to my slides
Remove from favorites
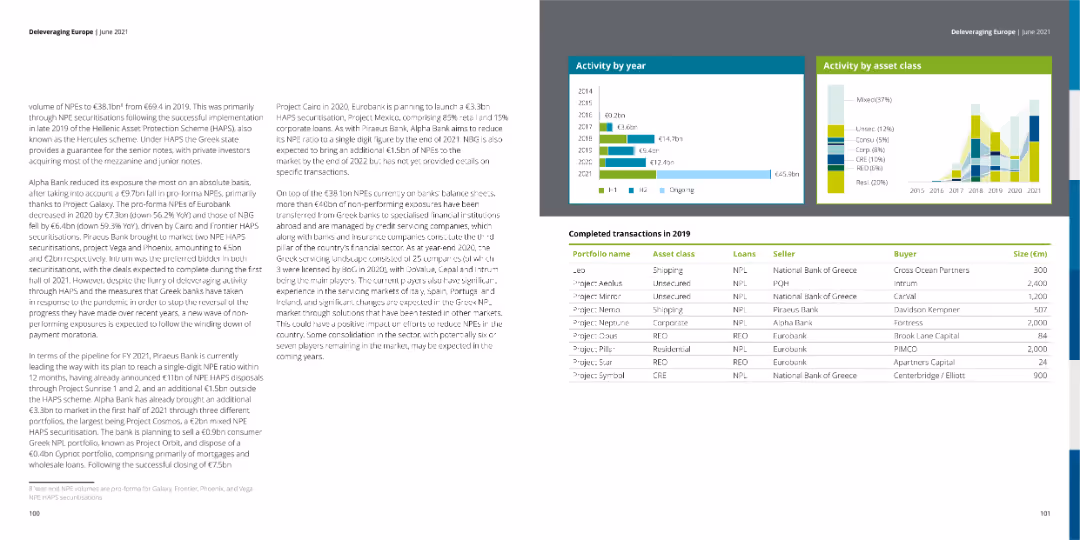
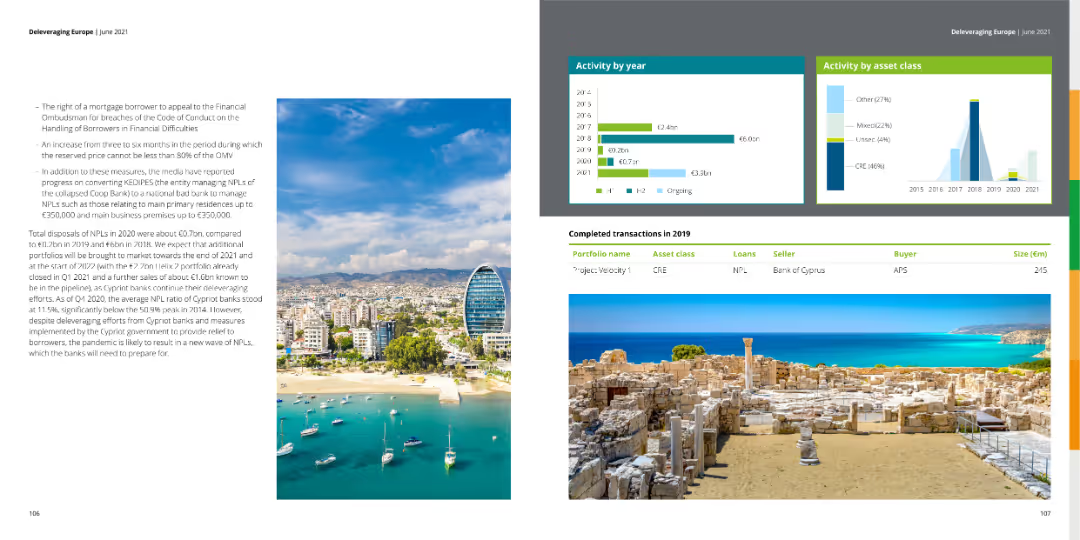
The slide displays tables of completed transactions for 2019, along with bar charts showing activity by year and asset class. The left side contains a dense text block summarizing NPL volumes and actions taken by banks.
Market Analysis and Trends
Financial Services
The slide summarizes the financial activities by year and asset class, including completed transactions in 2019, highlighting trends and strategic moves by various banks.
activity, transactions, asset class, trends, NPL
false
Market Analysis and Trends
Financial Services
Multiple Chart
Deloitte
Add to my slides
Remove from favorites
The slide presents tables of completed transactions for 2019, along with bar charts showing activity by year and asset class. The left side contains a dense text block discussing NPL volumes and bank actions.
Market Analysis and Trends
Financial Services
The slide offers a detailed overview of financial activities by year and asset class, including completed transactions in 2019, with insights into trends and strategic bank actions.
activity, transactions, asset class, trends, NPL
false
Market Analysis and Trends
Financial Services
Multiple Chart
Deloitte
Add to my slides
Remove from favorites
This slide includes a column chart comparing the expected changes in the proportion of acute beds over the next five years by country and hospital type.
Strategic Planning
Healthcare & Pharmaceuticals
This slide predicts an increase in the demand for acute beds in hospitals over the next five years, with detailed analysis by country and hospital type.
acute beds, demand surge, hospital planning, future trends, regional analysis
false
Strategic Planning
Healthcare & Pharmaceuticals
Multiple Chart
LEK
Add to my slides
Remove from favorites
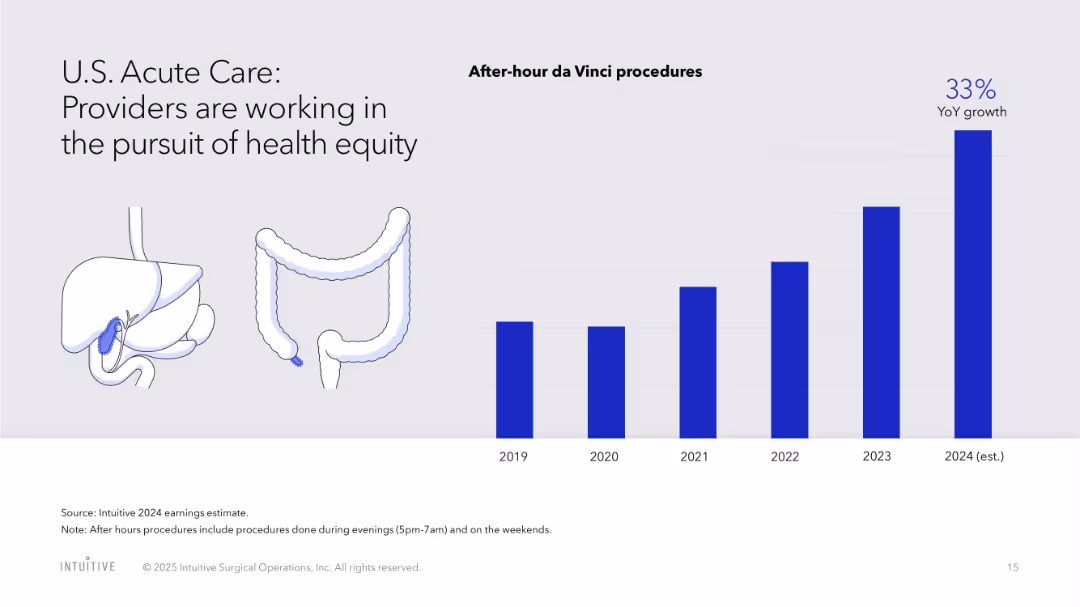
Bar chart for after-hour procedures and illustrative visuals of human anatomy
Human Resources and Talent Management
Healthcare & Pharmaceuticals
Emphasizes the expansion of after-hour da Vinci procedures to enhance healthcare equity, alongside visuals of organs typically treated.
acute care, health equity, after-hours surgery, access, da Vinci, growth, healthcare disparity
false
Human Resources and Talent Management
Healthcare & Pharmaceuticals
Single Chart
JP Morgan
Add to my slides
Remove from favorites
A visual comparative layout with five segments, each with an icon, color-coded and containing bullet points, with arrows pointing towards the center.
Risk Assessment and Management
Financial Services
Highlights the need for adaptability in finance, considering competition, regulatory, cyber, tech, and ESG factors for strategic and risk planning.
adaptability, finance, competition, regulatory, cyber, technology, ESG, strategic planning
false
Risk Assessment and Management
Financial Services
Pillar
JP Morgan
Add to my slides
Remove from favorites
A graphic scale compares traits of a 'Stable Organisation' and an 'Adaptable Organisation' with colored circles denoting each trait's presence in an organization. There are icons representing different organizational qualities.
Strategic Planning
Professional Services
Compares behavioral traits between stable and adaptable organizations to prompt discussions on strategic planning and organizational adaptability within professional services.
adaptability, stable, organisation, strategic, planning, traits
false
Strategic Planning
Professional Services
Single Chart
Deloitte
Add to my slides
Remove from favorites
The slide contains textual content and three distinct sections labeled 'X-Ray', 'MRI', and 'Brainscan', each with a unique graphic: a chart, a circular diagram, and a network graph. Colors are used for differentiation and emphasis.
Technology and Digital Transformation
Professional Services
Explores the use of various analytical tools to assess organizational health, which can be applied in healthcare or technology sectors for discussions on adaptability and organizational diagnostics.
adaptable, health, analysis, organizational, X-Ray, MRI, Brainscan
false
Technology and Digital Transformation
Professional Services
Pillar
Deloitte
Add to my slides
Remove from favorites
The slide is divided into textual content and infographic elements with percentage figures and pictograms related to agility and talent. Green and grey color highlights are used for emphasis.
Organizational Structure and Change
Professional Services
Discusses the Adaptable Organization (AO) as a shift in management philosophy to increase agility through empowered networks of teams. It points out the current state of digital disruption, organizational agility, leadership, and the need for new talent within professional services.
Adaptable Organization, management, agility, talent, disruption, teams
false
Organizational Structure and Change
Professional Services
Linear Flow
Deloitte
Add to my slides
Remove from favorites
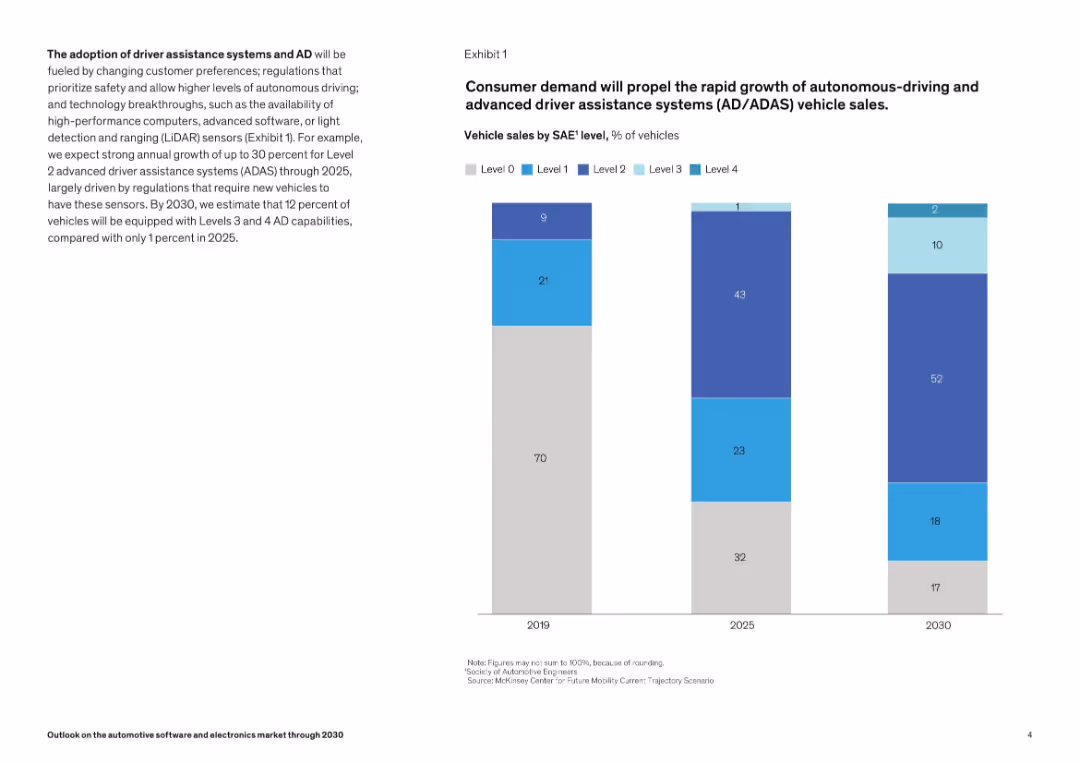
Vertical stacked bar chart showing share of vehicle types (Level 0–4) in 2019, 2025, 2030. Light blue theme with simple design.
Market Analysis and Trends
Industrial & Manufacturing
Forecasting growth in autonomous vehicles, the slide shows an increase in advanced driver assistance systems (Level 2+) through 2030. It ties consumer demand and regulatory shifts to the rise of higher-level AD systems.
ADAS, autonomous vehicles, SAE levels, market forecast, growth, vehicle sales, regulations, driver assistance
false
Market Analysis and Trends
Industrial & Manufacturing
Mixed Chart
McKinsey
Add to my slides
Remove from favorites
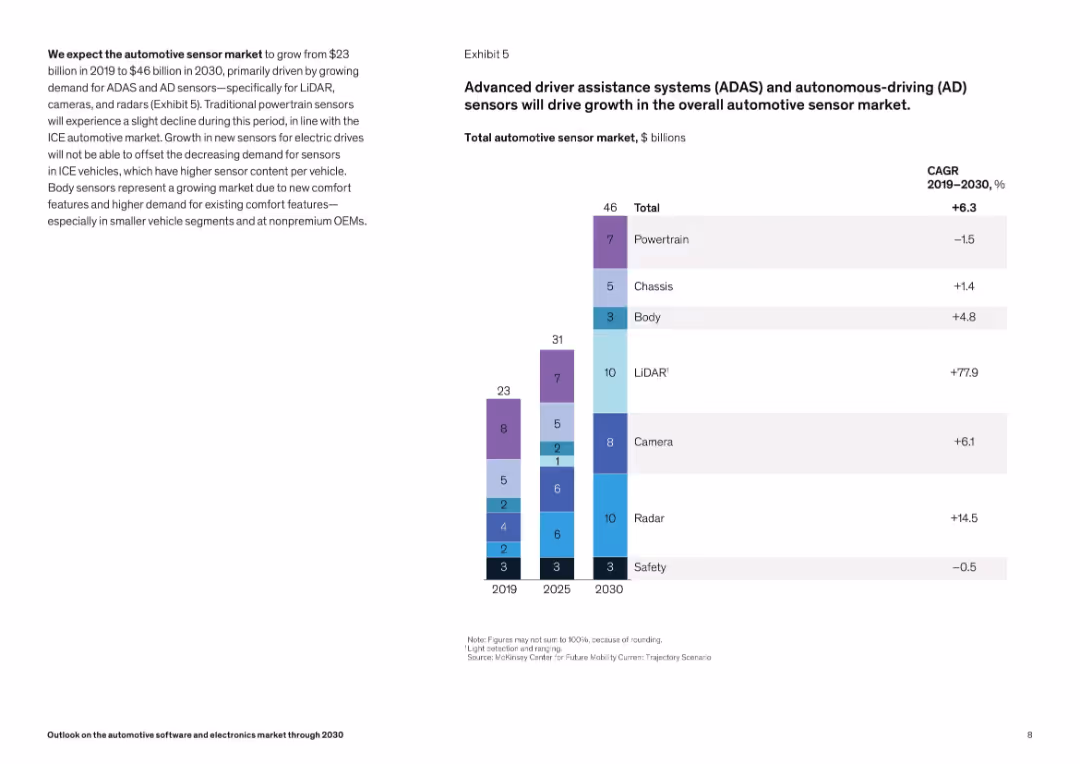
Two-column layout; left side includes market projections and commentary, right side shows a vertical bar chart with CAGR rates and sensor-type market sizes for 2019, 2025, and 2030.
Market Analysis and Trends
Industrial & Manufacturing
The automotive sensor market is expected to grow from $23B in 2019 to $46B in 2030. Key drivers include ADAS and AD systems, with notable growth in LiDAR and radar sensors. The slide includes a CAGR breakdown, indicating a decline in powertrain sensors and strong growth in AD-focused components.
ADAS, LiDAR, radar, sensor market, automotive electronics, CAGR, 2030 forecast, body sensors, ICE vehicles, electric drives
false
Market Analysis and Trends
Industrial & Manufacturing
Mixed Chart
McKinsey
Add to my slides
Remove from favorites
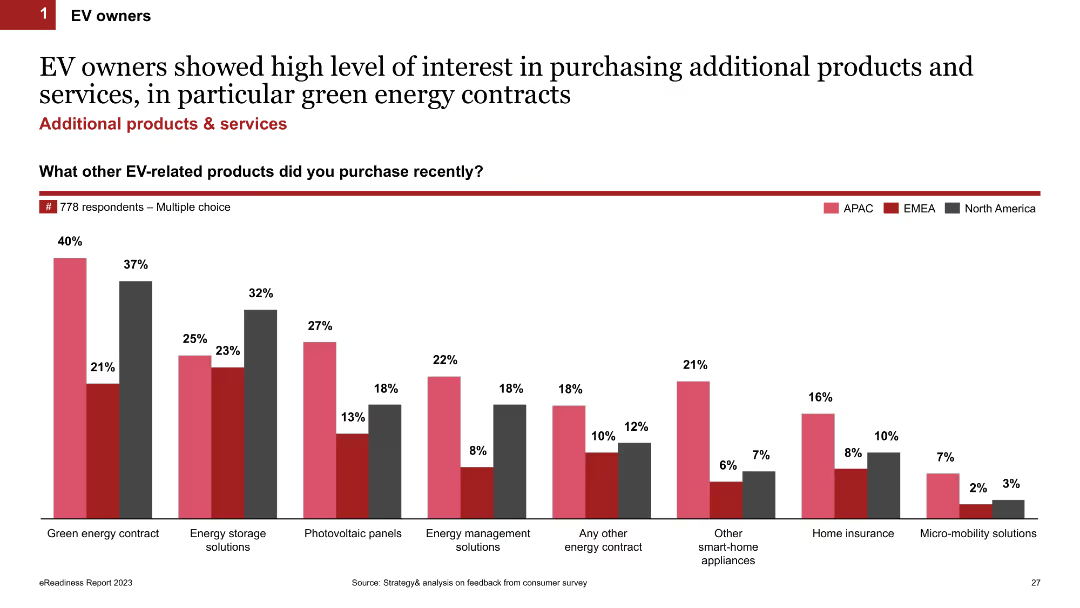
Column chart showing the percentages of EV owners interested in additional products and services like green energy contracts, energy storage solutions, and photovoltaic panels. The chart is color-coded by region (APAC, EMEA, North America).
Product and Service Analysis
Transportation & Logistics
This slide presents data on the interest of EV owners in purchasing additional products and services, with a focus on green energy contracts, energy storage, and other energy-related solutions, segmented by region.
additional products, EV owners, green energy contracts, regional interest, photovoltaic panels
false
Product and Service Analysis
Transportation & Logistics
Single Chart
PwC/Strategy&
Add to my slides
Remove from favorites
Bar chart listing additional services consumers plan to acquire with their next vehicle, including insurance and roadside assistance. Simple and clean presentation.
Product and Service Analysis
Transportation & Logistics
This slide outlines the most common additional services that vehicle consumers intend to purchase or subscribe to, highlighting the high demand for vehicle insurance and roadside assistance.
Additional services, consumer planning, vehicle insurance, roadside assistance
false
Product and Service Analysis
Transportation & Logistics
Single Chart
Deloitte
Add to my slides
Remove from favorites
The slide uses funnel diagrams to represent market size and opportunities across banking sectors, complemented by ROE accretion information. The visual elements are clear and informative, using contrasting colors for different sectors.
Market Analysis and Trends
Financial Services
This slide assesses potential market opportunities and the expected return on equity (ROE) in various financial sectors. It implies a focus on understanding market size and shares to drive strategic growth and profitability within transaction banking, wealth management, and consumer sectors.
Addressable market, Market size, ROE, Financial sectors, Profitability
false
Market Analysis and Trends
Financial Services
Table
Goldman Sachs
Add to my slides
Remove from favorites
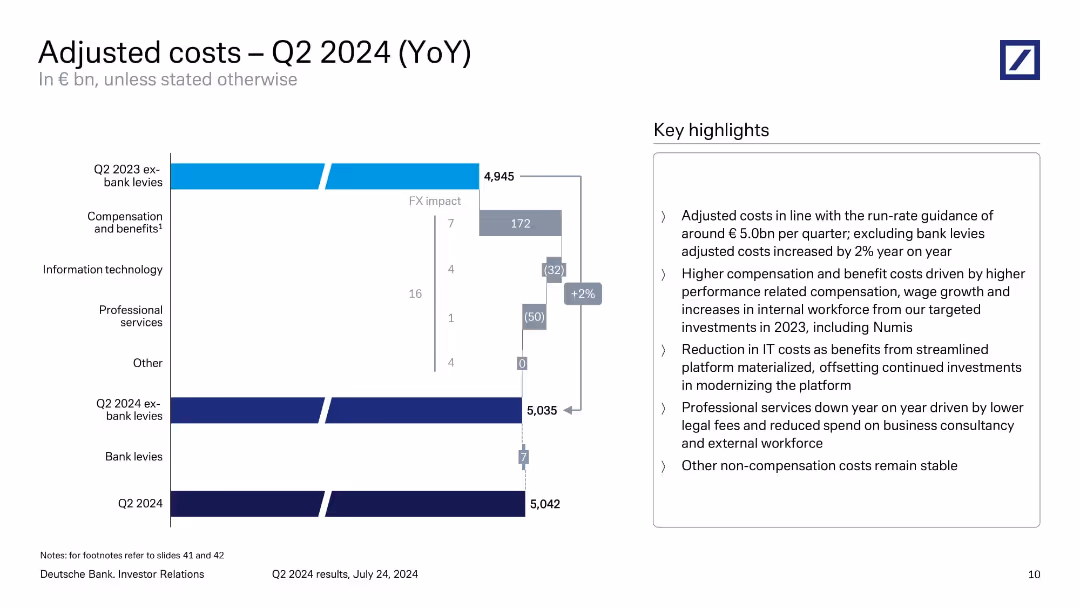
Waterfall chart showing changes in cost components YoY with a right-hand key highlights box.
Operational Efficiency
Financial Services
Illustrates cost drivers from Q2 2023 to Q2 2024, highlighting increased compensation, reduced IT and professional services costs, and FX impacts. The slide explains cost containment in line with quarterly guidance and strategic workforce investments.
adjusted costs, compensation, IT savings, professional services, Q2 2024, Deutsche Bank
false
Operational Efficiency
Financial Services
Mixed Chart
Deutsche Bank
Add to my slides
Remove from favorites
Waterfall chart tracking cost changes year over year with labeled segments.
Financial Performance
Financial Services
Explains year-over-year cost evolution for Q1 2025. Despite FX impacts, adjusted costs rose modestly by €29m, with compensation and benefits contributing most to the increase. Other components like IT and professional services showed decreases. The slide highlights Deutsche Bank’s continued cost discipline aligned with expectations and strategic objectives.
adjusted costs, Deutsche Bank, Q1 2025, FX impact, compensation, cost control, financial results, waterfall chart, performance metrics
false
Financial Performance
Financial Services
Mixed Chart
Deutsche Bank
Add to my slides
Remove from favorites
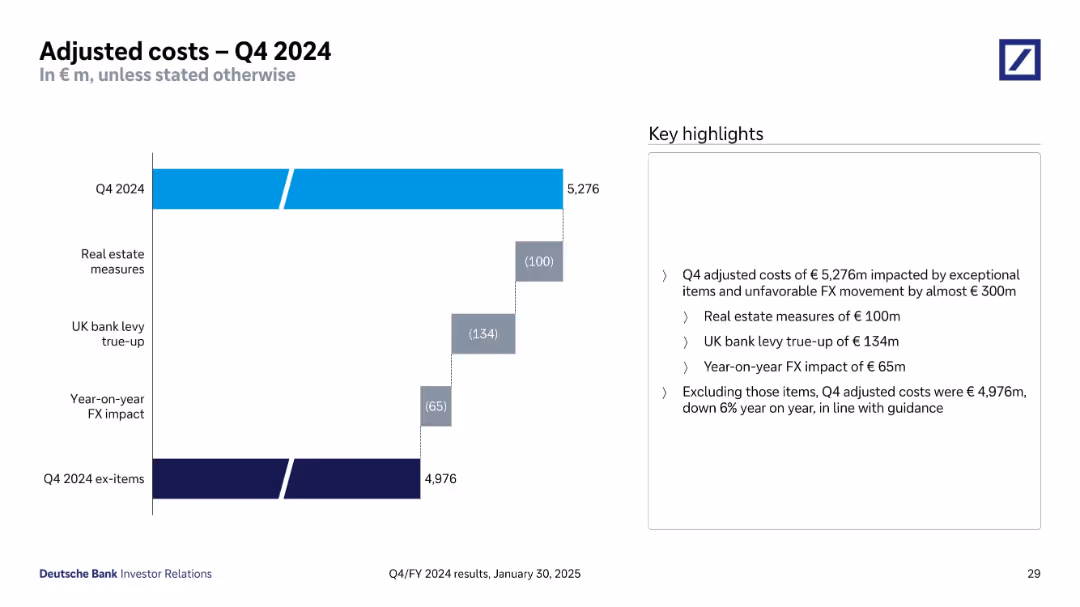
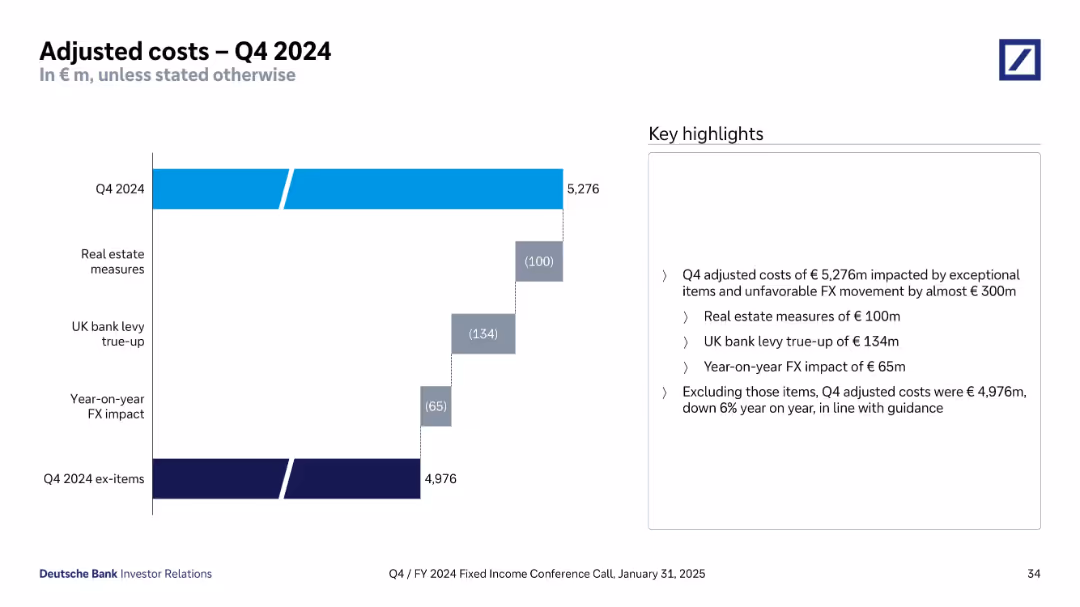
Waterfall chart showing Q4 2024 costs and exceptional item impacts; highlight bullets to the right
Operational Efficiency
Financial Services
This slide presents Q4 2024 adjusted costs of €5,276m, including exceptional items and FX impact totaling nearly €300m. A breakdown shows the impact of real estate measures, UK bank levy, and FX changes. Excluding these items, adjusted costs are €4,976m, down 6% YoY.
Adjusted Costs, Exceptional Items, FX Impact, Cost Reduction, Efficiency
false
Operational Efficiency
Financial Services
Mixed Chart
Deutsche Bank
Add to my slides
Remove from favorites
Slide includes a detailed bar chart and breakdown of costs in a layered structure, using shades of blue to differentiate elements. It combines graphical data presentation with textual highlights to emphasize key points.
Operational Efficiency
Financial Services
Provides a detailed breakdown of Deutsche Bank's adjusted costs for Q2 2023, highlighting changes from the previous year and factors influencing cost trends, such as investments and efficiency initiatives.
adjusted costs, financial analysis, cost trends, Q2 2023
false
Operational Efficiency
Financial Services
Mixed Chart
Deutsche Bank
Add to my slides
Remove from favorites
Horizontal waterfall bar chart showing breakdown from gross adjusted costs (€5,276m) to ex-items total (€4,976m); explanation panel at right.
Financial Performance
Financial Services
Dissects Q4 2024 adjusted costs and reconciles exceptional items like FX impacts, UK bank levy, and real estate measures. Ex-item total shows a 6% YoY reduction, aligning with prior guidance.
adjusted costs, FX, UK levy, real estate, Q4 2024, expenses, guidance
false
Financial Performance
Financial Services
Mixed Chart
Deutsche Bank
Add to my slides
Remove from favorites
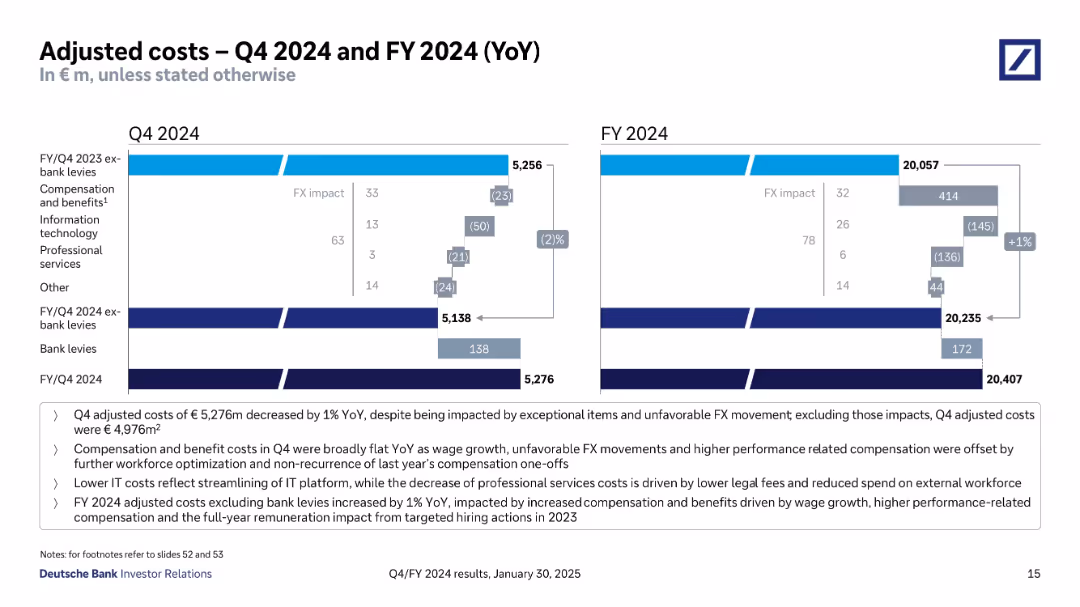
Two waterfall charts (Q4 and FY) compare costs YoY, with color-coded impact bars. Key highlights are bullet-listed below.
Operational Efficiency
Financial Services
Analyzes cost movements in Q4 and FY 2024, highlighting effects of FX, IT cost savings, and compensation changes. Distinguishes between total adjusted costs and bank levies. Shows slight YoY cost increase due to targeted hiring and wage growth.
adjusted costs, IT savings, compensation, FX impact, bank levies
false
Operational Efficiency
Financial Services
Mixed Chart
Deutsche Bank
Add to my slides
Remove from favorites
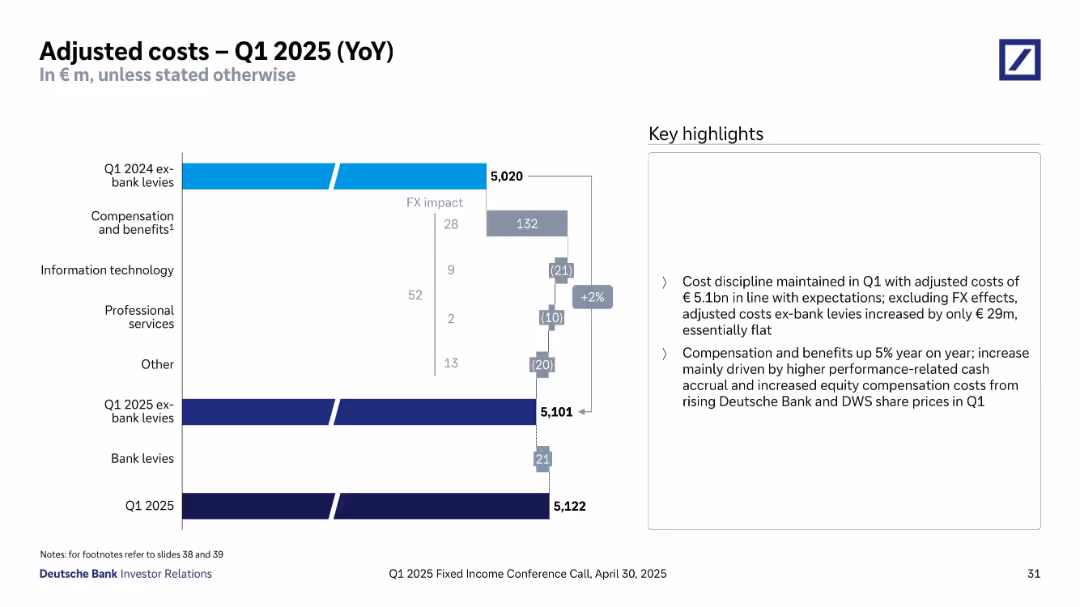
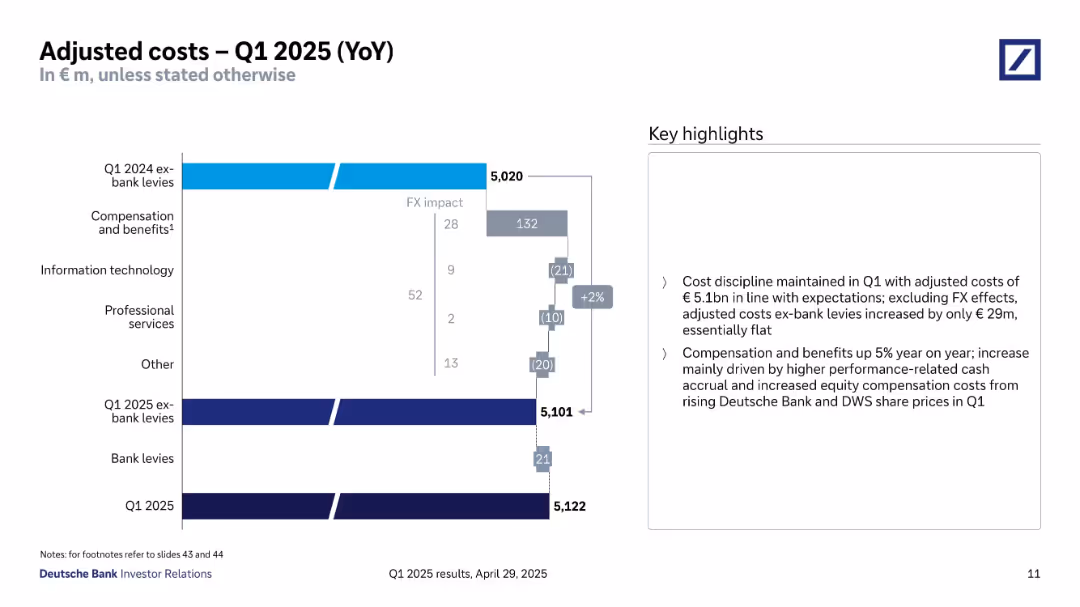
Waterfall chart showing breakdown of changes from Q1 2024 to Q1 2025 with annotations; summary highlights in a side box
Operational Efficiency
Financial Services
A waterfall analysis of cost changes from Q1 2024 to Q1 2025. The chart shows a modest increase in adjusted costs mainly due to compensation, while bank levies and other costs remain stable.
adjusted costs, Q1 2025, cost discipline, Deutsche Bank, compensation, waterfall
false
Operational Efficiency
Financial Services
Mixed Chart
Deutsche Bank
Add to my slides
Remove from favorites
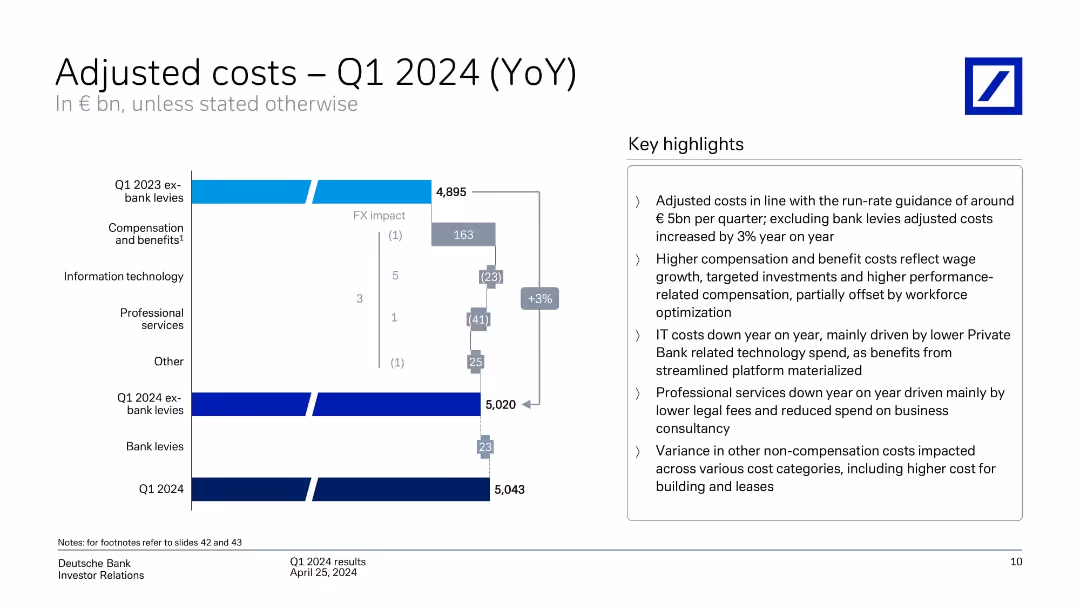
A column chart breaking down adjusted costs year-over-year with key highlights on the right. The slide is moderately dense with a mix of graphical and textual elements.
Operational Efficiency
Financial Services
This slide breaks down the adjusted costs for Q1 2024, comparing them year-over-year and providing insights into cost drivers such as compensation, IT, and professional services.
Adjusted costs, year-over-year, cost drivers, compensation, IT
false
Operational Efficiency
Financial Services
Mixed Chart
Deutsche Bank
Add to my slides
Remove from favorites
Waterfall chart comparing YoY cost components with annotations and summary text. Highlights major cost drivers and FX effects.
Performance Metrics and KPIs
Financial Services
Breaks down cost evolution from Q1 2023 to Q1 2024. Despite 3% YoY increase in adjusted costs (excluding bank levies), overall expenses remain aligned with guidance. Identifies compensation, IT, and professional service trends impacting cost structure.
adjusted costs, YoY, compensation, IT, cost drivers, bank levies
false
Performance Metrics and KPIs
Financial Services
Mixed Chart
Deutsche Bank
Add to my slides
Remove from favorites
Column chart show CCB adjusted expense over time with annotations for structural changes, investments, and outlook. A sidebar provides details on cumulative changes and factors influencing adjustments.
Investment Analysis
Financial Services
This slide details JP Morgan Chase & Co.'s adjusted expenses in the context of investments and structural changes, offering insights into financial planning and strategic investment decisions. It is likely intended for financial analysts and investors.
adjusted expenses, investment planning, JP Morgan Chase, financial analysis, strategic decisions
false
Investment Analysis
Financial Services
Single Chart
JP Morgan
Add to my slides
Remove from favorites
The slide displays a table and a bar chart showing adjusted net revenues, operating expenses, and pre-tax income/loss for Credit Suisse divisions for 2Q23, with percentage changes quarter-on-quarter.
Financial Performance
Financial Services
The slide provides an overview of Credit Suisse's adjusted financial results for the second quarter of 2023, highlighting revenue, expenses, and pre-tax income/loss for different divisions, indicating financial health and performance.
adjusted results, Credit Suisse, 2Q23, net revenues, operating expenses
false
Financial Performance
Financial Services
Mixed Chart
UBS
Add to my slides
Remove from favorites
The slide includes a table and bar charts showing different levers in administration and overhead with corresponding activity levels and trends.
Operational Efficiency
Professional Services
Discusses the lesser relevance of administration and overhead levers, focusing on corporate structures, back-office services, and staffing costs.
Administration, Overhead, Corporate Structures, Trends
false
Operational Efficiency
Professional Services
Single Chart
Roland Berger
Add to my slides
Remove from favorites
Features a map and a detailed flowchart illustrating the hierarchical structure of Indonesia's central, provincial, and local governments including budget allocations.
Strategic Planning
Government & Public Sector
Explains the decentralized administrative system in Indonesia, emphasizing the challenges this poses to coordinated efforts and project funding, especially in education and technology.
administrative structure, decentralization, Indonesia, government, project management, funding
false
Strategic Planning
Government & Public Sector
Diagram
BCG
Add to my slides
Remove from favorites
Next
You don't have any favorites yet.
Please wait loading your favorites slides...
Create a FREE account to continue browsing
Receive Instant Access to 1,000+ slides from companies like McKinsey, Google, and Goldman Sachs
First Name
Last Name
Email
Password
I agree to all
Terms & Privacy Policy
Thank you! Your submission has been received!
Oops! Something went wrong while submitting the form.
Have an account?
Sign in
Upgrade to PRO to Save slides
Advanced Search and Filters
Access to 15,000+ slides
Access to Category Pages
Save/Bookmark Slides
PowerPoint Template Library
Pick a Plan
MONTHLY
$12/month
Billed every month, Cancel anytime.
YEARLY
$9/year
Billed $108 annually, Cancel anytime.
Checkout for $12/month
Checkout for $108/yr
Secured by Stripe | AES-256 bit encryption