My Account
My Slides
Leave Feedback
Login
Logout
Get Started
Browse all Slides
Browse Slides Pro
Create a FREE Account
Instant access to 1,000+ real slides from top companies like McKinsey, BCG, Goldman Sachs, Google and many more!
First Name
Last Name
Email
Password
I agree to all
Terms & Privacy Policy
Thank you! Your submission has been received!
Oops! Something went wrong while submitting the form.
Have an account?
Sign in
Saved Slides
Total No. of slides saved
0
↻ Refresh
✖ Clear all
Features a column chart displaying the CO2 emission contributions from various materials in the nickel-based battery supply chain, emphasizing upstream processes.
Operational Efficiency
Energy & Utilities
Highlights the major contributions to CO2 emissions in battery production, particularly from mining and refining processes, suggesting Australia's competitive position in reducing emissions.
CO2 emissions, nickel, battery production, mining, refining, Australia, sustainability, supply chain, environmental impact
false
Operational Efficiency
Energy & Utilities
Mixed Chart
Accenture
Add to my slides
Remove from favorites
Column chart showing CO2 emission differences by economic sector under baseline and LCE scenarios.
Market Analysis and Trends
Environmental Services & Sustainability
Compares CO2 emissions under different scenarios, highlighting the impact of LCE and LCE+ policies on emission reductions.
CO2 emissions, scenarios, comparison, LCE, LCE+
false
Market Analysis and Trends
Environmental Services & Sustainability
Mixed Chart
EY
Add to my slides
Remove from favorites
The slide presents a column chart showing annual regional CO2 emissions from power generation and industries, compared to the corresponding storage capacity in years. It includes bars representing different regions worldwide.
Market Analysis and Trends
Environmental Services & Sustainability
The slide details the relationship between CO2 emissions and geological storage capacities in different regions, highlighting the storage capacity as not being a constraint in mature areas like North America.
CO2 emissions, storage capacity, regional analysis, global, power generation
false
Market Analysis and Trends
Environmental Services & Sustainability
Mixed Chart
Kearney
Add to my slides
Remove from favorites
Contains a graph showing historical and projected CO2 levels over 20,000 years, highlighting significant increases during the Anthropocene and projections under different RCP scenarios.
Regulatory and Compliance
Environmental Services & Sustainability
Discusses the projected trajectory of CO2 levels and their potential stabilization or increase over the next 30 years and their implications on climate for the next 10,000 years. Aimed at showcasing long-term impacts of current environmental policies.
CO2 levels, Climate change, Projections, RCP scenarios, Long-term impact
false
Regulatory and Compliance
Environmental Services & Sustainability
Single Chart
BCG
Add to my slides
Remove from favorites
A line chart showing historical CO2 concentrations, highlighting significant increases over millennia and recent years.
Regulatory and Compliance
Environmental Services & Sustainability
Offers historical context for current CO2 levels, underscoring the urgency in addressing climate change for policy makers and environmental planners.
CO2 levels, climate change, environmental policy, historical data, sustainability
false
Regulatory and Compliance
Environmental Services & Sustainability
Single Chart
BCG
Add to my slides
Remove from favorites
The slide features a flow diagram illustrating multiple chemical pathways from CO2, showcasing the conversion of CO2 into various chemical products like hydrocarbons, methanol, formic acid, and more.
Technology and Digital Transformation
Energy & Utilities
The slide presents opportunities for the chemical industry to utilize CO2 through various pathways, highlighting the potential to reduce fossil fuel dependence and valorize emitted CO2.
CO2 pathways, chemical conversion, industry opportunities, fossil fuel reduction
false
Technology and Digital Transformation
Energy & Utilities
Diagram
Kearney
Add to my slides
Remove from favorites
The slide features a column chart displaying the average CO2 price per ton (€) from 2012 to 2023. On the right, there are two bar charts comparing CCGT marginal price variation in low vs. high prices. The color scheme is green and dark grey, with green bars and texts. The layout is dense with data, providing a clear visual representation of the ETS and CCGT prices' impact.
Market Analysis and Trends
Energy & Utilities
This slide shows the increase in ETS price over the years and its significant impact on market dynamics, focusing on CO2 prices and CCGT marginal price variations. It highlights the substantial rise in CO2 price and how it affects the contribution mix and marginal prices, providing a detailed analysis of the economic implications.
CO2 price, ETS, market dynamics, CCGT price, impact
false
Market Analysis and Trends
Energy & Utilities
Multiple Chart
EY
Add to my slides
Remove from favorites
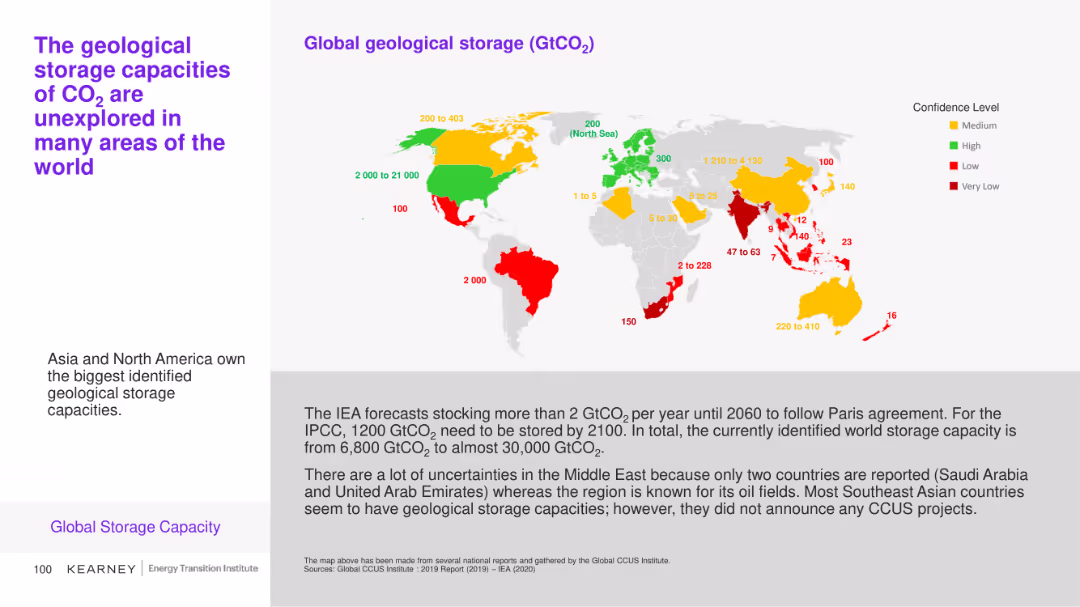
This slide includes a map and a bar chart illustrating the global geological storage capacities of CO2 with varying confidence levels across different regions. Color coding (green, yellow, red) indicates confidence levels.
Market Analysis and Trends
Environmental Services & Sustainability
The slide explores the identified geological storage capacities for CO2 globally, emphasizing areas with the highest potential and the uncertainties in certain regions like the Middle East.
CO2 storage, geological capacity, global map, confidence levels
false
Market Analysis and Trends
Environmental Services & Sustainability
Graphic
Kearney
Add to my slides
Remove from favorites
The slide includes a line chart comparing geological storage costs for CO2 in onshore and offshore sites.
Financial Performance
Energy & Utilities
This slide compares the costs of geological storage for CO2 in depleted oil and gas fields and saline aquifers.
CO2 storage, geological, costs, onshore, offshore
false
Financial Performance
Energy & Utilities
Mixed Chart
Kearney
Add to my slides
Remove from favorites
The slide includes a line chart comparing cost estimates for long-distance CO2 transport using various methods.
Financial Performance
Energy & Utilities
This slide presents cost estimates for transporting CO2 over long distances by ship, offshore pipeline, and onshore pipeline.
CO2 transport, costs, long-distance, pipeline, ship
false
Financial Performance
Energy & Utilities
Single Chart
Kearney
Add to my slides
Remove from favorites
The slide includes an infographic showing how CO2 is used as a raw material for plastics. It illustrates the process of converting CO2 into polyols and other plastic components with various end-use applications.
Technology and Digital Transformation
Energy & Utilities
The slide highlights the innovative technology developed by Covestro to use CO2 as a raw material for manufacturing plastics, showcasing its potential to substitute oil-based raw materials and support circular economy initiatives.
CO2 utilization, plastics, raw materials, Covestro, circular economy
false
Technology and Digital Transformation
Energy & Utilities
Diagram
Kearney
Add to my slides
Remove from favorites
The slide features a flowchart depicting the order of magnitude of CO2 storage and utilization. It includes branches for conversion and non-conversion processes with specific applications like mineralization, biological, chemical, etc.
Technology and Digital Transformation
Environmental Services & Sustainability
The slide outlines the various technological pathways and their respective capacities for CO2 utilization and storage, showcasing a broad range of solutions for either using or storing carbon dioxide.
CO2 utilization, storage, technology, pathways, conversion processes
false
Technology and Digital Transformation
Environmental Services & Sustainability
Diagram
Kearney
Add to my slides
Remove from favorites
The slide features a comparative analysis with column charts and bar charts showing CO2 avoided and CO2 avoidance cost for FCEV and BEV under different energy sources.
Regulatory and Compliance
Energy & Utilities
The slide compares carbon abatement costs and CO2 savings for fuel cell electric vehicles and battery electric vehicles, considering various energy sources for charging stations.
CO2, FCEV, BEV, carbon abatement, energy sources
false
Regulatory and Compliance
Energy & Utilities
Multiple Chart
Kearney
Add to my slides
Remove from favorites
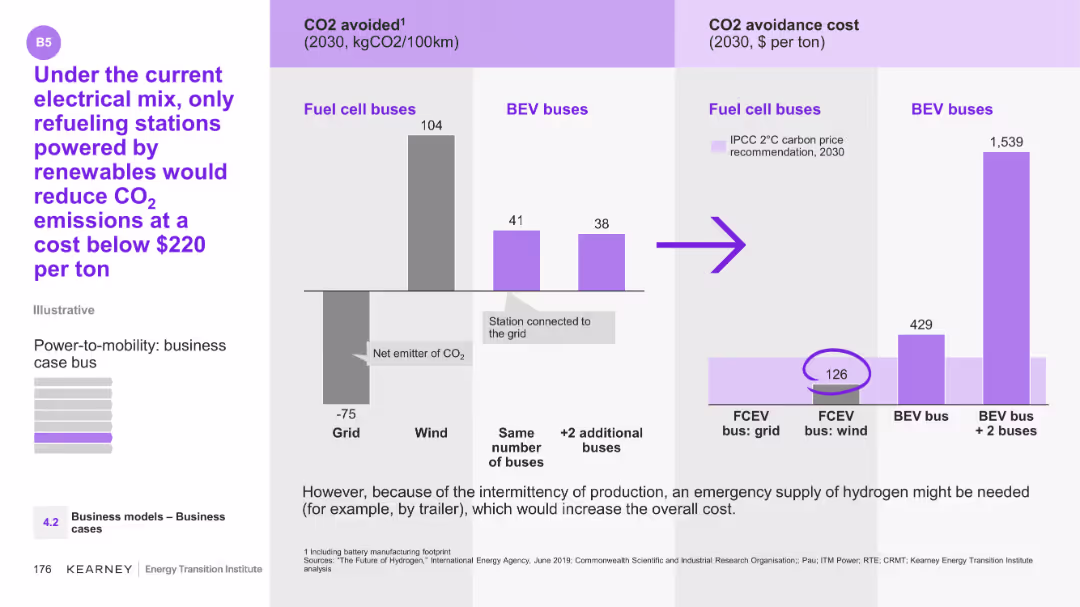
The slide features a column chart showing CO2 avoided for fuel cell buses and BEV buses, along with their CO2 avoidance costs.
Technology and Digital Transformation
Energy & Utilities
The slide compares CO2 emissions and avoidance costs between fuel cell and BEV buses under different energy sources. It suggests that only renewable-powered refueling stations can reduce CO2 emissions cost-effectively.
CO2, emissions, fuel cell buses, BEV buses, renewables
false
Technology and Digital Transformation
Energy & Utilities
Multiple Chart
Kearney
Add to my slides
Remove from favorites
The slide features two column charts comparing storage cost curves for onshore and offshore CO2 storage in the US for 2017. The charts are labeled with percentages on the vertical axis and storage amounts on the horizontal axis.
Market Analysis and Trends
Energy & Utilities
The slide presents the storage cost curve for onshore and offshore CO2 storage in the US for 2017, highlighting that CO2 for EOR is at negative costs, and most of the onshore storage capacity in the US is available for less than $10 per ton of CO2.
CO2, storage, onshore, offshore, cost curve
false
Market Analysis and Trends
Energy & Utilities
Multiple Chart
Kearney
Add to my slides
Remove from favorites
The slide includes two charts: one showing oil price scenarios and associated US CO2-EOR production forecasts, and another showing the proportion of CO2-EOR in total EOR production. The charts are color-coded with projections until 2040.
Market Analysis and Trends
Energy & Utilities
The slide analyzes the impact of oil prices on the demand for CO2-EOR projects and forecasts the production of CO2-EOR in the US, indicating potential future trends and challenges due to price fluctuations.
CO2-EOR, oil prices, production forecasts, US market, future trends
false
Market Analysis and Trends
Energy & Utilities
Multiple Chart
Kearney
Add to my slides
Remove from favorites
The slide displays a table listing different CO2-based products, their compounds, and the current status of deployment, categorized into commercial, lab-scale, and demonstration stages. It uses color coding for each category.
Product and Service Analysis
Energy & Utilities
The slide provides a detailed overview of various CO2-based chemical products, their current development stages, and potential applications, highlighting the maturity levels of different pathways.
CO2-based products, chemical compounds, deployment status, maturity stages
false
Product and Service Analysis
Energy & Utilities
Table
Kearney
Add to my slides
Remove from favorites
The slide features a bar chart and pie charts displaying cost structures and impact potential for an automotive supplier's typical P/L.
Financial Performance
Industrial & Manufacturing
Examines the cost structure of an automotive supplier, highlighting the significant share of COGS and the easier impact on SG&A in the short and medium term.
COGS, SG&A, automotive, costs, impact, P/L, financial performance, bar chart, pie chart
false
Financial Performance
Industrial & Manufacturing
Single Chart
EY
Add to my slides
Remove from favorites
Features a structured checklist format outlining various governmental actions needed to meet COP26 ambitions, including strategies for decarbonization, energy transition costs, and green financing.
Regulatory and Compliance
Energy & Utilities
Details a comprehensive framework for government actions within SEA to build visibility and implement actionable plans that align with COP26 ambitions, focusing on regulatory, financial, and collaborative measures to facilitate the green transition.
COP26, Government Strategies, Decarbonization, SEA, Green Financing
false
Regulatory and Compliance
Energy & Utilities
Header Horizontal
Bain
Add to my slides
Remove from favorites
Line graphs with mobility data indexed to pre-pandemic baselines.
Operational Efficiency
Technology & Software
Slide with mobility trends indicating consumer behavior change post-COVID restrictions. Useful for analyzing the impact on retail and hospitality industries.
COVID restrictions, consumer behavior, mobility data, retail, hospitality
false
Operational Efficiency
Technology & Software
Multiple Chart
Bain
Add to my slides
Remove from favorites
Featuring a vertical bar graph, this slide depicts the timeline of COVID-19's impact on the US economy. Accompanying text boxes provide additional insights into investors' perspectives.
Market Analysis and Trends
Financial Services
Presents investors' beliefs on the diminishing economic impact of COVID-19, relevant for assessing market risks and investment approaches.
COVID-19 Impact, Economic Analysis, Investor Beliefs, Risk Assessment, Market Sentiment, Investment Decisions, Economic Recovery, Pandemic Effects, Health Crisis, Investment Strategies
false
Market Analysis and Trends
Financial Services
Single Chart
BCG
Add to my slides
Remove from favorites
A column chart showing employment losses in the first six months of 2020 across various Canadian metropolitan areas, highlighting the significant impact on Metro Vancouver.
Market Analysis and Trends
Professional Services
This slide presents the economic impact of COVID-19, focusing on employment losses in Canadian metropolitan areas, with a spotlight on the severe impact on Metro Vancouver.
COVID-19 impact, employment losses, Metro Vancouver, Canada
false
Market Analysis and Trends
Professional Services
Single Chart
Deloitte
Add to my slides
Remove from favorites
Bar chart showing the percentage of companies experiencing various degrees of revenue impact due to COVID-19.
Risk Assessment and Management
Professional Services
This slide details the financial impact of COVID-19 on companies, highlighting different extents of revenue decreases and increases.
COVID-19 impact, revenue changes, company performance, financial risk
false
Risk Assessment and Management
Professional Services
Single Chart
PwC/Strategy&
Add to my slides
Remove from favorites
Contains multiple bar charts aligned horizontally displaying the percentages of consumers delaying, maintaining, or increasing vehicle maintenance and repairs post-COVID-19. Colors differentiate actions across several countries.
Market Analysis and Trends
Transportation & Logistics
Discusses the impact of COVID-19 on consumer behaviors related to vehicle maintenance and repair, showing trends of postponement and additional work done across different nations.
COVID-19 impact, vehicle maintenance, consumer behavior, repair trends, international comparison
false
Market Analysis and Trends
Transportation & Logistics
Single Chart
McKinsey
Add to my slides
Remove from favorites
Features a stacked area chart for variant frequencies and a scatter plot comparing the antibody resistance of COVID-19 variants.
Regulatory and Compliance
Healthcare & Pharmaceuticals
Details the prevalence of COVID-19 variants and their implications on vaccine efficacy, stressing the need for continued vigilance.
COVID-19 variants, vaccine efficacy, public health, antibody resistance, variant tracking, health policy
false
Regulatory and Compliance
Healthcare & Pharmaceuticals
Multiple Chart
BCG
Add to my slides
Remove from favorites
Includes several line graphs showing predicted infection paths under different immunity and infection rate scenarios, annotated for clarity and comparison.
Strategic Planning
Healthcare & Pharmaceuticals
Analyzes potential COVID-19 infection trajectories for Austria under various public health response scenarios, aiding in policy decision-making and strategy adjustment.
COVID-19, Austria, scenario analysis, infection rates, public health response, policy planning
false
Strategic Planning
Healthcare & Pharmaceuticals
Multiple Chart
McKinsey
Add to my slides
Remove from favorites
Large area graph showing the daily new cases with a 7-day rolling average, accompanied by key observations that include numerical and percentage data.
Risk Assessment and Management
Government & Public Sector
Analyzes the rise in COVID-19 cases in early July 2020 and provides a snapshot of the global situation with key statistics on active cases, recoveries, and fatalities.
COVID-19, Case Growth, Recovery Rates, Summer Spread
false
Risk Assessment and Management
Government & Public Sector
Single Chart
BCG
Add to my slides
Remove from favorites
The slide features a series of icons representing different communication channels, each accompanied by a percentage showing adoption or changes. This visual layout allows for a quick assessment of how COVID-19 has influenced channel strategies.
Technology and Digital Transformation
Professional Services
Discusses the transformation in marketing channels due to COVID-19, focusing on the shift towards more digital and direct-to-consumer approaches. It provides insights into how companies are adapting their communication and sales strategies in response to the pandemic, which is valuable for planning future marketing and sales initiatives.
COVID-19, Channel Strategy, Digital Transformation, Marketing, Sales
false
Technology and Digital Transformation
Professional Services
Pillar
Deloitte
Add to my slides
Remove from favorites
Line graphs comparing daily traffic index, coal consumption, and property transactions in China before and during COVID-19, marked with key dates.
Strategic Planning
Financial Services
Tracks the early signs of economic recovery in China, analyzing daily activities, energy consumption, and property transactions as of April 2020.
COVID-19, China, economic recovery, traffic, coal consumption, property transactions, analysis, recovery tracking
false
Strategic Planning
Financial Services
Multiple Chart
BCG
Add to my slides
Remove from favorites
This slide features a complex chart with a key explaining demographics, a world map, and a large pie chart in the center describing work situations.
Market Analysis and Trends
Retail & E-commerce
Details Accenture's research on consumer behavior during COVID-19, showing how attitudes, behaviors, and habits are likely to change post-crisis.
COVID-19, Consumer Research, Global Survey, Work Situations, Social Distancing, Demographics, Behavioral Change
false
Market Analysis and Trends
Retail & E-commerce
Mixed Chart
Accenture
Add to my slides
Remove from favorites
Contains a line chart showing the change in consumer sentiment about COVID-19 over time in the US and emerging markets. The layout is simple with clear labels and a contrasting color scheme for clarity.
Market Analysis and Trends
Healthcare & Pharmaceuticals
Discusses changes in consumer confidence in the US and emerging markets due to the COVID-19 Delta variant, using survey data to illustrate perceptions over time and expectations for economic recovery.
COVID-19, Delta Variant, Consumer Sentiment, Markets
false
Market Analysis and Trends
Healthcare & Pharmaceuticals
Mixed Chart
BCG
Add to my slides
Remove from favorites
Features a stacked area chart tracking the frequency of COVID-19 variants over time with multiple color-coded layers representing different variants.
Market Analysis and Trends
Healthcare & Pharmaceuticals
This slide presents the dominance of the Delta variant among COVID-19 cases over time, useful for epidemiological tracking and vaccine strategy adjustments.
COVID-19, Delta variant, epidemiology, vaccine strategy, variant tracking
false
Market Analysis and Trends
Healthcare & Pharmaceuticals
Single Chart
BCG
Add to my slides
Remove from favorites
This slide features a detailed area graph depicting the rolling average of daily new COVID-19 cases globally, segmented by continent. The design is straightforward, focusing on the data presentation with minimal distractions. The color coding by region helps in distinguishing the data visually.
Market Analysis and Trends
Healthcare & Pharmaceuticals
Offers an in-depth analysis of the spread of the COVID-19 Delta variant and its impact on global case numbers. Highlights the effectiveness of vaccination efforts in reducing case numbers and discusses potential future trends in the pandemic's progression, providing valuable insights for healthcare and public health planning.
COVID-19, Delta variant, global health, pandemic trends, vaccination impact, public health, area graph
false
Market Analysis and Trends
Healthcare & Pharmaceuticals
Mixed Chart
BCG
Add to my slides
Remove from favorites
Line graph comparing daily cases per million population in several countries with accompanying text on lockdown strategies and cumulative cases.
Risk Assessment and Management
Government & Public Sector
Compares COVID-19 case trends in different countries and correlates them with their respective lockdown strategies.
COVID-19, Developed Economies, Lockdown Strategies, Case Trends
false
Risk Assessment and Management
Government & Public Sector
Single Chart
BCG
Add to my slides
Remove from favorites
The slide features a mix of icons, bullet points, and sections of text, with a bold title at the top. It uses contrasting blue and white color blocks to differentiate points.
Strategic Planning
Healthcare & Pharmaceuticals
This slide details how COVID-19 has accelerated the adoption of digital solutions in healthcare, emphasizing innovations and pre-COVID-19 impediments to digital transformation in patient support solutions.
COVID-19, Digital Solutions, Healthcare, Patient Support, Telemedicine, e-Pharmacy, Innovation, Barriers, Adoption, Transformation
false
Strategic Planning
Healthcare & Pharmaceuticals
Header Vertical
Bain
Add to my slides
Remove from favorites
Pie chart showing the estimated duration of COVID-19's economic impact. Segments represent different time frames, with a majority predicting a prolonged effect. Text explains the context.
Market Analysis and Trends
Financial Services
This slide presents Canadian investors' views on the duration of COVID-19's impact on the economy, with a significant portion expecting the effects to last until April 2022 or longer. It discusses the variations in perceptions based on age and gender.
COVID-19, Economic Impact, Canadian, Duration, Prediction
false
Market Analysis and Trends
Financial Services
Mixed Chart
IPSOS
Add to my slides
Remove from favorites
Bar chart illustrating the expected time for economic recovery post-COVID-19, ranging from one year to more than five years. Additional text provides insights.
Risk Assessment and Management
Financial Services
The slide outlines expectations for the Canadian economy's recovery time post-COVID-19, showing a range of predictions from one year to more than five years. It highlights the divide between optimists and pessimists regarding the economic rebound timeline.
COVID-19, Economic Recovery, Canadian, Timeline, Prediction
false
Risk Assessment and Management
Financial Services
Mixed Chart
IPSOS
Add to my slides
Remove from favorites
Data-heavy slide with bar graphs and charts showing daily cases, growth of daily new cases, recovery rates, and testing data for the top 15 economies by GDP.
Risk Assessment and Management
Government & Public Sector
Presents detailed COVID-19 case numbers, recovery rates, and testing data for major economies, highlighting the disparity in pandemic management.
COVID-19, Economy, Recovery, Testing, GDP, Pandemic Management
false
Risk Assessment and Management
Government & Public Sector
Multiple Chart
BCG
Add to my slides
Remove from favorites
The slide features a timeline table format, showcasing key educational developments during COVID-19 across various countries. It uses shades of blue for emphasis and has a clear header.
Regulatory and Compliance
Education & Training
It displays the educational response to COVID-19 in Southeast Asia, with timelines for school closures and alternative educational arrangements, demonstrating the shift towards online learning solutions.
COVID-19, Education, Response, SEA, School Closures, Online Learning, Alternatives, Timelines, Developments, Shift
false
Regulatory and Compliance
Education & Training
Mixed Chart
Bain
Add to my slides
Remove from favorites
Showcases a world map and timeline of COVID-19 case statistics, using color gradients to denote varying conditions across regions, complemented by key data points on recoveries and infection rates.
Strategic Planning
Healthcare & Pharmaceuticals
Provides a global overview of COVID-19 recovery rates and case doubling times, useful for public health monitoring and response planning.
COVID-19, Epidemic monitoring, Global health, Public health, Recovery rates
false
Strategic Planning
Healthcare & Pharmaceuticals
Mixed Chart
BCG
Add to my slides
Remove from favorites
This slide presents data in a series of well-organized tables and charts. It compares epidemiological data across various European countries with economic indicators on the side. There's a consistent color theme for visual clarity.
Market Analysis and Trends
Government & Public Sector
This slide compares COVID-19 data among European countries, with a focus on epidemiological and economic impacts. It is designed for presenting to stakeholders interested in the pandemic's effects and measures like travel restrictions and health notices, with country-specific details for a granular approach.
COVID-19, Europe, Data Comparison, Travel Restrictions, Health Notice, Economic Impact, Epidemiological Data, Country-Specific, Pandemic, Measures
false
Market Analysis and Trends
Government & Public Sector
Multiple Chart
McKinsey
Add to my slides
Remove from favorites
The slide contains text analysis and a pie chart comparing the perceived impact of COVID-19 and the 2007-08 Financial Crisis on investors. Clean white background.
Market Analysis and Trends
Financial Services
This slide compares the impact of COVID-19 and the Financial Crisis of 2007-08 on investors, highlighting differences in perception and resulting investment behavior.
COVID-19, Financial Crisis, comparison, perception, investment behavior
false
Market Analysis and Trends
Financial Services
Mixed Chart
IPSOS
Add to my slides
Remove from favorites
Stacked bar chart showing the self-assessed financial situations of respondents compared to pre-COVID-19. The chart divides responses into categories from 'Much worse off' to 'Much better off'.
Risk Assessment and Management
Financial Services
The slide analyzes the perceived financial impact of COVID-19 on Canadian investors, indicating that a significant portion felt worse off financially. It highlights variations across income groups, showing those with lower incomes were more adversely affected.
COVID-19, Financial Impact, Canadian, Income, Pandemic
false
Risk Assessment and Management
Financial Services
Mixed Chart
IPSOS
Add to my slides
Remove from favorites
Bar chart showing the estimated time for financial recovery among households post-COVID-19. Categories range from one year to more than five years.
Risk Assessment and Management
Financial Services
The slide details the estimated time for Canadian households to recover financially from COVID-19, with responses indicating a range from one year to more than five years. It also notes a small percentage of respondents who feel their finances were not significantly impacted.
COVID-19, Financial Recovery, Canadian, Households, Pandemic
false
Risk Assessment and Management
Financial Services
Mixed Chart
IPSOS
Add to my slides
Remove from favorites
This slide features a detailed comparison of three uncertainty scenarios: Base, Downside, and Upside. It uses icons and color coding for visual distinction.
Risk Assessment and Management
Professional Services
Discusses three potential economic scenarios regarding impacts such as COVID-19, geopolitical risks, and global supply chains. Each scenario (Base, Downside, Upside) includes detailed impacts and macroeconomic driver information. Useful for risk assessment and strategic decision-making.
COVID-19, Geopolitical Risk, Supply Chain, Inflation, GDP, Scenario Analysis, Economic Drivers, Risk Management
false
Risk Assessment and Management
Professional Services
Table
Deloitte
Add to my slides
Remove from favorites
Dual-graph layout with a line graph on the left displaying global mobility and new infection rates, and a combined bar and line graph on the right comparing stock baskets and treasury yield. Utilizes contrasting colors and is text-heavy at the top with annotations for data points.
Market Analysis and Trends
Healthcare & Pharmaceuticals
The slide presents data on how COVID-19 variants affect different industries, showing a relationship between global mobility, infection rates, and market performance in various sectors. Intended for financial market analysis and predicting economic trends.
COVID-19, Global Mobility, Market Impact, Infection Rates, Stock Performance, Stay-at-Home Basket, Treasury Yield, Economic Trends
false
Market Analysis and Trends
Healthcare & Pharmaceuticals
Multiple Chart
Citigroup
Add to my slides
Remove from favorites
List of key government actions to combat COVID-19 with descriptive footnotes and examples of countries implementing these actions.
Risk Assessment and Management
Government & Public Sector
Suggests five critical actions that governments can take to protect the population and limit hospitalizations during the pandemic.
COVID-19, Government Actions, Hospitalizations, Protective Measures
false
Risk Assessment and Management
Government & Public Sector
Pillar
BCG
Add to my slides
Remove from favorites
Text-heavy slide with headings and subheadings, outlining the document's objectives and leadership guidance.
Industry Overview
Government & Public Sector
Summarizes the global impact of COVID-19 and the need for an integrated response from leaders across sectors.
COVID-19, Health Crisis, Leadership, Integrated Response, Societal Impact
false
Industry Overview
Government & Public Sector
Text Only
BCG
Add to my slides
Remove from favorites
U.S. map with color gradients representing daily cases per million, bar graphs for top 5 states by daily cases, and temporal changes from April to July.
Risk Assessment and Management
Government & Public Sector
Displays the shift in COVID-19 hotspots within the U.S. over time, with a focus on case distribution per state.
COVID-19, Hotspots, Case Distribution, USA, Regional Shift
false
Risk Assessment and Management
Government & Public Sector
Mixed Chart
BCG
Add to my slides
Remove from favorites
The slide has a title at the top, text in the middle, and a column chart at the bottom illustrating COVID-19 impact on respondents.
Risk Assessment and Management
Healthcare & Pharmaceuticals
Presents data on COVID-19 impact, showing that 33% of respondents had COVID-19 or knew someone who had. Data is categorized by relationships such as family members and friends.
COVID-19, Impact, Survey, Health, Data
false
Risk Assessment and Management
Healthcare & Pharmaceuticals
Single Chart
IPSOS
Add to my slides
Remove from favorites
Timeline representation with key milestones and decisions made by India, Australia, and Spain regarding lockdown measures in response to COVID-19.
Risk Assessment and Management
Government & Public Sector
Outlines the progression of lockdown measures and responses to possible second waves in various countries.
COVID-19, Lockdown Measures, Second Wave, Policy Response
false
Risk Assessment and Management
Government & Public Sector
Linear Flow
BCG
Add to my slides
Remove from favorites
Contains two line graphs showing the progression of COVID-19 cases in various countries, categorized by stages of the outbreak.
Market Analysis and Trends
Professional Services
Analyzes the progression of COVID-19 by categorizing markets into 'Advancing' or 'Stabilizing' based on case trends and government actions.
COVID-19, Market Analysis, Advancing, Stabilizing, Government Actions, Case Trends, Line Graphs, Global Perspective
false
Market Analysis and Trends
Professional Services
Multiple Chart
Accenture
Add to my slides
Remove from favorites
Comprises a descriptive text and a series of bar charts illustrating adherence levels to public health guidelines, segmented by millennials and Gen Z.
Client Case Studies
Healthcare & Pharmaceuticals
Reviews the adherence of millennials and Gen Z to COVID-19 health guidelines, providing statistical insights and societal behaviors.
COVID-19, Millennials, Gen Z, Health Guidelines, Social Research
false
Client Case Studies
Healthcare & Pharmaceuticals
Mixed Chart
Deloitte
Add to my slides
Remove from favorites
Map highlighting surveyed regions, icons representing survey waves and respondent statistics.
Market Analysis and Trends
Transportation & Logistics
Summarizes the scope and methodology of a global survey on automotive and mobility trends amid COVID-19.
COVID-19, Mobility, Survey, Global, Automotive
false
Market Analysis and Trends
Transportation & Logistics
Pillar
McKinsey
Add to my slides
Remove from favorites
Pie chart and accompanying text estimating the duration of COVID-19's impact on personal finances. Different time frames are shown as segments of the pie chart.
Market Analysis and Trends
Financial Services
This slide shows Canadian investors' perceptions of how long COVID-19 will affect their personal finances. It includes predictions ranging from a few months to more than 18 months, highlighting uncertainties and differences based on demographics.
COVID-19, Personal Finances, Canadian, Duration, Impact
false
Market Analysis and Trends
Financial Services
Mixed Chart
IPSOS
Add to my slides
Remove from favorites
Bar chart displaying the impact of COVID-19 on savings goals. The chart compares the percentage of respondents who stopped or continued saving for each goal. A summary at the top provides context.
Risk Assessment and Management
Financial Services
The slide details how the COVID-19 pandemic affected Canadian investors' savings goals, showing the proportion who stopped saving for goals like travel, education, and retirement. It highlights demographic and income differences in the impact of the pandemic on savings behavior.
COVID-19, Savings, Goals, Canadian, Pandemic, Impact
false
Risk Assessment and Management
Financial Services
Mixed Chart
IPSOS
Add to my slides
Remove from favorites
The slide features a complex line graph showing the percentage draw-down of the United States Real GDP from the 1900s to the projected 2020s. Two scenarios are highlighted post-2020 with projected impacts of -8% and -13%. The timeline is divided into Pre-WWII and Post-WWII periods. The color scheme includes grey for historical data and blue for future projections.
Market Analysis and Trends
Financial Services
The slide presents a historical analysis of the U.S. GDP over a century, with a focus on the projected economic impact of COVID-19. It suggests that the pandemic could have unprecedented negative effects on the economy, surpassing post-WWII figures.
COVID-19, U.S. GDP, economic impact, historical analysis, projection, WWII, financial crisis, market trends, scenario analysis
false
Market Analysis and Trends
Financial Services
Single Chart
McKinsey
Add to my slides
Remove from favorites
Features a historical line graph of US GDP since 1900 with projections under different COVID-19 scenarios. Highly detailed and informative.
Market Analysis and Trends
Financial Services
Evaluates the potential impact of COVID-19 on US GDP, comparing it to past economic downturns, useful for historical economic comparisons.
COVID-19, US, GDP, Impact, Historical
false
Market Analysis and Trends
Financial Services
Single Chart
McKinsey
Add to my slides
Remove from favorites
Utilizes a stacked area chart to depict the distribution of new COVID-19 cases across US regions from April to July 2020, colored by region.
Market Analysis and Trends
Healthcare & Pharmaceuticals
Presents the regional distribution of new COVID-19 cases in the US, showing how the case load has shifted from the Northeast to the Southern and Western states, providing insights into the dynamics of the pandemic’s domestic spread.
COVID-19, US, cases, regional, 2020
false
Market Analysis and Trends
Healthcare & Pharmaceuticals
Single Chart
McKinsey
Add to my slides
Remove from favorites
Slide contains multiple column charts comparing consumer valuation of autonomous vehicles before and after COVID-19 across several countries. Each country is represented with a flag and percentage changes are shown in blue and black columns.
Market Analysis and Trends
Technology & Software
This slide analyzes the shift in consumer values regarding autonomous vehicles due to the COVID-19 pandemic, highlighting significant regional differences and the impact on technology and transportation industries.
COVID-19, autonomous vehicles, consumer behavior, market analysis, technology, transportation
false
Market Analysis and Trends
Technology & Software
Single Chart
McKinsey
Add to my slides
Remove from favorites
This slide features a column chart showing projected declines in general fund receipts for New York from 2020 to 2024, due to COVID-19. The charts use different shades of green to represent original budget gaps versus the impact of COVID-19.
Financial Performance
Government & Public Sector
Analyzes the fiscal impact of COVID-19 on New York’s budget, highlighting changes in fund receipts and total budget gaps. Useful for financial and governmental presentations on managing budget shortfalls during pandemics.
COVID-19, budget, New York, fund receipts, fiscal impact, projections, government finance
false
Financial Performance
Government & Public Sector
Single Chart
BCG
Add to my slides
Remove from favorites
The slide features multiple column charts with percentages indicating new car purchase intent and changes in mobility mode.
Market Analysis and Trends
Transportation & Logistics
Analyzes the impact of COVID-19 on consumer behaviors related to car buying, aftermarket services, and mobility preferences.
COVID-19, car purchase, mobility, consumer behavior, market analysis
false
Market Analysis and Trends
Transportation & Logistics
Multiple Chart
McKinsey
Add to my slides
Remove from favorites
Shows a stacked area chart of daily new COVID-19 cases by region and highlights key epidemic progression metrics.
Regulatory and Compliance
Healthcare & Pharmaceuticals
Analyzes regional COVID-19 case trends and the progress in vaccine rollout, emphasizing the significant drop in cases due to vaccination efforts.
COVID-19, case trends, vaccine rollout, regional data, public health, epidemic progression
false
Regulatory and Compliance
Healthcare & Pharmaceuticals
Mixed Chart
BCG
Add to my slides
Remove from favorites
Slide with a graph displaying the cumulative number of COVID-19 cases by date, colored by region, with annotations and a key.
Risk Assessment and Management
Healthcare & Pharmaceuticals
The slide is analytical, comparing the spread of COVID-19 across regions, useful for policymakers or health professionals assessing risk and progression.
COVID-19, cases, Europe, U.S., Asia, transmission, data analysis, risk management
false
Risk Assessment and Management
Healthcare & Pharmaceuticals
Mixed Chart
McKinsey
Add to my slides
Remove from favorites
Features three line graphs comparing the daily new confirmed COVID-19 cases per million in various countries, color-coded by scenario (resurgence, continuation, delayed).
Market Analysis and Trends
Healthcare & Pharmaceuticals
Provides an overview of COVID-19 case trends in different countries, classifying them into categories based on their pandemic stage: resurgence, continuation, or delayed.
COVID-19, cases, countries, trends, analysis
false
Market Analysis and Trends
Healthcare & Pharmaceuticals
Multiple Chart
BCG
Add to my slides
Remove from favorites
Features a stacked area chart showing the proportion of new COVID-19 cases by region over time, highlighting shifts from January to July 2020.
Market Analysis and Trends
Healthcare & Pharmaceuticals
Tracks the change in the distribution of new COVID-19 cases globally, illustrating the shifts from predominantly European to North American, Latin American, and Asian regions, providing a timeline of the pandemic spread.
COVID-19, cases, global, trends, 2020
false
Market Analysis and Trends
Healthcare & Pharmaceuticals
Single Chart
McKinsey
Add to my slides
Remove from favorites
The slide displays multiple line graphs with color-coded lines representing different countries.
Strategic Planning
Healthcare & Pharmaceuticals
This slide compares COVID-19 case trends in various countries, categorized into groups like 'Continuation' and 'Crush and contain', useful for analyzing pandemic responses.
COVID-19, cases, trends, countries, graphs
false
Strategic Planning
Healthcare & Pharmaceuticals
Multiple Chart
BCG
Add to my slides
Remove from favorites
Features a series of column charts comparing shifts in consumer behavior across various service sectors. The design utilizes blue tones and is labeled for clarity.
Market Analysis and Trends
Technology & Software
This slide shows the changes in user behavior due to COVID-19, with significant shifts to online services in food delivery, groceries, and education. Useful for analyzing consumer trends and market shifts during a pandemic.
COVID-19, consumer behavior, food delivery, online services, education, groceries
false
Market Analysis and Trends
Technology & Software
Single Chart
Bain
Add to my slides
Remove from favorites
Depicts a woman and child shopping online, with a bold purple title indicating a focus on COVID-19's impact on retail consumers.
Market Analysis and Trends
Retail & E-commerce
Introduces a report on how COVID-19 has altered consumer behavior, specifically in the retail sector, with data-driven insights.
COVID-19, consumer behavior, retail, market research, data-driven insights, consumer insights
false
Market Analysis and Trends
Retail & E-commerce
Title
Accenture
Add to my slides
Remove from favorites
Bar charts showing U.S. consumer willingness to resume activities post-lockdown under various conditions, with observations on current sentiment.
Strategic Planning
Financial Services
Surveys U.S. consumer sentiment on resuming everyday activities post-COVID-19 lockdown, indicating varied readiness depending on conditions.
COVID-19, consumer sentiment, U.S., activities, lockdown, behavior analysis, readiness, conditions
false
Strategic Planning
Financial Services
Multiple Chart
BCG
Add to my slides
Remove from favorites
Line graph comparing consumer sentiment over time in five countries regarding the ongoing impact of COVID-19.
Market Analysis and Trends
Consumer Goods
Tracks changes in consumer sentiment during the COVID-19 pandemic across different regions, useful for market analysis in consumer goods industries.
COVID-19, consumer sentiment, market analysis, trends, regions
false
Market Analysis and Trends
Consumer Goods
Single Chart
BCG
Add to my slides
Remove from favorites
A large multi-colored area graph dominates this slide, charting the increase in daily COVID-19 cases by region from March to December. The background is gray, and each region (like North America, South America) is represented in a different color, with key data points highlighted on the graph.
Strategic Planning
Healthcare & Pharmaceuticals
Details the dramatic increase in COVID-19 cases globally with a focus on recent months. It provides a visual analysis of the pandemic's surge in different regions, emphasizing the growth in cases and the ongoing challenges in managing the spread.
COVID-19, daily cases, global, regions, pandemic, trends, healthcare
false
Strategic Planning
Healthcare & Pharmaceuticals
Single Chart
BCG
Add to my slides
Remove from favorites
Slide includes multiple column charts comparing COVID-19 death rates and case growth across top countries, emphasizing European and North American data.
Risk Assessment and Management
Healthcare & Pharmaceuticals
Analyzes COVID-19 death rates per capita in top affected countries, particularly in Europe and North America, and discusses the trends in new cases, offering insights into the pandemic's regional impacts as of June 2020.
COVID-19, death rates, Europe, North America
false
Risk Assessment and Management
Healthcare & Pharmaceuticals
Mixed Chart
McKinsey
Add to my slides
Remove from favorites
This slide compares the percentage of respondents engaging in online activities before and after COVID-19 with bar graphs and a textual summary.
Market Analysis and Trends
Technology & Software
It shows how the pandemic increased online engagement and awareness, crucial for understanding consumer behavior changes and market opportunities.
COVID-19, digital adoption, online activities, market analysis, consumer behavior, awareness, engagement, pandemic
false
Market Analysis and Trends
Technology & Software
Multiple Chart
Kearney
Add to my slides
Remove from favorites
With a deep purple backdrop, the slide includes vertical bar graphs illustrating pre and post-COVID-19 online activity changes.
Market Analysis and Trends
Technology & Software
Highlights the amplified use of telehealth, online learning, shopping, and government services on the nbn network as a result of COVID-19.
COVID-19, digital alternatives, nbn network, online activities, telehealth, online learning, government services
false
Market Analysis and Trends
Technology & Software
Multiple Chart
Accenture
Add to my slides
Remove from favorites
Three-column chart with icons: a clock (>80% more urgent), a hand with a dollar sign (~65% anticipate more investments), and a gear (priorities on remote work and automation).
Market Analysis and Trends
Technology & Software
Highlights increased urgency and investment in digital transformation post-COVID-19. Useful for discussing strategic planning in technology adoption and operational adjustments within businesses.
COVID-19, digital transformation, investment, remote work, cybersecurity, marketing, automation
false
Market Analysis and Trends
Technology & Software
Pillar
BCG
Add to my slides
Remove from favorites
The slide contains an area chart showing the projected economic impact of COVID-19 on New York's GDP, compared to the pre-COVID baseline. It visually represents data points through shading and text annotations to highlight key figures like total economic loss.
Financial Performance
Government & Public Sector
Provides detailed projections of the economic impact of COVID-19 on New York, including total loss and timeline to recovery. Valuable for discussions on fiscal planning and economic strategies in response to pandemics.
COVID-19, economic impact, GDP, New York, projections, recovery, fiscal planning
false
Financial Performance
Government & Public Sector
Mixed Chart
BCG
Add to my slides
Remove from favorites
The slide features a column chart and line graph visualizing the Philippine economy's GDP growth, unemployment trends, and PSE Index values during the COVID-19 pandemic.
Market Analysis and Trends
Government & Public Sector
Analyzes the economic impact of COVID-19 on the Philippines, detailing GDP changes, unemployment rates, and stock market performance.
COVID-19, economic impact, Philippines, GDP, unemployment, stock market, column chart, line graph
false
Market Analysis and Trends
Government & Public Sector
Mixed Chart
Deloitte
Add to my slides
Remove from favorites
Color-coded matrix showing potential economic impacts in the U.S. based on different lengths of COVID-19 suppression and associated economic downturns.
Financial Performance
Financial Services
Analyzes the potential economic losses from COVID-19 in the U.S. under various suppression scenario lengths, useful for financial planning and analysis.
COVID-19, economic impact, financial analysis, suppression, U.S., scenarios, losses, planning
false
Financial Performance
Financial Services
Table
BCG
Add to my slides
Remove from favorites
Slide shows bar graphs comparing economic conditions globally, with a focus on how perceptions have shifted over the last six months.
Market Analysis and Trends
Financial Services
Discusses the economic impact of COVID-19 worldwide, showing trends in economic perception and conditions over recent months. Essential for financial analysts and economic forecasters.
COVID-19, economic impact, global economy, market conditions, financial analysis, trend analysis
false
Market Analysis and Trends
Financial Services
Multiple Chart
McKinsey
Add to my slides
Remove from favorites
This slide presents multiple data visualizations, including bar charts and line graphs, tracking COVID-19's impact on various factors like mobility, economic forecasts, and consumer activity from August to November. Each section uses a different color to denote the type of data being represented, like green for mobility and red for GDP.
Strategic Planning
Financial Services
Summarizes key metrics affected by COVID-19, such as global epidemic progression, mobility trends, GDP forecasts, and stock market performance. It provides a comprehensive overview of how different sectors and regions are recovering from the pandemic impacts.
COVID-19, economic impact, healthcare, GDP, mobility, stock markets
false
Strategic Planning
Financial Services
Mixed Chart
BCG
Add to my slides
Remove from favorites
Detailed diagrams and calculations explaining the methodology to estimate economic impact of COVID-19 by combining sectoral data with expected duration of crisis measures.
Strategic Planning
Financial Services
Explores the methodology to estimate economic impacts of COVID-19, combining industry-specific data with projected lengths of lockdowns and restrictions.
COVID-19, economic impact, sectoral analysis, lockdown duration, crisis measures, economic methodology
false
Strategic Planning
Financial Services
Multiple Chart
BCG
Add to my slides
Remove from favorites
Highly data-centric slide with graphs, charts, and bullet points presenting various leading indicators for economic recovery.
Performance Metrics and KPIs
Technology & Software
Provides a detailed dashboard of leading indicators related to COVID-19's economic impact in China, valuable for analysts and strategists.
COVID-19, economic indicators, China, Hubei, recovery tracking, consumer confidence, economic restart
false
Performance Metrics and KPIs
Technology & Software
Multiple Chart
McKinsey
Add to my slides
Remove from favorites
Bar charts displaying U.S. employment and revenue by sector during COVID-19, segmented by contact intensity and susceptibility to lockdown measures.
Market Analysis and Trends
Professional Services
Examines the impact of COVID-19 on various U.S. economic sectors, offering insights into employment and revenue changes under different restrictions.
COVID-19, economic sectors, employment, revenue, U.S., impact analysis, lockdown, sector analysis
false
Market Analysis and Trends
Professional Services
Multiple Chart
BCG
Add to my slides
Remove from favorites
This slide is split into two halves. The left side has a line graph titled "Global mobility at retail and recreation sites," showing a trend over time with activity levels relative to January 2020. The right side has a combined column and line graph titled "Zoom meetings vs workplace visits in person" comparing Zoom's revenue against workplace visits, with the latter indicated by bars and the former by a line. The background is white with a blue header.
Investment Analysis
Financial Services
The slide evaluates the impact of COVID-19 on the economy by comparing global mobility data with corporate earnings from a company like Zoom. It indicates a shift in the economy, with digital communication platforms becoming more significant as traditional mobility patterns change. This slide would be useful for financial analysts and investors considering the implications of COVID-19 on market trends, operational shifts, and investment decisions in the technology and service sectors.
COVID-19, economy, global mobility, Zoom, workplace visits, digital communication, market trends, operational shifts
false
Investment Analysis
Financial Services
Multiple Chart
Citigroup
Add to my slides
Remove from favorites
A bar graph displays the number of school days lost in different regions due to COVID-19, with dual-color bars representing fully and partially closed schools.
Market Analysis and Trends
Education & Training
This slide quantifies the educational disruption caused by COVID-19, showcasing the number of school days lost in different regions globally. It highlights the long-term effects on educational equality and economic impact.
COVID-19, education, impact, school closures
false
Market Analysis and Trends
Education & Training
Mixed Chart
Roland Berger
Add to my slides
Remove from favorites
Features a complex multi-line graph illustrating different response strategies and epidemic trajectories by country with color-coded lines and icons representing national flags.
Strategic Planning
Healthcare & Pharmaceuticals
Compares COVID-19 response strategies and their effectiveness across various countries, highlighting different stages of epidemic control and potential end-state strategies.
COVID-19, epidemic curve, country comparison, response strategies, healthcare policy, international
false
Strategic Planning
Healthcare & Pharmaceuticals
Mixed Chart
McKinsey
Add to my slides
Remove from favorites
Two distinct graphs are shown. The first graph plots daily growth rates of total cases with a log scale of confirmed cases, categorizing countries by their cases doubling rate. The second graph displays cumulative number of confirmed cases for selected countries with a curve that shows the progression over days.
Market Analysis and Trends
Healthcare & Pharmaceuticals
This slide visualizes the COVID-19 case growth trends and containment efforts across different countries, useful for analyzing epidemic progression and virus monitoring.
COVID-19, epidemic progression, virus monitoring, case growth, containment efforts, daily growth rate, cumulative cases, log scale
false
Market Analysis and Trends
Healthcare & Pharmaceuticals
Multiple Chart
BCG
Add to my slides
Remove from favorites
Contains stacked area chart and a line chart displaying global COVID-19 cases over time. Utilizes a color gradient for different continents.
Regulatory and Compliance
Healthcare & Pharmaceuticals
Slide presents global COVID-19 epidemic progression with a focus on daily cases and cumulative totals by region. Analyzes trends in case growth rates.
COVID-19, epidemic, cases, global, trends
false
Regulatory and Compliance
Healthcare & Pharmaceuticals
Multiple Chart
BCG
Add to my slides
Remove from favorites
Line chart comparing daily COVID-19 cases per million among the world's largest economies, annotated with key statistics on recent tests and case trends.
Regulatory and Compliance
Healthcare & Pharmaceuticals
Provides a comparative analysis of COVID-19 impact in major economies, focusing on daily cases per million and testing rates.
COVID-19, epidemiology, economies, cases
false
Regulatory and Compliance
Healthcare & Pharmaceuticals
Single Chart
BCG
Add to my slides
Remove from favorites
Slide displays a line graph showing an epidemic curve with stages marked by circles, and a dotted line representing potential future scenarios, set against a dark background.
Strategic Planning
Healthcare & Pharmaceuticals
Discusses the uncertainty in long-term COVID-19 spread and potential outcomes depending on public health decisions. Useful for strategic planning in healthcare and government policy-making.
COVID-19, epidemiology, healthcare capacity, epidemic curve, public health, future scenarios
false
Strategic Planning
Healthcare & Pharmaceuticals
Single Chart
McKinsey
Add to my slides
Remove from favorites
This slide includes a series of mini line charts depicting global executive opinions on various potential outcomes of the COVID-19 impact over the next year.
Risk Assessment and Management
Healthcare & Pharmaceuticals
Provides insights into executive expectations globally on public health response effectiveness and the potential scenarios regarding virus control or resurgence.
COVID-19, executive insights, health response, scenarios, impact
false
Risk Assessment and Management
Healthcare & Pharmaceuticals
Multiple Chart
McKinsey
Add to my slides
Remove from favorites
World map with data points and legends indicating COVID-19 spread and statistics, high visual complexity.
Risk Assessment and Management
Healthcare & Pharmaceuticals
Global dashboard showing the spread and impact of COVID-19, useful for risk assessment and international response planning.
COVID-19, global dashboard, transmission, pandemic, risk management, health crisis, leading indicators
false
Risk Assessment and Management
Healthcare & Pharmaceuticals
Graphic
McKinsey
Add to my slides
Remove from favorites
Features multiple small graphs showing different predicted scenarios for virus control globally, based on executive surveys over time.
Market Analysis and Trends
Healthcare & Pharmaceuticals
Provides a global perspective on expected COVID-19 outcomes, summarizing executive opinions and highlighting the variability in expected virus control scenarios.
COVID-19, global expectations, public health response, executive survey, virus outcomes, scenario analysis
false
Market Analysis and Trends
Healthcare & Pharmaceuticals
Multiple Chart
McKinsey
Add to my slides
Remove from favorites
The slide displays a complex array of data including graphs, charts, and tables summarizing various impacts of COVID-19 globally. It includes a variety of visual elements like color-coded sections, numerical indicators, and brief text explanations to convey information effectively.
Industry Overview
Financial Services
This comprehensive dashboard captures the global impact of COVID-19 across multiple dimensions, including epidemic progression, consumer activity, economic effects, and business impacts. It provides a snapshot of changes over time, offering insights into how different regions and sectors are navigating the pandemic.
COVID-19, global impact, economic effects, consumer behavior, business impacts, epidemic data, dashboard
false
Industry Overview
Financial Services
Mixed Chart
BCG
Add to my slides
Remove from favorites
Timeline showing different countries' responses to COVID-19 with a focus on lockdown measures and case doubling times.
Regulatory and Compliance
Government & Public Sector
Examines the timing and types of responses implemented by various countries to the COVID-19 pandemic, useful for comparative policy analysis and planning.
COVID-19, global response, lockdown, policy, timeline
false
Regulatory and Compliance
Government & Public Sector
Mixed Chart
BCG
Add to my slides
Remove from favorites
This slide presents a world map colored to indicate COVID-19 case numbers and deaths as of July 2020, with detailed statistics for each region.
Market Analysis and Trends
Healthcare & Pharmaceuticals
Provides an overview of global COVID-19 cases and deaths, highlighting significant data points and trends as of July 2020, useful for understanding the pandemic’s international impact at that time.
COVID-19, global, cases, deaths, 2020
false
Market Analysis and Trends
Healthcare & Pharmaceuticals
Graphic
McKinsey
Add to my slides
Remove from favorites
Multiple small graphs displaying the effect of various government actions on COVID-19 case growth rates across different countries, using a day-by-day comparison.
Regulatory and Compliance
Government & Public Sector
Assesses the impact of measures like school closures and travel restrictions on the COVID-19 spread, useful for policymakers and public health officials.
COVID-19, government response, public health, measures, effectiveness, policy, case reduction, spread, actions
false
Regulatory and Compliance
Government & Public Sector
Multiple Chart
BCG
Add to my slides
Remove from favorites
The slide presents a table with percentages showing alternative sites of care hospitals will invest in, such as diagnostic imaging centers and rural health clinics, across various countries.
Strategic Planning
Healthcare & Pharmaceuticals
The slide discusses the shift in hospital investment priorities post-COVID-19, with a focus on diagnostic imaging centers, rural health clinics, and skilled nursing facilities across different countries, reflecting changing healthcare dynamics.
COVID-19, hospital priorities, investment, care sites, global
false
Strategic Planning
Healthcare & Pharmaceuticals
Table
LEK
Add to my slides
Remove from favorites
The slide displays a combination of icons and column charts in green shades, illustrating the types of shortages (hospital beds, supplies, medical staff) and the utilization of ICU beds in the U.S. during different COVID-19 waves. The design is clear, with direct comparisons between the first and current waves.
Strategic Planning
Healthcare & Pharmaceuticals
Discusses the pressure on hospital systems due to surging COVID-19 cases, showing data on ICU utilization and the types of resource shortages. It serves as an analysis tool to understand the strain on healthcare infrastructure during different pandemic waves.
COVID-19, hospitals, ICU, healthcare, shortages, cases, pressure
false
Strategic Planning
Healthcare & Pharmaceuticals
Mixed Chart
BCG
Add to my slides
Remove from favorites
Previous
Next
You don't have any favorites yet.
Please wait loading your favorites slides...
Create a FREE account to continue browsing
Receive Instant Access to 7,500+ of the internet's best slides
First Name
Last Name
Email
Password
I agree to all
Terms & Privacy Policy
Thank you! Your submission has been received!
Oops! Something went wrong while submitting the form.
Have an account?
Sign in
Upgrade to PRO to Save slides
Advanced Search and Filters
Access to 8,000+ slides
Access to Category Pages
Save/Bookmark Slides
PowerPoint Template Library
(Coming Soon)
Pick a Plan
MONTHLY
$12/month
Billed every month, Cancel anytime.
YEARLY
$9/year
Billed $108 annually, Cancel anytime.
Checkout for $12/month
Checkout for $108/yr
Secured by Stripe | AES-256 bit encryption