My Account
My Slides
Leave Feedback
Login
Logout
Get Started
Browse all Slides
Browse Slides Pro
Create a FREE Account
Instant access to 1,000+ real slides from top companies like McKinsey, BCG, Goldman Sachs, Google and many more!
First Name
Last Name
Email
Password
I agree to all
Terms & Privacy Policy
Thank you! Your submission has been received!
Oops! Something went wrong while submitting the form.
Have an account?
Sign in
Saved Slides
Total No. of slides saved
0
↻ Refresh
✖ Clear all
The slide includes a table, column charts displaying risk-based capital metrics, leverage-based capital metrics, liquidity metrics, and balance sheet data. It's in a blue and gray color scheme.
Financial Performance
Financial Services
This slide provides an in-depth look at a company's capital adequacy and liquidity position over time, detailing various financial metrics such as CET1 capital and liquidity coverage ratio. It is ideal for detailed financial analysis and presentations to stakeholders interested in the financial health of the organization.
Capital, Balance Sheet, Liquidity, Leverage, Metrics, Risk, Financial, CET1, Assets, Liabilities
false
Financial Performance
Financial Services
Multiple Chart
Citigroup
Add to my slides
Remove from favorites
This slide presents a black background with a divided column chart on the left, displaying different levels of capital requirements with associated percentages, and text blocks on the right side outlining strategies related to capital management.
Financial Performance
Financial Services
The slide provides information on capital investment strategies, stressing sustainable growth and return on buybacks. It also discusses target management buffer and minimum capital requirements.
Capital, Buffer, Investment, Dividends, Buybacks, Requirements, Financial, Strategy
false
Financial Performance
Financial Services
Mixed Chart
Goldman Sachs
Add to my slides
Remove from favorites
Displays column charts showing changes in capital metrics like CET1 ratio and leverage ratio, alongside MREL/TLAC requirements with surplus figures.
Performance Metrics and KPIs
Financial Services
Provides an update on the bank's capital position, detailing changes in capital ratios and requirements, key for regulatory compliance and stability assessment.
Capital, CET1 ratio, leverage, compliance
false
Performance Metrics and KPIs
Financial Services
Multiple Chart
Deutsche Bank
Add to my slides
Remove from favorites
The slide presents stacked column charts representing capital movement with labels for dates and financial segments. It uses a color gradient to differentiate segments within the bars.
Financial Performance
Financial Services
This slide shows capital movement within Macquarie Capital over two time points, highlighting changes across different financial sectors like debt and various types of energy investments.
Capital, Investments, Realizations, FX, Debt
false
Financial Performance
Financial Services
Single Chart
Morgan Stanley
Add to my slides
Remove from favorites
The slide features column charts and text. It presents capital and leverage ratios, showing total loss-absorbing capacity and other key financial metrics.
Financial Performance
Financial Services
This slide provides an overview of capital and leverage ratios, including total loss-absorbing capacity, essential for understanding financial stability and regulatory compliance.
Capital, Leverage, Ratios, Financial, Metrics
false
Financial Performance
Financial Services
Multiple Chart
UBS
Add to my slides
Remove from favorites
Column charts for capital metrics, column charts for assets and liabilities, text boxes
Financial Performance
Financial Services
Detailed capital and liquidity metrics, balance sheet overview of a financial firm
Capital, Liquidity, Balance Sheet, Bar Chart, Column Chart, Financials
false
Financial Performance
Financial Services
Multiple Chart
Citigroup
Add to my slides
Remove from favorites
Contains several column charts and tables that provide an overview of capital metrics, liquidity ratios, and balance sheet components.
Regulatory and Compliance
Financial Services
Summarizes key financial ratios and metrics critical for regulatory compliance and financial analysis. Focuses on liquidity, leverage, and capital adequacy, crucial for assessing the institution's stability and adherence to regulatory standards.
Capital, Liquidity, Compliance, Financial, Balance Sheet
false
Regulatory and Compliance
Financial Services
Multiple Chart
Citigroup
Add to my slides
Remove from favorites
Slide with multiple graphs detailing Citigroup's capital metrics, liquidity, and balance sheet summaries as of Q4 2021.
Financial Performance
Financial Services
Offers a comprehensive overview of Citigroup's capital adequacy, liquidity positions, and overall financial health at the end of 2021.
Capital, Liquidity, Financial, Banking, Health
false
Financial Performance
Financial Services
Multiple Chart
Citigroup
Add to my slides
Remove from favorites
This slide includes column charts and a pie chart, providing a visual representation of net profit contributions and income by region. It utilizes a straightforward layout with complementary colors for clarity.
Financial Performance
Financial Services
Analyzes financial contributions and regional income distribution for Macquarie Capital. It conveys financial growth and geographic market influence, useful for discussing strategic regional focus or investment decisions.
Capital, Profit Contribution, Regional Income, Financial Growth, Strategy
false
Financial Performance
Financial Services
Multiple Chart
Goldman Sachs
Add to my slides
Remove from favorites
Slide contains multiple horizontal bars showing percentages of Lloyd’s capital providers by source and location.
Risk Assessment and Management
Financial Services
Discusses the diverse sources of Lloyd's capital, with a focus on the contributions by the Bermudian and UK insurance industries, among others. Highlights unexpected sources.
Capital, Providers, Insurance, International, Sources
false
Risk Assessment and Management
Financial Services
Single Chart
PwC/Strategy&
Add to my slides
Remove from favorites
The slide presents multiple donut charts comparing the return on equity and asset growth across different banking divisions, with textual analysis on the side.
Financial Performance
Financial Services
This slide analyzes the capital allocation and returns on equity across various banking divisions, projecting significant financial growth and detailing the drivers behind these projections, which are essential for understanding strategic financial management within the bank.
Capital, RoTE, Banking Divisions, Growth, Assets
false
Financial Performance
Financial Services
Multiple Chart
Barclays
Add to my slides
Remove from favorites
The slide features a line graph depicting capital deployment and TSR performance, along with bar graphs for dividends.
Financial Performance
Financial Services
This slide presents Booz Allen's financial performance in terms of capital deployment and shareholder dividends. It’s useful for financial reviews and showcasing company growth.
Capital, TSR, Dividends, Performance, Value
false
Financial Performance
Financial Services
Multiple Chart
Booz Allen Hamilton
Add to my slides
Remove from favorites
Column charts showing car-buying intent and timing; segmented by new and used cars
Market Analysis and Trends
Consumer Goods
Analyzes the intent to buy cars among respondents, highlighting trends and timelines for new and used cars
Car-buying, intent, new cars, used cars, trends
false
Market Analysis and Trends
Consumer Goods
Multiple Chart
EY
Add to my slides
Remove from favorites
This slide features bar charts comparing carbon emissions across different regions using both accounting methods. The bar charts are displayed side-by-side, with clear labels and distinct color coding for consumption-based and production-based emissions.
Market Analysis and Trends
Government & Public Sector
The slide compares regional carbon emissions under production-based and consumption-based accounting methods, highlighting the differences in reported emissions. It underscores how consumption-based accounting reveals higher emissions for regions like the US and EU due to their imported goods, advocating for more comprehensive emissions tracking.
Carbon Emissions, Accounting, Regional Comparison, Consumption, Production
false
Market Analysis and Trends
Government & Public Sector
Multiple Chart
EY
Add to my slides
Remove from favorites
This slide includes a text section on the left discussing carbon pricing as a commodity and two column charts on the right. One chart shows trades in CO2 emissions, and the other displays CO2 emissions intensity by region, both with clear color distinctions.
Market Analysis and Trends
Government & Public Sector
It argues for the benefits of treating carbon as a tradable commodity to drive global emissions reduction. The slide presents data on CO2 trades between regions and the carbon intensity of goods production, highlighting how regions can leverage carbon pricing to achieve more significant environmental and economic benefits.
Carbon Pricing, CO2 Emissions, Trades, Commodity, Intensity
false
Market Analysis and Trends
Government & Public Sector
Multiple Chart
EY
Add to my slides
Remove from favorites
The slide is a content slide featuring a combination of text and a large pie chart illustrating the share of global GHG emissions by ETSs in 2022. The background is dark, with highlighted sections for emphasis on key points.
Regulatory and Compliance
Government & Public Sector
It explains the principles of carbon pricing, comparing ETS and carbon taxes, and discusses their implementation challenges and benefits. The slide includes data on the global GHG emissions covered by ETSs and insights into various countries' carbon pricing strategies to foster sustainability and emissions reduction.
Carbon Pricing, ETS, GHG Emissions, Regulatory, Compliance
false
Regulatory and Compliance
Government & Public Sector
Mixed Chart
EY
Add to my slides
Remove from favorites
This slide shows a horizontal bar chart comparing the levelized cost of energy for renewable and conventional energy sources under different carbon pricing scenarios.
Regulatory and Compliance
Energy & Utilities
The slide evaluates the impact of carbon pricing on the cost competitiveness of various energy sources, highlighting the influence of carbon costs on renewable and conventional energy generation.
Carbon Pricing, Energy Costs, LCOE, Regulation, Comparison
false
Regulatory and Compliance
Energy & Utilities
Single Chart
Roland Berger
Add to my slides
Remove from favorites
Features a detailed diagram of the integration of CCS with SMR, listing various options for CO2 capture, their descriptions, maturity, and capture rates.
Technology and Digital Transformation
Energy & Utilities
Explains how combining carbon capture and storage (CCS) with steam methane reforming (SMR) can reduce CO2 emissions, detailing different capture options and efficiencies.
Carbon capture, CCS, SMR, CO2 emissions, production integration
false
Technology and Digital Transformation
Energy & Utilities
Diagram
Kearney
Add to my slides
Remove from favorites
Includes a flow diagram illustrating the CCS value chain, from CO2 capture to transport and storage, with text explanations for each stage.
Regulatory and Compliance
Energy & Utilities
Describes the carbon capture and storage (CCS) process, detailing the stages from capturing CO2 emissions to transporting and storing them, emphasizing abatement technologies.
Carbon capture, storage, CCS, CO2 emissions, value chain
false
Regulatory and Compliance
Energy & Utilities
Linear Flow
Kearney
Add to my slides
Remove from favorites
Features a world map highlighting the top five carbon-emitting countries, using color coding and percentages to show the proportion of emissions each country contributes.
Regulatory and Compliance
Environmental Services & Sustainability
Analyzes the carbon emission contributions of the top five countries, highlighting the significant role of major economies in global emissions. Useful for discussions on international cooperation and policy-making for emission reduction.
Carbon emissions, Countries, Global share, Climate policy
false
Regulatory and Compliance
Environmental Services & Sustainability
Multiple Chart
BCG
Add to my slides
Remove from favorites
The slide features infographics and charts predicting future carbon farming benefits in Maranoa, including additional ACCUs generated, revenue, and supported jobs.
Client Case Studies
Agriculture & Food Production
This slide forecasts the potential future of Maranoa through carbon farming, estimating additional ACCUs generated, revenue growth, and job support from 2021 to 2030. It highlights various carbon farming practices and their economic impact.
Carbon farming, Maranoa, Future projections, Revenue, Jobs
false
Client Case Studies
Agriculture & Food Production
Mixed Chart
EY
Add to my slides
Remove from favorites
Contains multiple line graphs comparing the carbon intensity and emissions per capita for several countries, with projections for 2050 under current policies and ideal targets for a 2°C warming scenario. Each country's trajectory is marked distinctly.
Regulatory and Compliance
Environmental Services & Sustainability
Compares the carbon intensity and emissions per capita of key countries, projecting their future paths and comparing them to the required levels for meeting the 2°C warming limit. Highlights disparities in emissions intensity and the challenges different countries face in achieving climate goals.
Carbon intensity, Emissions, GDP, 2050, Country comparison
false
Regulatory and Compliance
Environmental Services & Sustainability
Single Chart
BCG
Add to my slides
Remove from favorites
The slide presents a diagram categorizing different carbon separation technologies. It uses a hierarchical structure with boxes and arrows, featuring both text and colored elements.
Technology and Digital Transformation
Energy & Utilities
The slide categorizes various CO₂ separation technologies, detailing methods like absorption, adsorption, membranes, liquid/supercritical CO₂, and novel technologies.
Carbon separation, absorption, adsorption, membranes, CO₂ technologies, energy, utilities, chemical processes
false
Technology and Digital Transformation
Energy & Utilities
Diagram
Kearney
Add to my slides
Remove from favorites
Contains detailed text definitions and an infographic explaining carbon credits and offsets, including creation and use.
Regulatory and Compliance
Environmental Services & Sustainability
Defines carbon credits as instruments for avoided or removed CO2 emissions, explaining their creation through offset projects and usage in emission reductions.
Carbon, credit, offset, definition, regulation, compliance, CO2, emissions, reduction
false
Regulatory and Compliance
Environmental Services & Sustainability
Diagram
EY
Add to my slides
Remove from favorites
The slide combines text with an image and a line chart. The line chart shows projected carbon credit prices from 2020 to 2050 under different scenarios.
Strategic Planning
Environmental Services & Sustainability
It discusses the rising demand and costs for carbon credits by 2035, projecting prices to be between US$80-$150 per tonne. Emphasizes the importance of high-quality credits.
Carbon, credit, price, forecast, demand, 2035, scenario, cost, sustainability
false
Strategic Planning
Environmental Services & Sustainability
Mixed Chart
EY
Add to my slides
Remove from favorites
This slide includes a collection of bar graphs, column charts, and key metric callouts arranged in a clean layout, with contrasting colors to highlight different data sets.
Financial Performance
Financial Services
Focused on the card franchise's industry leadership, the slide provides data on card sales, active accounts, and customer retention. Key figures show growth in sales volume and a sustained number 1 position in card outstandings.
Card Franchise, Industry Leadership, Sales Volume, Customer Retention, Financial Data
false
Financial Performance
Financial Services
Multiple Chart
JP Morgan
Add to my slides
Remove from favorites
Features a split layout with half dedicated to card highlights including photos and logos, and the other half displaying line graphs comparing market performance. The design is sleek with a corporate color scheme.
Product and Service Analysis
Financial Services
Showcasing ongoing efforts to innovate in card products, the slide highlights new launches and market performance data. It notes the success in sales share and outstandings share, suggesting strong market engagement and strategic partnerships.
Card Products, Market Performance, Product Launch, Strategic Partnerships, Engagement
false
Product and Service Analysis
Financial Services
Multiple Chart
JP Morgan
Add to my slides
Remove from favorites
A combination of cycle diagrams and column charts, this slide showcases financial growth metrics, such as sales volume and net revenue. It's visually balanced with clear demarcations between different sections and graphical elements.
Financial Performance
Financial Services
The slide describes the growth strategy and financial performance of a card franchise, with a focus on scaling, engaging, and deepening customer relationships. It’s intended for illustrating successful financial strategies and growth patterns within the industry.
Card franchise, Industry position, Sales volume, Net revenue, Financial growth, Strategy implementation
false
Financial Performance
Financial Services
Multiple Chart
JP Morgan
Add to my slides
Remove from favorites
Displays a column chart showing growth in card revenue driven by lending, with a list of innovative strategies and products to the right.
Financial Performance
Financial Services
Illustrates the trend in card revenue growth at JPMorgan Chase, emphasizing innovation and customer borrowing needs.
Card revenue, lending, innovation, JPMorgan Chase, borrowing needs
false
Financial Performance
Financial Services
Mixed Chart
JP Morgan
Add to my slides
Remove from favorites
Displays rankings of proprietary card products, key partners logos, and column charts detailing purchase sales and EOP loans growth. Dominant colors are blue and grey.
Sales and Business Development
Financial Services
Discusses the leading positions of card products, showcases strategic partnerships, and presents growth data for purchase sales and EOP loans.
Cards, Partnerships, Growth, Rankings, No Fee, Cash Back, Retail Services
false
Sales and Business Development
Financial Services
Multiple Chart
Citigroup
Add to my slides
Remove from favorites
The slide includes text explanations and a column chart showing areas where Gen Zs and Millennials feel they can influence their organization. The layout is balanced with text on the left and charts on the right.
Human Resources and Talent Management
Education & Training
The slide highlights the importance of values in career decisions for Gen Zs and Millennials, detailing areas where they feel empowered to influence organizational changes, including social issues, DEI, personal development, and sustainability efforts.
Career decisions, values, empowerment, Gen Z, Millennials, change
false
Human Resources and Talent Management
Education & Training
Mixed Chart
Deloitte
Add to my slides
Remove from favorites
The slide is divided into two vertical sections with headers in dark blue. Each section has a thematic icon and contains text blocks describing company case studies. Page number is at the bottom right.
Client Case Studies
Financial Services
This slide presents two case studies related to sustainable finance: one focusing on clean energy through a partnership with BlocPower, and the other on community empowerment with the National Urban League. The slide details the company's contributions and solutions, such as providing equity and debt financing, and is suitable for demonstrating the impact and scope of the presenter's sustainable finance initiatives in real-world applications.
Case Studies, Clean Energy, Community, Finance, Equity, Debt, Empowerment, Sustainability
false
Client Case Studies
Financial Services
Table
Goldman Sachs
Add to my slides
Remove from favorites
Features logos of Athena, Chase.com, and ServiceNow with bullet points outlining improvements and efficiencies gained in each case. It highlights specific achievements such as cost reductions, enhanced customer support, and platform optimizations.
Technology and Digital Transformation
Technology & Software
Showcases technology-driven operational enhancements and cost efficiency improvements through three distinct case studies.
Case Study, Digital Strategy, Capacity, Performance, Cost Savings, Technology Platforms, Financial Services, Cloud-Native, Automation
false
Technology and Digital Transformation
Technology & Software
Pillar
JP Morgan
Add to my slides
Remove from favorites
A dark-themed slide split into two halves, one detailing businesses involved, the other outlining solutions provided by the firm, complemented by a client testimonial.
Mergers and Acquisitions
Financial Services
A case study slide showcasing how the firm’s integrated solutions across various departments contributed to a client's success story.
Case Study, Solutions, Wealth, Investment, Asset, Management, Client, Testimonial
false
Mergers and Acquisitions
Financial Services
Table
Goldman Sachs
Add to my slides
Remove from favorites
Logos and brief case studies of companies using AR in operations, including icons representing each industry.
Technology and Digital Transformation
Technology & Software
Highlights companies in different sectors that have leveraged AR for improvements in sales, training, manufacturing efficiency, and operational time.
Case studies, AR, sales, training, efficiency, innovation
false
Technology and Digital Transformation
Technology & Software
Header Vertical
McKinsey
Add to my slides
Remove from favorites
Case studies of companies that have leveraged ML for significant operational improvements, with stats on impacts.
Technology and Digital Transformation
Technology & Software
Profiles the transformative impact of ML in three different companies, showing improvements in efficiency and operations.
Case study, ML, impact, efficiency, operational improvements
false
Technology and Digital Transformation
Technology & Software
Linear Flow
McKinsey
Add to my slides
Remove from favorites
The slide shows a column chart displaying the growth in Global Alternatives AUM with predictions up to 2027, complemented by bullet points discussing industry dynamics on the side. The color blue is used to represent data points effectively against the dark background.
Client Case Studies
Financial Services
Highlights a case study on the collaboration between global banking and market sectors to show growth opportunities, suitable for illustrating market expansion and client base growth.
Case study, banking, market growth
false
Client Case Studies
Financial Services
Mixed Chart
Goldman Sachs
Add to my slides
Remove from favorites
Contains column charts comparing caseloads, with a focus on color contrasts between red, brown, and beige to highlight differences among locations.
Regulatory and Compliance
Government & Public Sector
Presents a comparative analysis of the caseloads in different court locations and the trend in the number of case finalizations.
Caseload, courts, family law, applications, finalizations, judicial system, comparative analysis, trend
false
Regulatory and Compliance
Government & Public Sector
Multiple Chart
PwC/Strategy&
Add to my slides
Remove from favorites
An advanced slide featuring a column chart detailing the end-of-period notional value of cash flow hedges. The graph uses different shades to distinguish between floors, forward starting swaps, and existing swaps. Below the graph, a legend explains the colors used, and text boxes provide further information about swap protection and weighted average receive-fix rate. The design is simple and focuses on presenting the financial data clearly.
Risk Assessment and Management
Financial Services
The slide offers an overview of the company’s cash flow hedges strategy to protect net interest margin (NIM). It details the swap protection plans and their impact on financial stability, aiming to communicate to stakeholders the steps taken for risk mitigation in fluctuating interest rate environments.
Cash Flow Hedges, Net Interest Margin, Risk Mitigation, Financial Strategy, Swap Protection, Interest Rates, Financial Planning
false
Risk Assessment and Management
Financial Services
Single Chart
Morgan Stanley
Add to my slides
Remove from favorites
The slide presents three interconnected 3D blocks in purple, highlighting key financial strategies: Dividend Growth, Share Repurchases, and Strong Cash Flow. Text overlays provide specific financial metrics and growth rates.
Financial Performance
Financial Services
Focuses on illustrating a company's financial strategy emphasizing dividend growth, share repurchases, and strong cash flow. Useful in analyzing financial health and strategic fiscal management.
Cash flow, Dividend, Share repurchases, CAGR, FCF
false
Financial Performance
Financial Services
Framework
Accenture
Add to my slides
Remove from favorites
Column chart depicting cash flow improvement activities with bar lengths showing impact percentage, and pie charts indicating short-term and medium-term impact.
Financial Performance
Transportation & Logistics
This slide presents key cash flow improvement activities and their respective impacts on short and medium terms for medium cost control automotive manufacturing companies.
Cash flow, improvements, activities, short-term, medium-term, column chart, pie chart
false
Financial Performance
Transportation & Logistics
Single Chart
EY
Add to my slides
Remove from favorites
This slide contains a column chart, representing different financial components, labeled from 1 to 5, in varying heights with different shades of blue. A key explains the elements as Cash & Cash Equivalents, Increase, and Decrease. Below the chart is an explanatory key with detailed notes.
Financial Performance
Financial Services
The slide is used for financial planning, depicting various stages such as current cash and equivalents, cash inflow from business operations, joint venture redemption, debt repayment, and expected funds for future investments. It's for presenting financial status and future funding strategies to stakeholders or investors.
Cash, EBITDA, Leverage, Investment, Growth, Finance, Redemption, Repayment, Liquidity, Planning
false
Financial Performance
Financial Services
Single Chart
Goldman Sachs
Add to my slides
Remove from favorites
Features column charts detailing reserve releases and underlying reserve volatility for casualty insurance.
Risk Assessment and Management
Financial Services
Details the volatility in reserve releases for casualty at Lloyd's, highlighting specific lines such as General Liability and Directors & Officers insurance, with a focus on significant reserve changes.
Casualty, Reserves, Insurance, Volatility, Changes
false
Risk Assessment and Management
Financial Services
Multiple Chart
PwC/Strategy&
Add to my slides
Remove from favorites
The slide shows a line chart comparing cement import volumes in Australia, the US, and France, with a table summarizing import penetration rates.
Market Analysis and Trends
Industrial & Manufacturing
Examines the differences in cement import reliance between Australia, the US, and France. Highlights import growth trends and provides context on market reliance and supply chain factors.
Cement imports, Australia, US, France, market analysis
false
Market Analysis and Trends
Industrial & Manufacturing
Mixed Chart
LEK
Add to my slides
Remove from favorites
Displays a column chart showing cement and clinker import sources for Australia, the US, and France, along with a table of top import countries.
Market Analysis and Trends
Industrial & Manufacturing
Analyzes the sources of cement and clinker imports for Australia, the US, and France. Provides insights into regional dependencies and major import partners.
Cement imports, clinker, US, France, Australia
false
Market Analysis and Trends
Industrial & Manufacturing
Mixed Chart
LEK
Add to my slides
Remove from favorites
The slide features a flow diagram illustrating the concrete manufacturing process from raw materials to the finished product. Each stage is accompanied by relevant images and descriptive text, with a clear visual hierarchy.
Industry Overview
Industrial & Manufacturing
Describes the process of cement production, highlighting the stages from limestone and clay to concrete. Explains the importance of clinker and the industry's move towards more sustainable practices.
Cement, clinker, concrete, manufacturing, sustainability
false
Industry Overview
Industrial & Manufacturing
Linear Flow
LEK
Add to my slides
Remove from favorites
This slide contains a column chart showing cement production and imports over time, along with bullet points summarizing key trends and statistics.
Market Analysis and Trends
Industrial & Manufacturing
Provides an analysis of the Australian cement industry's reliance on imports. Highlights trends in production and import levels, the impact of infrastructure projects, and future market growth projections.
Cement, imports, production, market trends, Australia
false
Market Analysis and Trends
Industrial & Manufacturing
Mixed Chart
LEK
Add to my slides
Remove from favorites
The slide includes a column chart displaying the ratio of direct to distributed traffic according to an alternative central approach, which considers any source within the last 5 steps and excludes subsequent visits. Detailed annotations included.
Market Analysis and Trends
Media & Entertainment
This slide explores the ratio of direct to distributed traffic using an alternative central approach, considering any source within the last 5 steps before reaching news articles and excluding subsequent visits, providing insights into traffic patterns.
Central Approach, Direct Traffic, Distributed Traffic, Column Chart, Traffic Ratio
false
Market Analysis and Trends
Media & Entertainment
Single Chart
IPSOS
Add to my slides
Remove from favorites
The slide portrays two line graphs, one depicting the mean and the other the median of central bank balance sheets relative to GDP, spanning over a century. The graphs show an increasing trend, particularly in recent years. The title, subtitle, and quote from the US Federal Reserve are also present.
Regulatory and Compliance
Financial Services
The slide examines central bank balance sheet trends and discusses the innovations in quantitative easing (QE) and Flexible Average Inflation Targeting (FAIT). It can serve to explain modern monetary policy tools and strategies, especially in response to economic crises.
Central Banks, Balance Sheets, GDP, Quantitative Easing, Inflation Targeting, Monetary Policy, Trends
false
Regulatory and Compliance
Financial Services
Single Chart
JP Morgan
Add to my slides
Remove from favorites
The slide features a line chart plotting future expectations for central bank policy rates across the US, Eurozone, UK, and Japan. It has a white background with minimal distractions.
Investment Analysis
Financial Services
The slide offers a predictive analysis of central bank policy rates for key economies, likely aiding investors and financial planners in strategizing future investments and understanding the macroeconomic landscape influenced by central bank decisions.
Central Banks, Policy Rates, Predictive, US, Eurozone, UK, Japan, Finance
false
Investment Analysis
Financial Services
Single Chart
JP Morgan
Add to my slides
Remove from favorites
Showcases an oversized percentage figure emphasizing workforce planning, a pie chart on changes in business costs, and a column chart for perspectives on economic policy.
Operational Efficiency
Financial Services
Assesses ongoing business challenges like cost management and headcount planning, considering economic conditions and the corresponding fiscal policy stance from the Federal Reserve’s viewpoint.
Challenges, Costs, Workforce, Federal Reserve
false
Operational Efficiency
Financial Services
Multiple Chart
JP Morgan
Add to my slides
Remove from favorites
The slide contains horizontal bar charts in a yellow background. It discusses challenges in food value chain partnerships.
Strategic Planning
Agriculture & Food Production
Highlights top challenges in establishing partnerships within the food value chain ecosystem, including network access and data sharing. Useful for strategic planning in sustainability and agriculture.
Challenges, Partnerships, Food Value Chain, Strategic Planning, Ecosystem
false
Strategic Planning
Agriculture & Food Production
Mixed Chart
Deloitte
Add to my slides
Remove from favorites
Simplified flowchart with three main phases of change management: Installation, Realization, and Repeatability. Highlights key challenges at each stage with corresponding icons.
Organizational Structure and Change
Professional Services
Highlights the difficulties in achieving successful change management in organizations, focusing on the stages from strategy deployment to embedding new capabilities, and the common stalling points.
Change Management, Challenges, Organization, Strategy
false
Organizational Structure and Change
Professional Services
Linear Flow
Kearney
Add to my slides
Remove from favorites
The slide presents a bar chart with arrows indicating percentage changes, focusing on practices like dedicating time to change management. It uses purple tones to differentiate total enterprise reinventors from transformers and optimizers.
Strategic Planning
Professional Services
Discusses the significance of communication in organizational change, focusing on the allocation of time, leadership communication, and skilling for effective delivery. The slide is a tool for analyzing the human aspects of organizational transformation and change management.
Change Management, Organizational Change, Leadership Communication, Skilling, Reinvention, Human Factors, Engagement Practices, Delivery Strategies
false
Strategic Planning
Professional Services
Multiple Chart
Accenture
Add to my slides
Remove from favorites
The slide shows a line chart with four different colored dotted lines labeled as Technology, Individuals, Businesses, Public Policy. Each line shows an upward trend over time from the 1970s to today.
Market Analysis and Trends
Technology & Software
This slide depicts the varying rates of change and adoption in technology, individuals, businesses, and public policy over the years, illustrating how the future is unequally distributed. It could be used to discuss technology adoption patterns.
Change, Adoption, Technology, Policy, Trends
false
Market Analysis and Trends
Technology & Software
Single Chart
Deloitte
Add to my slides
Remove from favorites
A mix of text and illustrative graphics depicting seamless integration of sales channels with customer-first view and adaptive strategies, including examples.
Strategic Planning
Professional Services
Urges a customer-first approach in channel strategy, focusing on integrated experiences and continual experimentation for cross-channel success.
Channel Strategy, Customer Experience, Cross-Channel Integration, Seamless Experience
true
Strategic Planning
Professional Services
Header Horizontal
BCG
Add to my slides
Remove from favorites
Line chart showing the year-over-year growth of global personal luxury goods by channel from 2017 to 2023.
Strategic Planning
Consumer Goods
Examines the normalization of channel dynamics post-pandemic, focusing on retail, wholesale, and e-commerce.
Channel, Dynamics, Post-pandemic, Growth, Luxury
false
Strategic Planning
Consumer Goods
Mixed Chart
Kearney
Add to my slides
Remove from favorites
A mixed chart showing the short- and long-term impacts of various marketing channels. The chart uses bars and lines to depict the effectiveness of channels like TV, social media, and print in driving sales and brand awareness.
Market Analysis and Trends
Media & Entertainment
This slide analyzes the effectiveness of different marketing channels in driving both short-term sales and long-term brand awareness. It highlights the impact of channels like TV, social media, and print on overall marketing effectiveness.
Channels, Impact, Marketing, Effectiveness, Sales
false
Market Analysis and Trends
Media & Entertainment
Mixed Chart
Nielsen
Add to my slides
Remove from favorites
A column chart showing the percentage of respondents in various countries who see the lack of charging stations as a primary concern for not considering EVs.
Market Analysis and Trends
Transportation & Logistics
This slide demonstrates the global concern over inadequate charging infrastructure, affecting consumer decisions against purchasing electric vehicles.
Charging stations, EV adoption, infrastructure, consumer concerns, global comparison
false
Market Analysis and Trends
Transportation & Logistics
Single Chart
EY
Add to my slides
Remove from favorites
Shows an iPhone screen displaying the Chase Offers℠ app interface and a circular diagram explaining the engagement cycle with four numbered points. The design is simple with a focus on the app and the cycle.
Client Case Studies
Financial Services
Discusses the success of the Chase Offers℠ program in its initial months, focusing on customer and merchant engagement and the benefits realized through this strategy.
Chase Offers, customer engagement, marketing strategy, merchant benefits, early success
false
Client Case Studies
Financial Services
Linear Flow
JP Morgan
Add to my slides
Remove from favorites
The slide features text, percentage data, and column charts showing the development of ChatGPT policies and discussions on generative AI risks at the executive level.
Regulatory and Compliance
Technology & Software
This slide discusses the development of acceptable use policies for ChatGPT and the board-level discussions on generative AI risks, including percentages of organizations with policies in place.
ChatGPT, Policies, IT Leaders, Generative AI, Risk Management
false
Regulatory and Compliance
Technology & Software
Multiple Chart
Gartner
Add to my slides
Remove from favorites
The slide has a title at the top, text in the middle, and a column chart at the bottom showing changes made to manage child or caring responsibilities since the start of the crisis.
Operational Efficiency
Professional Services
Illustrates changes made to manage child or caring responsibilities during the crisis, with 1 in 5 making changes. Details include changing working patterns and seeking external help.
Childcare, Crisis, Survey, Responsibilities, Data
false
Operational Efficiency
Professional Services
Single Chart
IPSOS
Add to my slides
Remove from favorites
Pie chart illustrating the proportion of respondents saving for children's education pre-COVID-19, during, and the continuation post-pandemic. Dense text at the top explains the context.
Market Analysis and Trends
Financial Services
The slide shows the percentage of Canadian investors saving for their children's education before and during the COVID-19 pandemic. It indicates that a significant majority continued to save for this goal even during the pandemic.
Children's Education, Savings, COVID-19, Canadian, Pandemic
false
Market Analysis and Trends
Financial Services
Multiple Chart
IPSOS
Add to my slides
Remove from favorites
This slide features a bar chart showing the types of information parents sought in the past year related to children's development, such as nutrition and health.
Market Analysis and Trends
Education & Training
It shows that parents primarily sought information on nutrition, vaccination, and health for their children, indicating these areas are of most concern.
Children's development, information, parents, bar chart, public opinion, Ipsos, education, nutrition, health
false
Market Analysis and Trends
Education & Training
Single Chart
IPSOS
Add to my slides
Remove from favorites
The slide presents a bar chart listing various sources from which parents sought help for children's social and emotional development, such as the NHS website and family.
Market Analysis and Trends
Education & Training
It highlights that parents relied on a variety of sources for support in their children's social and emotional development, with the NHS website being the most common source.
Children's development, social, emotional, sources, bar chart, public opinion, Ipsos, education, support
false
Market Analysis and Trends
Education & Training
Single Chart
IPSOS
Add to my slides
Remove from favorites
Slide contains three column charts analyzing generation cost, electrolyzer utilization, and transmission for optimizing green hydrogen production in Chile.
Market Analysis and Trends
Energy & Utilities
Analyzes three cost factors essential for optimizing green hydrogen production in Chile, focusing on generation location, technology, and transmission costs.
Chile, green hydrogen, cost optimization, generation, transmission, electrolyzer
false
Market Analysis and Trends
Energy & Utilities
Pillar
McKinsey
Add to my slides
Remove from favorites
Features a line graph showing the projected levelized cost of energy for green hydrogen across three macro-zones in Chile until 2025.
Market Analysis and Trends
Energy & Utilities
Projects the decreasing costs of green hydrogen production in Chile's northern and southern zones, highlighting the competitive and uncompetitive regions.
Chile, hydrogen, cost analysis, LCOE, competitive zones, 2020-2025
false
Market Analysis and Trends
Energy & Utilities
Mixed Chart
McKinsey
Add to my slides
Remove from favorites
Bar chart comparing 2030 green hydrogen production costs across six regions, emphasizing Chile's low costs relative to other global regions.
Market Analysis and Trends
Energy & Utilities
Compares the cost of producing green hydrogen in Chile with other regions by 2030, showcasing Chile's cost advantage.
Chile, hydrogen, cost comparison, 2030, global regions, production costs
false
Market Analysis and Trends
Energy & Utilities
Multiple Chart
McKinsey
Add to my slides
Remove from favorites
Bar chart detailing the forecasted reduction in green hydrogen production costs by 2035, broken down by factors like power generation and electrolyzer efficiency.
Investment Analysis
Energy & Utilities
Forecasts significant cost reductions in green hydrogen production in Chile by 2035, focusing on power generation, electrolyzer capex, and efficiency improvements.
Chile, hydrogen, cost reduction, 2035, electrolyzer, power generation
false
Investment Analysis
Energy & Utilities
Mixed Chart
McKinsey
Add to my slides
Remove from favorites
This slide features two column layout with labels "Top 5" and "Top 3" and text blocks explaining targets for 2025 and 2030 in terms of GW. A map of Chile highlights northern and southern hydrogen valleys.
Industry Overview
Energy & Utilities
The slide outlines Chile's aspirations to be among the top global producers and exporters of green hydrogen by 2025 and 2030, with specific GW capacity targets. Also indicates geographic areas of development.
Chile, hydrogen, exporters, 2025, 2030
false
Industry Overview
Energy & Utilities
Graphic
McKinsey
Add to my slides
Remove from favorites
Comparative layout with two line graphs, contrasting property sales with GDP growth and manufacturing PMI with business confidence. Heavy on data and annotations.
Market Analysis and Trends
Industrial & Manufacturing
Presents China's economic outlook by examining property sector trends and manufacturing confidence, relevant for market analysis and investment decisions.
China Economy, Property Sales, GDP Growth, Manufacturing PMI, Market Analysis, Investment Decision
false
Market Analysis and Trends
Industrial & Manufacturing
Multiple Chart
Citigroup
Add to my slides
Remove from favorites
This slide features multiple column charts and tables comparing IPO activities in the Shanghai, Shenzhen, Beijing, and Hong Kong stock exchanges.
Market Analysis and Trends
Financial Services
The slide highlights the IPO market performance in Mainland China and Hong Kong, showing data on the number of IPOs and proceeds, along with the top sectors for each stock exchange.
China IPO market, Hong Kong IPOs, stock exchanges, financial trends, sector analysis
false
Market Analysis and Trends
Financial Services
Multiple Chart
EY
Add to my slides
Remove from favorites
The slide contains column charts and tables detailing IPO activities across Mainland China and Hong Kong stock exchanges. It includes sector-specific data and changes from 2021.
Market Analysis and Trends
Financial Services
This slide provides a detailed analysis of IPO market highlights in Mainland China and Hong Kong for 2022, showcasing sector performance, market changes, and key data on IPO numbers and proceeds.
China IPO, Hong Kong, stock exchange, sector, 2022
false
Market Analysis and Trends
Financial Services
Multiple Chart
EY
Add to my slides
Remove from favorites
A split-slide; one side discusses China/Asia's reopening with a line graph, and the other focuses on ESG rates of change driving alpha, supported by a bar graph. Analyst credits and report links are provided.
Market Analysis and Trends
Financial Services
It outlines the economic outlook for China/Asia as they reopen and discusses the impact of ESG rate changes on investment alpha, signaling strategic considerations for investors.
China, Asia, market opening, ESG, investment alpha, economic outlook, strategic investment, market analysis, policy changes, investor interest
false
Market Analysis and Trends
Financial Services
Multiple Chart
Morgan Stanley
Add to my slides
Remove from favorites
The slide contains sets of column charts for three years and text annotations. It also includes a line graph overlaid on the charts.
Market Analysis and Trends
Financial Services
This slide evaluates the shift in market focus by CEOs in China, specifically their reduced preference for the US market. It could be used to discuss changes in international business strategies and economic forecasts.
China, CEOs, Market Focus, US, Growth Ambitions, Trends, Economic Strategy
false
Market Analysis and Trends
Financial Services
Multiple Chart
PwC/Strategy&
Add to my slides
Remove from favorites
The slide is divided into two main sections with a column chart and descriptive text. The upper section has a headline with a subtitle and a large column chart showing China’s market share by battery value chain segment. The lower section contains a description of China’s policies in smaller text with bullet points, illustrating policy details.
Market Analysis and Trends
Transportation & Logistics
This slide illustrates China's dominance in the electric vehicle (EV) battery value chain, supported by significant government subsidies and a certification scheme that favors local firms. It provides insights into China’s market strategy and its effects on global competition in the EV sector.
China, EV battery, market share, subsidies, certification, global competition, strategic planning, industry dominance, value chain, local firms
false
Market Analysis and Trends
Transportation & Logistics
Mixed Chart
Accenture
Add to my slides
Remove from favorites
Column charts depict China’s GDP growth rates across quarters for two years, highlighting expected growth due to policy changes.
Market Analysis and Trends
Transportation & Logistics
Analyzes the impact of China's economic policies and COVID-19 policy reversals on its GDP growth, with implications for global trade.
China, GDP growth, economic policy, COVID-19, global trade
false
Market Analysis and Trends
Transportation & Logistics
Mixed Chart
Deutsche Bank
Add to my slides
Remove from favorites
The slide includes three line charts showing China's y/y real GDP, unemployment rate, and y/y CPI from 2005 to 2025, with explanatory text.
Market Analysis and Trends
Financial Services
Analyzes China's economic challenges and prospects, including structural and cyclical factors affecting GDP, employment, and inflation.
China, GDP, Unemployment, CPI, Structural Headwinds
false
Market Analysis and Trends
Financial Services
Multiple Chart
EY
Add to my slides
Remove from favorites
Three line charts illustrating China's y/y real GDP, unemployment rate, and y/y percentage change in CPI from 2005-25F. Moderate complexity, suitable for detailed economic analysis and forecasting.
Market Analysis and Trends
Financial Services
The slide forecasts China's economic growth, addressing challenges in the industrial sector, high savings rates, and export weakness. It discusses GDP trends, unemployment, and inflation projections, highlighting factors impacting growth.
China, GDP, unemployment, CPI, growth
false
Market Analysis and Trends
Financial Services
Multiple Chart
EY
Add to my slides
Remove from favorites
The slide shows line graphs comparing official and alternative measures of industrial production growth in China. The use of contrasting colors helps distinguish between the two data series.
Market Analysis and Trends
Industrial & Manufacturing
Provides an analysis of industrial production growth in China, contrasting official data with alternative sources. Useful for understanding the real economic situation in China and for investment or policy-making decisions.
China, Industrial Production, Economic Analysis, Growth, Data Sources
false
Market Analysis and Trends
Industrial & Manufacturing
Single Chart
Deutsche Bank
Add to my slides
Remove from favorites
The layout includes a bar graph labeled "FIGURE 5", textual analysis on the left, and quotes pertaining to the role of AI in skill development.
Market Analysis and Trends
Technology & Software
Focusing on China, the slide projects the future of work roles from 2017 to 2028, addressing the dominant employment sectors and the impact of automation on labor distribution.
China, Labor, Automation, Skills, Future
false
Market Analysis and Trends
Technology & Software
Mixed Chart
Accenture
Add to my slides
Remove from favorites
Slide presents column charts and bullet points. The charts display luxury market projections for 2017 and 2025, emphasizing Chinese consumption. Red and gray colors differentiate data.
Market Analysis and Trends
Retail & E-commerce
This slide analyzes the future growth trends in the luxury goods market, focusing particularly on China's role. It highlights domestic versus international spending in the context of overall market growth.
China, Luxury Market, Growth, Consumption, Projections
false
Market Analysis and Trends
Retail & E-commerce
Multiple Chart
Bain
Add to my slides
Remove from favorites
The slide uses a color scheme with gray and purple, featuring a centralized graphic representing China’s technology goals and four numbered segments with icons and brief descriptions around it. It contains moderate text and data visualizations like charts or graphs are not present.
Industry Overview
Technology & Software
This slide presents China's strategic focus in technology as outlined in their 14th Five-Year Plan, highlighting key imperatives to become a global digital powerhouse within the next five years. It breaks down the plan into four main objectives such as investment in digital infrastructure and enhancing education quality, aimed at fostering international collaboration and maintaining a policy of openness.
China, Technology, Five-Year Plan, Digital Powerhouse, Infrastructure, Education, Collaboration, Policy, Global Leader, Investment
false
Industry Overview
Technology & Software
Single Chart
Kearney
Add to my slides
Remove from favorites
This slide presents two column charts and a line chart detailing China's labor force, export percentage, and consumer spending.
Market Analysis and Trends
Consumer Goods
Discusses China's changing economic landscape with a focus on shifting labor demographics and increasing consumer expenditures.
China, consumer spending, labor force, economic trends, exports
false
Market Analysis and Trends
Consumer Goods
Multiple Chart
Deutsche Bank
Add to my slides
Remove from favorites
Includes a line and column chart. The line chart tracks China's Manufacturing and Non-Manufacturing PMI, and the bar graph details monthly gambling revenues in Macau, indicating economic health and consumer behavior.
Market Analysis and Trends
Financial Services
Highlights China's economic strategies and outcomes in 2021, focusing on sectors like manufacturing and consumer spending. The slide provides insights into how policy shifts and economic activities influence broader economic stability and growth forecasts.
China, economic policy, PMI, consumer spending, economic growth
false
Market Analysis and Trends
Financial Services
Multiple Chart
Deloitte
Add to my slides
Remove from favorites
Red line and bar graph against a white background, showing China's cases per day and total reported cases, with key event markers.
Risk Assessment and Management
Healthcare & Pharmaceuticals
Outlines China's response to COVID-19 with lockdowns and testing, highlighting the timeline of cases and government actions.
China, lockdowns, testing, COVID-19, government response
false
Risk Assessment and Management
Healthcare & Pharmaceuticals
Single Chart
McKinsey
Add to my slides
Remove from favorites
This slide is focused on the Chinese luxury goods market, featuring a column chart that track consumption growth from 2012 to 2017, compared to non-Chinese markets. It uses contrasting colors like red for China and gray for other markets, effectively highlighting the differences in growth rates.
Market Analysis and Trends
Consumer Goods
Highlights the booming luxury goods consumption in China, contrasting it with more moderate growth in other global markets. Details the impact of increased consumer confidence and economic factors in China, while providing a broader view of global market trends.
China, luxury goods, market growth, consumer behavior, global comparison
false
Market Analysis and Trends
Consumer Goods
Single Chart
Bain
Add to my slides
Remove from favorites
A combination of timeline, infographic elements, and key investment figures related to the company's history and activities in China, arranged neatly with icons and bullet points.
Strategic Planning
Financial Services
Analyzes the company’s long-term involvement in China and outlines strategies for capitalizing on the developing market, emphasizing the potential for growth and investment.
China, market expansion, investments, development, strategy
false
Strategic Planning
Financial Services
Table
Goldman Sachs
Add to my slides
Remove from favorites
The slide includes a large image of the Chinese flag on the left, with text and a line graph on the right showing Chinese quarterly GDP growth rate. The layout is visually striking and data-focused.
Competitive Landscape
Industrial & Manufacturing
The slide outlines Ipsos' market strength in China, noting stability during COVID-19, the acquisition of Shanghai Focus RX, and the rebounding GDP growth in 2023.
China, market leader, GDP growth, acquisition, stability
false
Competitive Landscape
Industrial & Manufacturing
Mixed Chart
IPSOS
Add to my slides
Remove from favorites
The slide features multiple column charts comparing China's recovery rates in various sectors to global rates. It includes categories like consumer products, fashion, energy, and travel. Background images correspond to each category.
Market Analysis and Trends
Financial Services
This slide shows China's recovery in various industries post-2021 compared to the world, focusing on sales growth and travel occupancy. Used for analyzing economic resilience and recovery trends.
China, recovery, consumer products, fashion, energy, tourism, sales growth, global comparison
false
Market Analysis and Trends
Financial Services
Table
BCG
Add to my slides
Remove from favorites
The slide shows a line chart projecting China's future scrap supply and demand, with various scenarios outlined.
Strategic Planning
Industrial & Manufacturing
The slide projects future scenarios for China's scrap supply and demand by 2025, exploring potential industry developments and strategic considerations.
China, scrap, supply, demand, 2025, bar chart, column chart
false
Strategic Planning
Industrial & Manufacturing
Single Chart
McKinsey
Add to my slides
Remove from favorites
Slide uses icons, arrows, and column charts to visualize the growth in Chinese spending on luxury goods from 2015 to 2018, both locally and abroad.
Financial Performance
Retail & E-commerce
Discusses the significant impact of local and international spending by Chinese consumers on the luxury goods market over three years, highlighting the doubling of local spending.
Chinese Market, Spending Growth, Local, International
false
Financial Performance
Retail & E-commerce
Mixed Chart
Bain
Add to my slides
Remove from favorites
Contains column charts showing the role of Chinese OEMs in BEV production and their market share in the global top 100 suppliers. Includes text highlighting the professionalization and expansion of Chinese automotive suppliers.
Market Analysis and Trends
Transportation & Logistics
Discusses the growing influence of Chinese OEMs in the global automotive market, especially in BEV production. Analyzes the market share and strategic positioning of Chinese suppliers in the global top 100 suppliers.
Chinese OEMs, Market Dynamics, Automotive, BEV, Suppliers
false
Market Analysis and Trends
Transportation & Logistics
Multiple Chart
Roland Berger
Add to my slides
Remove from favorites
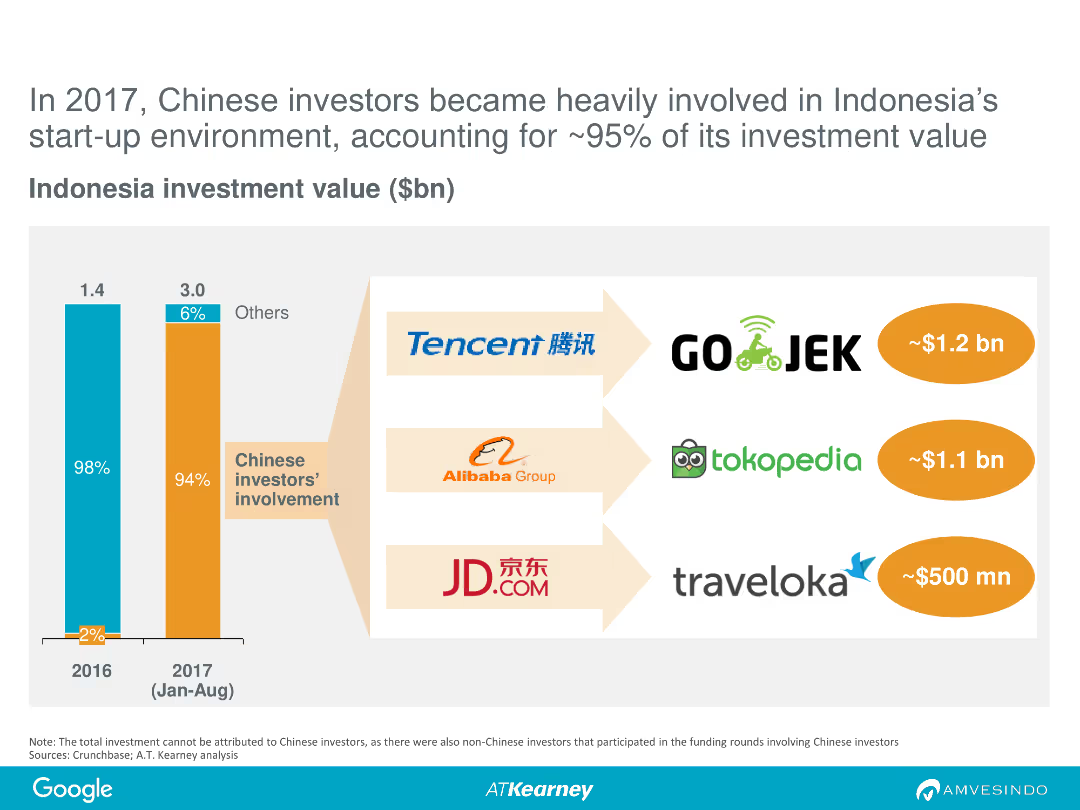
The slide features a column chart comparing investment values in Indonesia in 2016 and January-August 2017. It highlights the involvement of Chinese investors, with logos of major companies like Tencent, Alibaba, and JD.com.
Investment Analysis
Financial Services
This slide shows the significant involvement of Chinese investors in Indonesian start-ups, accounting for approximately 95% of investment value in 2017, showcasing major investment amounts from companies like Tencent and Alibaba.
Chinese investors, Indonesia, start-ups, investment, 2017, Tencent, Alibaba, JD.com
false
Investment Analysis
Financial Services
Multiple Chart
Kearney
Add to my slides
Remove from favorites
The slide includes text explaining the circular carbon economy concept and a diagram illustrating the four Rs.
Technology and Digital Transformation
Energy & Utilities
This slide explains the circular carbon economy concept, including reducing, reusing, recycling, and removing carbon.
Circular carbon economy, GCC, hydrogen, policy, energy
false
Technology and Digital Transformation
Energy & Utilities
Diagram
Kearney
Add to my slides
Remove from favorites
Displays diagrams and lists integrating circular intelligence into business operations, with focus areas like "Target & Performance Management" and "Measure & Monitor."
Technology and Digital Transformation
Environmental Services & Sustainability
Highlights how integrating circular intelligence can drive business value across various operational aspects. This slide is particularly useful for discussions on implementing circular strategies in business processes, enhancing data integration, and driving operational efficiencies.
Circular economy, Business intelligence, Data integration, Operational efficiency, Performance management, Sustainability, Technology integration, Business drivers, Monitoring, Reporting
false
Technology and Digital Transformation
Environmental Services & Sustainability
Linear Flow
Accenture
Add to my slides
Remove from favorites
Lists key activities in making a product fully circular, with a case example of Timberland's transformation journey.
Product and Service Analysis
Environmental Services & Sustainability
Provides a roadmap for making a product fully circular, emphasizing the importance of starting small, learning, and scaling. Ideal for use in product development meetings or sustainability strategy sessions, focusing on practical steps and high-impact strategies for circular product design.
Circular economy, Timberland, Product design, Sustainability, High-impact strategy, Scaling, Learning, Circular transformation, Product lifecycle, Innovation
false
Product and Service Analysis
Environmental Services & Sustainability
Linear Flow
Accenture
Add to my slides
Remove from favorites
The slide features a detailed process flow diagram illustrating the circular fashion ecosystem, with icons, text boxes, and arrows showing material flows and stages in the lifecycle of fashion products.
Strategic Planning
Retail & E-commerce
The slide provides an overview of the circular fashion ecosystem, detailing various stages from brands and designers to recycling, aiming to maximize utilization and reduce demand.
Circular fashion, Ecosystem, Recycling, Material flows, Fashion lifecycle
false
Strategic Planning
Retail & E-commerce
Diagram
Roland Berger
Add to my slides
Remove from favorites
A title slide with a deep blue abstract background. Prominently features the Citi logo, title for the 'Earnings Results Presentation', and the date 'Third Quarter 2023'.
Industry Overview
Financial Services
Introduces Citigroup's earnings results for the third quarter of 2023, setting the stage for a detailed financial review and analysis to follow in the presentation.
Citi, earnings report, Q3 2023, financial services, presentation title, abstract background, company logo, date.
false
Industry Overview
Financial Services
Title
Citigroup
Add to my slides
Remove from favorites
Uses column charts to detail the growth in affluent client households and their deposits at Citi. The slide is clean and effectively uses color to differentiate data points, enhancing readability.
Market Analysis and Trends
Financial Services
Analyzes the expansion and deepening of Citigold services among affluent clients, showing growth in client numbers and investments over time, underlining successful market penetration and relationship deepening strategies at Citi.
Citigold, affluent clients, growth strategy, Citi, market penetration, investments, client relationships
false
Market Analysis and Trends
Financial Services
Multiple Chart
Citigroup
Add to my slides
Remove from favorites
Previous
Next
You don't have any favorites yet.
Please wait loading your favorites slides...
Create a FREE account to continue browsing
Receive Instant Access to 7,500+ of the internet's best slides
First Name
Last Name
Email
Password
I agree to all
Terms & Privacy Policy
Thank you! Your submission has been received!
Oops! Something went wrong while submitting the form.
Have an account?
Sign in
Upgrade to PRO to Save slides
Advanced Search and Filters
Access to 8,000+ slides
Access to Category Pages
Save/Bookmark Slides
PowerPoint Template Library
(Coming Soon)
Pick a Plan
MONTHLY
$12/month
Billed every month, Cancel anytime.
YEARLY
$9/year
Billed $108 annually, Cancel anytime.
Checkout for $12/month
Checkout for $108/yr
Secured by Stripe | AES-256 bit encryption