My Account
My Slides
Leave Feedback
Login
Logout
Get Started
Browse all Slides
Browse Slides Pro
Create a FREE Account
Instant access to 1,000+ real slides from top companies like McKinsey, BCG, Goldman Sachs, Google and many more!
First Name
Last Name
Email
Password
I agree to all
Terms & Privacy Policy
Thank you! Your submission has been received!
Oops! Something went wrong while submitting the form.
Have an account?
Sign in
Saved Slides
Total No. of slides saved
0
↻ Refresh
✖ Clear all
This slide features a column chart and bullet points detailing the CET1 ratio changes over time. The color scheme is consistent with previous slides, using shades of blue to represent different financial periods.
Regulatory and Compliance
Financial Services
This slide analyzes Citigroup's CET1 capital ratio, detailing the factors influencing its recent changes and regulatory requirements. It is aimed at investors and regulators to demonstrate compliance with capital adequacy standards and Citigroup's ongoing financial health.
Citigroup, CET1 Ratio, Regulatory Compliance, Capital Management, Financial Health, QoQ Analysis, Capital Adequacy, Governance
false
Regulatory and Compliance
Financial Services
Multiple Chart
Citigroup
Add to my slides
Remove from favorites
The slide consists of various data visualizations including column charts, and a balance sheet summary. It utilizes blue and black colors for the graphics, and the layout is segmented to display different financial metrics.
Corporate Finance and Valuation
Financial Services
This slide offers an in-depth look at Citigroup's capital adequacy and balance sheet status, highlighting key financial ratios and the composition of assets and liabilities. It is instrumental for conveying the company's financial stability and capital management strategies to informed stakeholders.
Citigroup, Capital Overview, Balance Sheet, Risk-based Metrics, Liquidity, Leverage, Assets, Liabilities, Financial Stability
false
Corporate Finance and Valuation
Financial Services
Multiple Chart
Citigroup
Add to my slides
Remove from favorites
A comprehensive slide with pie charts and data points that break down credit distribution by segments, FICO scores, and regional exposure. The use of blue and black color segments in the charts aligns with Citigroup's branding.
Risk Assessment and Management
Financial Services
The slide presents an overview of Citigroup's consumer and corporate credit distribution, showcasing the company's credit risk management strategies and the diversity of its credit portfolio. It is designed to communicate credit risk profiles to stakeholders and illustrate the company's financial resilience.
Citigroup, Credit Overview, Consumer Credit, Corporate Lending, FICO Score, Regional Exposure, Credit Management, Risk Analysis
false
Risk Assessment and Management
Financial Services
Multiple Chart
Citigroup
Add to my slides
Remove from favorites
This slide has a mix of text and data presentations, including a column chart and several key financial metrics listed in a blue and white theme. The chart visualizes financial trends over quarters, with annotations for significant changes or highlights.
Financial Performance
Financial Services
A detailed review of Citigroup's financial results for the quarter, including revenue, expenses, and net income. It is likely intended for stakeholders interested in understanding the company's financial health and performance over time, with a focus on quarterly trends and key financial highlights.
Citigroup, Financial Overview, Q2, Revenues, Expenses, Net Income, Diluted EPS, RoE, RoTCE, Capital Ratio, Performance Analysis
false
Financial Performance
Financial Services
Mixed Chart
Citigroup
Add to my slides
Remove from favorites
A slide dense with column charts and statistical data comparing net interest income, average loans, and deposits over multiple quarters. It has a clear label for each chart and section, using contrasting colors to distinguish between different financial aspects.
Financial Performance
Financial Services
This slide provides detailed financial data on Citigroup's net interest income, loan distributions, and deposit trends. It is a tool for financial analysis, giving stakeholders insight into the company's earnings from interest and the status of its loan and deposit portfolios.
Citigroup, Net Interest Income, Average Loans, Deposits, QoQ, YoY, Financial Data, Banking, Revenue Streams, Portfolio Analysis
false
Financial Performance
Financial Services
Multiple Chart
Citigroup
Add to my slides
Remove from favorites
A slide with column chart and bullet points detailing quarter-on-quarter and year-on-year expenses. The slide also includes key investment themes and adds context to the financial figures presented.
Operational Efficiency
Financial Services
Details Citigroup's financial expenditures and investments for Q3 2023, allowing for operational assessment and strategic financial planning.
Citigroup, Q3 2023, expenses, investments, quarter-on-quarter, year-on-year, bar graphs, operational efficiency, bullet points, text.
false
Operational Efficiency
Financial Services
Mixed Chart
Citigroup
Add to my slides
Remove from favorites
A column chart and text combine to provide a visual breakdown of expenses and investment themes. Blue bars represent quantitative data while a sidebar lists investment themes with associated icons. The layout is structured to facilitate comparison and trend analysis.
Operational Efficiency
Financial Services
This slide compares quarter-on-quarter and year-on-year expenses for Citigroup, with an emphasis on how investments and strategic initiatives have contributed to these financial figures. It is useful for illustrating financial prudence and investment impact on the company's operations.
Citigroup, QoQ, YoY, Expenses, Investment Themes, Operational Efficiency, Platform Simplification, Security, Client Experience
false
Operational Efficiency
Financial Services
Mixed Chart
Citigroup
Add to my slides
Remove from favorites
Complex slide with multiple data points including bar graphs and textual information. Presents financial highlights such as revenues, net income, and EPS, with color-coded sections for different business units.
Financial Performance
Financial Services
Snapshot of Citigroup's financial performance for Q3 2023, including revenue, net income, and earnings per share. Details on various business sectors like ICG, PBWM, and Legacy provide a comprehensive overview for financial analysis.
Citigroup, financial results, Q3 2023, revenue, net income, EPS, business segments, performance snapshot, bar graphs, text.
false
Financial Performance
Financial Services
Table
Citigroup
Add to my slides
Remove from favorites
Slide featuring a combination of column charts depicting net interest income, average loans, and deposits. Includes numerical data and percentage changes with notes at the bottom for additional context.
Financial Performance
Financial Services
Provides a financial analysis of Citigroup's interest income, loan distribution, and deposit trends for Q3 2023, essential for evaluating the company's financial health and making investment decisions.
Citigroup, net interest income, loans, deposits, Q3 2023, financial analysis, bar graphs, column charts, percentage changes, notes.
false
Financial Performance
Financial Services
Multiple Chart
Citigroup
Add to my slides
Remove from favorites
A text-heavy slide divided into three sections titled 'Transformation', 'Strategic Execution', and 'Culture and Talent'. Bullet points describe key achievements and strategic actions within each area.
Strategic Planning
Financial Services
Showcases Citigroup's strategic priorities and progress made in the third quarter of 2023, touching on technology, strategic partnerships, and talent management. Intended for corporate strategy development and stakeholder communication.
Citigroup, strategic priorities, Q3 2023, transformation, strategic execution, culture, talent management, bullet points, text.
false
Strategic Planning
Financial Services
Table
Citigroup
Add to my slides
Remove from favorites
Consists of a world map, key facts list, and a pie chart showing sales distribution. The slide is visually dense with a high level of detail.
Operational Efficiency
Technology & Software
Provides an overview of Clarion's global presence, focusing on sales by region and the distribution of its manufacturing and development centers, emphasizing the company's operational scope.
Clarion, global, sales, manufacturing, development, automotive
false
Operational Efficiency
Technology & Software
Mixed Chart
Deutsche Bank
Add to my slides
Remove from favorites
Three pie charts depict the composition of IBKR’s client base, commissions, and client equity.
Client Case Studies
Financial Services
Exhibits the diversity of IBKR’s client base and revenue sources, using pie charts to show the distribution of accounts, commissions, and equity.
Client Base, Interactive Brokers, Commissions, Client Equity, Pie Charts, Diversification, Revenue Sources, Market Segments
false
Client Case Studies
Financial Services
Multiple Chart
Goldman Sachs
Add to my slides
Remove from favorites
Features a central hub-and-spoke diagram linking various strategies and tools aimed at enhancing client coverage, surrounded by relevant data points.
Operational Efficiency
Financial Services
Discusses the development and enhancement of JPMorgan’s client coverage team, emphasizing training, tools, and insights that lead to increased productivity and market understanding.
Client Coverage, Training, Productivity, Banking, Tools, Insights, Market Understanding
false
Operational Efficiency
Financial Services
Framework
JP Morgan
Add to my slides
Remove from favorites
Includes a column chart with a 1.0 and 1.4 ratio, surrounded by a circular arrow diagram, and includes key performance ranks.
Performance Metrics and KPIs
Financial Services
Emphasizes the franchise collaboration model's success and its impact on generating additional revenue from clients.
Client Experience, Collaboration, Revenue Growth, IB Corporate Clients, Multiplier Effect
false
Performance Metrics and KPIs
Financial Services
Single Chart
JP Morgan
Add to my slides
Remove from favorites
Contains a circular diagram with icons representing the firm's strengths, supplemented by text descriptions around the diagram's perimeter.
Strategic Planning
Financial Services
Articulates the unique position of the firm to support clients with their strengths, emphasizing on client experience.
Client Experience, Differentiation, Talent, Balance Sheet, Innovation, Strategic Integration
false
Strategic Planning
Financial Services
Linear Flow
JP Morgan
Add to my slides
Remove from favorites
Central diamond-shaped diagram with four quadrants, each labeling a business division, paired with a side panel listing client types.
Financial Performance
Financial Services
Highlights the company's comprehensive approach to client services across different business divisions, aligning with strategic client management.
Client Focus, Goldman Sachs, Business Divisions, Client Services, Strategy, Diagram
false
Financial Performance
Financial Services
Framework
Goldman Sachs
Add to my slides
Remove from favorites
This introductory slide features a circular diagram with four segments around a central label 'Clients', designed with shades of blue and black. Brief texts accompany icons symbolizing trust, client-centricity, and global reach.
Organizational Structure and Change
Financial Services
Introduces the company's focus on client relationships and outlines the core areas of service. It sets the stage for discussions on company values, structure, or strategic direction.
Client Relations, Core Services, Company Values
false
Organizational Structure and Change
Financial Services
Framework
Goldman Sachs
Add to my slides
Remove from favorites
Column charts, detailing client relationship data.
Strategic Planning
Financial Services
Discusses improvement in client share and ranking in global financial markets.
Client Relationships, Market Ranking, Financial Markets, Improvement, Analysis
false
Strategic Planning
Financial Services
Multiple Chart
Barclays
Add to my slides
Remove from favorites
Slide with title, with an arrow, and three sections of text outlining the initial phase, client feedback, and the forward plan for expanding client relationships.
Strategic Planning
Financial Services
Showcases the strategic plan to enhance client service by identifying complex needs, gathering feedback, and planning for client expansion, supported by dedicated professionals.
Client Service, Strategic Plan, Feedback, Expansion, Professional Support
false
Strategic Planning
Financial Services
Linear Flow
Goldman Sachs
Add to my slides
Remove from favorites
The slide presents text boxes with services offered, such as managing investments and navigating financial markets, paired with simple icons.
Client Case Studies
Professional Services
It showcases the range of client services provided, likely for marketing or sales presentations.
Client Services, Investments, Financial Markets, Mortgage, Insurance, Super Funds, Advice
false
Client Case Studies
Professional Services
Boxed
Goldman Sachs
Add to my slides
Remove from favorites
Uses a vertical flow diagram to depict the integration and enhancements in client solutions, with emphasis on digital transformation and payment solutions.
Technology and Digital Transformation
Financial Services
Describes JPMorgan’s initiatives to adapt and expand its client solutions, focusing on digital platforms like InstaMed and payment optimization, aimed at enhancing client engagement and satisfaction.
Client Solutions, Digital Transformation, Payments, Innovation, Engagement, Satisfaction
false
Technology and Digital Transformation
Financial Services
Header Horizontal
JP Morgan
Add to my slides
Remove from favorites
Featuring pie charts and a column chart, this slide focuses on client transaction frequencies and wallet composition across fee sizes.
Client Case Studies
Financial Services
The slide assesses the frequency of large episodic transactions for clients and the annual wallet composition by transaction size.
Client Transactions, Frequency, Pie Chart, Wallet Composition, Episodic Transactions, Fee Size, Financial Services
false
Client Case Studies
Financial Services
Multiple Chart
JP Morgan
Add to my slides
Remove from favorites
Step-by-step bars showing current to future growth in client assets with a goal of $10Tn. Uses blue highlights and a dotted line to indicate the pathway.
Strategic Planning
Financial Services
Depicts Morgan Stanley's strategic goal for client asset growth, presenting a roadmap to reach a $10 trillion long-term target.
Client assets, growth strategy, long-term goals, Morgan Stanley, $10Tn, strategic roadmap, wealth management
false
Strategic Planning
Financial Services
Single Chart
Goldman Sachs
Add to my slides
Remove from favorites
This slide features a doughnut chart and a pie chart, with a significant amount of textual information in bullet points. The color scheme is blue and white, and the design is sleek and corporate.
Customer and Market Segmentation
Financial Services
The slide focuses on the engagement levels of Chase's primary business banking clients, illustrating satisfaction rates and product adoption. It’s meant to emphasize the bank's success in maintaining client relationships and fostering loyalty.
Client engagement, Business banking, Chase, Satisfaction rate, Loyalty, Product adoption, Relationship management, Market segmentation
false
Customer and Market Segmentation
Financial Services
Mixed Chart
JP Morgan
Add to my slides
Remove from favorites
The slide presents a simple two-column comparison of actions and future directions with respect to the client franchise in FICC and Equities. A dark theme with white and blue text highlights the top 100 clients' attributes and planned actions.
Sales and Business Development
Financial Services
It discusses strategies for strengthening client relationships in FICC and Equities, appropriate for discussions on client management and business development.
Client franchise, FICC, Equities, growth plan
false
Sales and Business Development
Financial Services
Table
Goldman Sachs
Add to my slides
Remove from favorites
Slide features a four-section comparison with icons, lists, and a color-coded column chart showing revenue.
Market Analysis and Trends
Financial Services
Highlights the strengths of different client franchises and their market leadership positions.
Client franchises, community banking, investment bank, asset management, revenue
false
Market Analysis and Trends
Financial Services
Mixed Chart
JP Morgan
Add to my slides
Remove from favorites
The slide has a bar chart showing client retention rate, and two pie charts displaying revenue distribution by clients and by country and region.
Client Case Studies
Professional Services
This slide highlights the high client retention rate (>99%) and the distribution of revenue by client and geography for the year 2022.
Client retention, revenue, pie chart, bar chart, geography
false
Client Case Studies
Professional Services
Multiple Chart
IPSOS
Add to my slides
Remove from favorites
Contains a circular flow diagram illustrating various aspects of client coverage, such as market insights and workflow optimization, accompanied by icons and a key indicating outcomes like client satisfaction.
Strategic Planning
Financial Services
Depicts the strategy and analytics used in client coverage teams for performance improvement.
Client, coverage, analytics, market, training, insights, performance, banking, strategy
false
Strategic Planning
Financial Services
Diagram
JP Morgan
Add to my slides
Remove from favorites
A horizontal process diagram illustrates the client experience from solutioning through onboarding, lending, servicing, to content delivery, complemented by performance and efficiency icons.
Operational Efficiency
Financial Services
Focuses on operational excellence and client experience through various banking services.
Client, experience, KYC, lending, servicing, operational, excellence, onboarding, banking
false
Operational Efficiency
Financial Services
Linear Flow
JP Morgan
Add to my slides
Remove from favorites
Slide is text-heavy with bullet-point recommendations for organizations on climate action. Features three circular green icons, representing different strategies like frameworks, plans, and education.
Strategic Planning
Environmental Services & Sustainability
Provides strategic recommendations for organizations aiming to enhance their environmental sustainability efforts, including planning, education, and framework adoption.
Climate Action, Strategic Recommendations, Sustainability, Organizational Planning, Education, Frameworks
false
Strategic Planning
Environmental Services & Sustainability
Header Vertical
Deloitte
Add to my slides
Remove from favorites
This slide presents a dense layout with a multi-bar chart comparing global and country-specific data from 2010 and 2020. It has a clear title and captions, with significant use of orange and black to distinguish data points.
Market Analysis and Trends
Environmental Services & Sustainability
This slide provides an analysis of how climate change opportunities are perceived in different economies, with an emphasis on the growing acceptance in China. It offers insights into international views on environmental initiatives and is likely used in global sustainability strategy meetings or environmental impact assessments.
Climate Change, Economies, Global, China, Opportunities, Environment, Strategy, Acceptance, Assessment
false
Market Analysis and Trends
Environmental Services & Sustainability
Single Chart
PwC/Strategy&
Add to my slides
Remove from favorites
This slide is a timeline with visuals representing the company's strategy to achieve net-zero climate impact by 2030. It includes a bar chart showing the baseline and target reductions in greenhouse gas emissions. The visuals and text are well-organized and provide clear targets and strategies, using a palette of blue, white, and gray.
Corporate Finance and Valuation
Environmental Services & Sustainability
Outlines the company's commitment and strategic plan for reducing its climate impact, with targets set for 2025 and 2030. It's used to communicate the environmental goals and milestones to stakeholders, demonstrating the company's sustainability efforts and progress.
Climate Impact, Net-zero Strategy, Greenhouse Gas Reduction, Sustainability Goals, Environmental Commitment
false
Corporate Finance and Valuation
Environmental Services & Sustainability
Mixed Chart
McKinsey
Add to my slides
Remove from favorites
Column charts and tables showing survey results on climate and environmental risk priorities, with a focus on changes expected in the next three years.
Risk Assessment and Management
Financial Services
The slide examines the increasing importance of climate and environmental risks for CROs, detailing priority shifts and the need for better risk management practices.
Climate Risk, Environmental Risk, Priorities, Survey Results
false
Risk Assessment and Management
Financial Services
Multiple Chart
EY
Add to my slides
Remove from favorites
The slide features a circle divided into transition and adaptation plan sectors and three-dimensional columns representing scopes of CO2 emissions.
Strategic Planning
Industrial & Manufacturing
This slide outlines Michelin's climate strategy with a focus on transitioning towards net-zero emissions by 2050, including the adaptation plan and emissions scope.
Climate Strategy, Net-Zero Emissions, Transition Plan, Adaptation Plan, Michelin, Sustainability, CO2 Emissions, 2050 Target, Corporate Strategy, Decarbonization
false
Strategic Planning
Industrial & Manufacturing
Framework
Morgan Stanley
Add to my slides
Remove from favorites
Includes icons, a bar chart, and comprehensive text to explain the data. Color scheme includes shades of green and blue.
Regulatory and Compliance
Environmental Services & Sustainability
Surveys CXO attitudes towards climate change and action, showing both personal impact and corporate responses.
Climate action, CXO views, corporate response, personal impact
false
Regulatory and Compliance
Environmental Services & Sustainability
Multiple Chart
Deloitte
Add to my slides
Remove from favorites
Utilizes split content areas to compare current states and needed actions with visual elements like icons to illustrate points clearly.
Strategic Planning
Environmental Services & Sustainability
Analyzes the gap between current climate actions and the targets set, emphasizing the need for specific plans, governance, and financing to achieve these goals in SEA.
Climate action, strategic planning, SEA, governance, financing
false
Strategic Planning
Environmental Services & Sustainability
Agenda
Bain
Add to my slides
Remove from favorites
Slide features two column charts comparing leaders and lagging organizations in their concern and actions regarding climate change. It uses green and dark green bars, with significant textual annotations and percentage indicators.
Market Analysis and Trends
Environmental Services & Sustainability
This slide contrasts the attitudes and actions between leadership and lagging organizations concerning climate change, focusing on their level of concern and active measures taken.
Climate change, Leadership, Sustainability, Corporate Responsibility, Actions, Concern, Comparison, Statistics, Environmental
false
Market Analysis and Trends
Environmental Services & Sustainability
Multiple Chart
Deloitte
Add to my slides
Remove from favorites
A bar chart comparing Millennials and Gen Z on their views about climate change, with agree/disagree metrics on whether it is too late to repair the damage.
Market Analysis and Trends
Environmental Services & Sustainability
The slide examines the views of Millennials and Gen Z on the possibility of reversing climate change damage, comparing their levels of agreement and disagreement.
Climate change, Millennials, Gen Z, agreement, disagreement, environmental views, damage reversal, sustainability, comparison
false
Market Analysis and Trends
Environmental Services & Sustainability
Mixed Chart
Deloitte
Add to my slides
Remove from favorites
This slide contains a map of Australia with markers indicating various states and their climate targets. It includes several text boxes detailing the efforts of different states in achieving net-zero emissions by 2050.
Regulatory and Compliance
Government & Public Sector
This slide discusses how Australian state governments are supporting landowners with land restoration and biodiversity efforts to achieve net-zero emissions by 2050. It highlights different state initiatives and targets in the context of climate change.
Climate change, Net zero, Government, Land restoration, Biodiversity
false
Regulatory and Compliance
Government & Public Sector
Graphic
EY
Add to my slides
Remove from favorites
This slide features a world map with various tipping points indicated by colored dots corresponding to specific global warming thresholds. Each point is labeled with the effect and the temperature range.
Regulatory and Compliance
Environmental Services & Sustainability
The slide visually represents potential environmental tipping points globally as temperatures increase, like melting ice sheets and deforestation impacts. Useful for discussing the specific climate thresholds at which irreversible changes may occur.
Climate change, Tipping points, Global warming, Deforestation, Ice melting
false
Regulatory and Compliance
Environmental Services & Sustainability
Graphic
BCG
Add to my slides
Remove from favorites
Features a pie chart, a bar chart, and substantial explanatory text. Layout is clear with visual emphasis on key stats.
Regulatory and Compliance
Environmental Services & Sustainability
Examines the expected impact of climate change on business strategies and operations, detailing top climate issues affecting companies.
Climate change, business impact, operations, strategy
false
Regulatory and Compliance
Environmental Services & Sustainability
Multiple Chart
Deloitte
Add to my slides
Remove from favorites
Includes text with a circular infographic detailing the five sources of pressure for businesses to act on climate change.
Risk Assessment and Management
Environmental Services & Sustainability
Outlines the pressures from governments, customers, investors, employees, and physical risks, pushing businesses to adopt decarbonization strategies.
Climate change, decarbonisation, stakeholders, pressure, business, risk, management, sustainability
false
Risk Assessment and Management
Environmental Services & Sustainability
Diagram
EY
Add to my slides
Remove from favorites
Contains a bar chart and a column chart, with blue-green color scheme. Text is used to provide context and explanations.
Regulatory and Compliance
Environmental Services & Sustainability
Highlights the importance of climate change in corporate strategy and investments, focusing on the top pressing issues and changes in sustainability investments.
Climate change, sustainability, corporate strategy, investments
false
Regulatory and Compliance
Environmental Services & Sustainability
Multiple Chart
Deloitte
Add to my slides
Remove from favorites
Column charts contrasting views from different countries. Simple and clear layout with green color highlights.
Regulatory and Compliance
Environmental Services & Sustainability
Discusses the concept of a "just transition" in sustainability efforts and its varying importance across different countries.
Climate equity, just transition, regional differences, sustainability
false
Regulatory and Compliance
Environmental Services & Sustainability
Multiple Chart
Deloitte
Add to my slides
Remove from favorites
This slide presents a comparative analysis of climate ambition, sector roadmaps, and policy frameworks across various countries, using a multi-tiered visual layout that includes icons representing countries and different levels of policy adequacy.
Regulatory and Compliance
Environmental Services & Sustainability
Evaluates the adequacy of climate policies across multiple countries, highlighting those with sufficient ambition and those lacking. Useful for discussions on enhancing climate policy frameworks and sector-specific strategies to meet global climate goals.
Climate policies, Country comparison, Policy adequacy, Ambition, Roadmaps
false
Regulatory and Compliance
Environmental Services & Sustainability
Table
BCG
Add to my slides
Remove from favorites
This content slide includes a mix of text, a photo of a worker with wind turbines, and a column chart displaying economic, energy, and emissions trends under three scenarios. The design is moderately dense with detailed information.
Market Analysis and Trends
Environmental Services & Sustainability
The slide outlines how green climate action can decouple GDP growth from emissions and energy consumption. It compares three scenarios for global economic growth and emissions trends up to 2050, showing the potential benefits of transitioning to renewable energy sources and improving energy efficiency.
Climate, Emissions, GDP, Energy, Sustainability
false
Market Analysis and Trends
Environmental Services & Sustainability
Multiple Chart
EY
Add to my slides
Remove from favorites
The slide features a vertical bar chart comparing levels of concern about the climate over several years across different countries.
Market Analysis and Trends
Environmental Services & Sustainability
Analysis of changing levels of public concern about the climate in various countries over time, showing trends and possible waning interest in some areas.
Climate, concern, trends, survey, countries
false
Market Analysis and Trends
Environmental Services & Sustainability
Mixed Chart
IPSOS
Add to my slides
Remove from favorites
Scatter plot, color-coded data, geographical references.
Risk Assessment and Management
Environmental Services & Sustainability
Compares companies' preparedness for climate change risk against natural hazard exposure.
Climate, risk, companies, preparedness, hazards, exposure, environment, strategy
false
Risk Assessment and Management
Environmental Services & Sustainability
Single Chart
PwC/Strategy&
Add to my slides
Remove from favorites
The slide features comparative visuals of traditional and edge cloud computing models. Graphical elements and color coding effectively delineate different computational approaches against a dark theme.
Technology and Digital Transformation
Technology & Software
The slide provides a clear and concise comparison between traditional cloud and edge computing. It highlights the benefits of edge computing in reducing data transmission delays and costs while offering a more relevant set of data for businesses to comply with data residency laws.
Cloud Computing, Edge Computing, Data Transmission
false
Technology and Digital Transformation
Technology & Software
Diagram
McKinsey
Add to my slides
Remove from favorites
A scatter plot similar to the IT intensity slide, but focused on cloud intensity. It compares IT spending per employee and value-added per employee, with countries grouped and color-coded.
Market Analysis and Trends
Technology & Software
The slide evaluates cloud intensity by country, comparing IT spending on cloud services to the economic value added per employee, useful for understanding global cloud adoption.
Cloud Intensity, Country Analysis, Cloud Spending, Economic Value, International Comparison
false
Market Analysis and Trends
Technology & Software
Single Chart
Gartner
Add to my slides
Remove from favorites
A slide with a blend of icons and text, displayed on a dark background. Icons represent financial opportunity, hybrid cloud strategy, market growth, and security concerns, underscoring the slide's strategic message to leaders.
Technology and Digital Transformation
Technology & Software
Aimed at business leaders, the slide articulates why cloud computing is a pivotal area of technology to consider, with implications for cost savings, market growth, and security. It underscores the strategic significance of cloud services and hybrid approaches in the technological advancement of organizations.
Cloud Strategy, Market Growth, Security Concerns
false
Technology and Digital Transformation
Technology & Software
Pillar
McKinsey
Add to my slides
Remove from favorites
Features a central donut chart labeled "Client 360°" with associated data types around it, and lists on the side for business value delivery, sales enablement, and operational excellence.
Technology and Digital Transformation
Technology & Software
Explains the business value of a cloud-based, data-driven platform.
Cloud, data, platform, business, risk, analytics, forecasting, operational, sales, engagement
false
Technology and Digital Transformation
Technology & Software
Framework
JP Morgan
Add to my slides
Remove from favorites
Uses timelines and arrows to show progress and completion targets for tech platforms, with icons indicating platform benefits.
Technology and Digital Transformation
Technology & Software
Outlines the status and impact of J.P.Morgan's cloud-native tech platforms, showing expected completion dates and revenue generation.
Cloud-Native, Tech Platforms, Revenue, Development, J.P.Morgan, Real-Time Payments, Liquidity
false
Technology and Digital Transformation
Technology & Software
Mixed Chart
JP Morgan
Add to my slides
Remove from favorites
Features a column chart displaying coastal shipping volumes for clinker and cement, along with a map highlighting major shipping routes in Australia.
Market Analysis and Trends
Transportation & Logistics
Analyzes the growth of coastal shipping for cement and clinker in Australia. Discusses the impact of cabotage costs and identifies key shipping routes and distribution centers.
Coastal shipping, cement, clinker, cabotage, Australia
false
Market Analysis and Trends
Transportation & Logistics
Mixed Chart
LEK
Add to my slides
Remove from favorites
This slide has a bright and bold aesthetic with a large title, multiple sections with headers, and bullet-pointed lists. It highlights strategies for implementing coding in education curricula worldwide, starting from early education through advanced modules. The design includes national flags as icons and color-coded sections for clarity. The slide is visually engaging and informative.
Regulatory and Compliance
Education & Training
The slide compares various global strategies for integrating technology skills into education systems. It outlines efforts to start coding education early, make it mandatory, and introduce advanced tech modules. It includes specific country examples, providing a comprehensive overview of the progressive steps taken to prepare the next generation for a digital future.
Coding Education, Curriculum, Global Strategies, Mandatory Coding, Advanced Tech, Italy, Singapore, India, International Education, Digital Skills
false
Regulatory and Compliance
Education & Training
Header Horizontal
Kearney
Add to my slides
Remove from favorites
The slide has a clean and structured design featuring multiple screenshots and text representations. It focuses on various phases of data processing and visualization through a service called CognitiveSpend, highlighted by distinct green color blocks.
Technology and Digital Transformation
Technology & Software
This slide presents a Google platform-based solution called CognitiveSpend, which classifies spend data and provides insights within two weeks. It shows data aggregation, dashboard examples, and actionable insights delivery through multiple visualizations, enhancing strategic spend management.
CognitiveSpend, Google Cloud, data classification, spend management, actionable insights
false
Technology and Digital Transformation
Technology & Software
Linear Flow
Deloitte
Add to my slides
Remove from favorites
This slide compares cold storage capacities per 1000 urban residents in several countries using column charts, showing Nigeria's low capacity relative to others. It includes a statistic on the loss percentage due to inadequate storage.
Strategic Planning
Agriculture & Food Production
The slide exposes the critical gaps in cold storage infrastructure in Nigeria compared to other countries, linking these deficiencies to high food loss rates. It underscores the necessity for investing in enhanced cold storage solutions to support food security initiatives.
Cold Storage, Capacity, Nigeria, Challenges, Comparison
false
Strategic Planning
Agriculture & Food Production
Mixed Chart
BCG
Add to my slides
Remove from favorites
This slide presents a dual bar chart comparing the daily costs of cold storage as a percentage of a farmer's income in Nigeria, India, and Rwanda, illustrating the significant financial strain on Nigerian farmers.
Strategic Planning
Agriculture & Food Production
This slide assesses the economic impact of cold storage costs on smallholder farmers in Nigeria, comparing it with other countries to highlight the disproportionate burden. It advocates for more affordable and accessible storage solutions to aid farmers and reduce food loss.
Cold Storage, Costs, Farmers, Nigeria, Comparative Analysis
false
Strategic Planning
Agriculture & Food Production
Multiple Chart
BCG
Add to my slides
Remove from favorites
A vibrant, color-coded infographic slide details incentives offered by companies to promote office collaboration. It provides quantitative data on various programs through large percentage figures.
Organizational Structure and Change
Professional Services
This slide communicates the extent of strategies implemented to encourage employees to work on-site. It's likely intended for managers seeking to enhance office collaboration.
Collaboration Incentives, Office Work, Employee Programs, Quantitative Data, On-site Work
false
Organizational Structure and Change
Professional Services
Single Chart
EY
Add to my slides
Remove from favorites
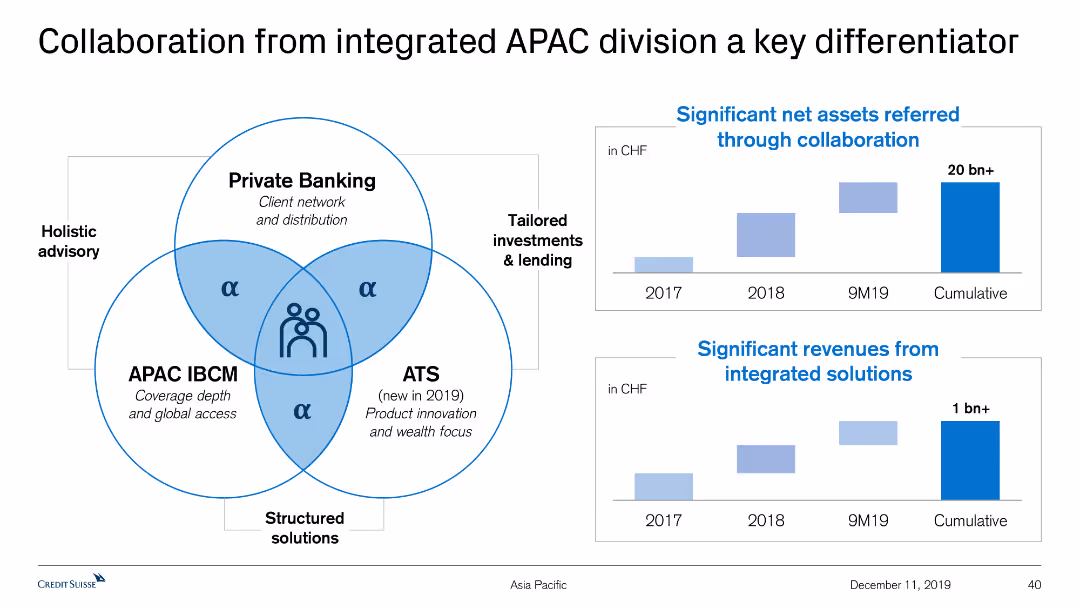
This slide features a Venn diagram illustrating the collaboration among Private Banking, APAC IBCM, and ATS. It also includes two column charts displaying net assets and revenues.
Strategic Planning
Financial Services
The slide explains the synergy between Private Banking, APAC IBCM, and ATS to deliver holistic advisory and tailored solutions, with significant assets and revenue growth data.
Collaboration, APAC, Private Banking, Revenue Growth, Net Assets
false
Strategic Planning
Financial Services
Multiple Chart
Credit Suisse
Add to my slides
Remove from favorites
The slide features a mix of text on the left and a column chart on the right. The column chart illustrates different sectors and their plans to partner with creators.
Strategic Planning
Professional Services
The slide discusses the trend of creative collaboration beyond the traditional organization structure, highlighting sectors that are planning to partner more with creators, with a supporting column chart showing sector-wise data.
Collaboration, CMOs, sectors, creative partnerships, trend
false
Strategic Planning
Professional Services
Mixed Chart
Deloitte
Add to my slides
Remove from favorites
Features an extensive flowchart diagram with different financial services offered by the firm, divided by client needs, and includes some numerical data points.
Organizational Structure and Change
Financial Services
Details the comprehensive offerings by the firm to support clients during IB transactions and the depth of relationships.
Collaboration, Franchise, Client Support, IB Transactions, Services Offering, Commercial Banking
false
Organizational Structure and Change
Financial Services
Table
JP Morgan
Add to my slides
Remove from favorites
The slide features a Venn diagram showing the relationship between Private Banking, APAC IBCM, and ATS, emphasizing global connectivity.
Strategic Planning
Professional Services
This slide outlines the collaborative approach central to the company's strategy, highlighting the synergy between Private Banking, APAC IBCM, and ATS, along with the emphasis on global connectivity.
Collaboration, Private Banking, APAC IBCM, ATS, Global Connectivity
false
Strategic Planning
Professional Services
Framework
Credit Suisse
Add to my slides
Remove from favorites
Includes a column chart showing NNA generation since end-2015 and bullet points detailing collaboration highlights with Private Banking.
Strategic Planning
Financial Services
The slide emphasizes the importance of collaboration with Private Banking, showcasing significant asset generation and outlining strategic priorities for growth.
Collaboration, Private Banking, NNA, Asset Generation, Strategic Priorities
false
Strategic Planning
Financial Services
Mixed Chart
Credit Suisse
Add to my slides
Remove from favorites
This slide features an image of people collaborating over a tablet on the right, with the rest of the slide divided into text sections. The layout is clean, with white text on a red background for the headings and black text for the body. The image is captioned, contributing to the overall narrative.
Regulatory and Compliance
Government & Public Sector
Discusses the collaborative investments in R&D for the Tempest program and its implications for technological development and defense, suitable for presentations on government-industry partnerships and investment strategies.
Collaboration, R&D, Defense Technology, Investment, Government-Industry Partnerships
false
Regulatory and Compliance
Government & Public Sector
Vertical Flow
PwC/Strategy&
Add to my slides
Remove from favorites
The slide features icons and percentages indicating types of stakeholders companies are collaborating with, set against a green background.
Strategic Planning
Agriculture & Food Production
Discusses current collaborations in the food ecosystem, noting primary collaborations with suppliers and producers, followed by academia and government. Relevant for studies on ecosystem management.
Collaboration, Stakeholders, Suppliers, Producers, Ecosystem Management
false
Strategic Planning
Agriculture & Food Production
Multiple Chart
Deloitte
Add to my slides
Remove from favorites
A bar graph slide with horizontal bars of varying lengths indicating levels of focus on different types of work and collaboration. The background is clean, allowing the graph and the descriptive text on the left to stand out. The use of grayscale with selective yellow highlights creates visual interest.
Organizational Structure and Change
Professional Services
This slide examines shifts in collaboration and independent work trends over the past two years. It employs a bar graph to display the proportionate change in focus, serving as an analytical tool for companies reassessing their collaborative practices in light of remote and hybrid work experiences.
Collaboration, Trends, Remote Work, Hybrid Work, Organizational Change
false
Organizational Structure and Change
Professional Services
Single Chart
EY
Add to my slides
Remove from favorites
Displays pie charts to show the percentages of buyers purchasing different categories of products in collaborations.
Product and Service Analysis
Retail & E-commerce
Details top-purchased product categories in luxury brand collaborations, such as handbags and sneakers.
Collaborations, luxury products, purchasing behavior, handbags, sneakers, consumer preferences, top products
false
Product and Service Analysis
Retail & E-commerce
Multiple Chart
BCG
Add to my slides
Remove from favorites
The slide displays a combined pie chart and bar graph, accompanied by bullet points to the left that provide context and explain the visual data.
Market Analysis and Trends
Industrial & Manufacturing
Analyzes the overall economic contribution of Combat Air activities, including the Tempest programme, to the UK economy.
Combat Air, GVA, Economic Contribution, Tempest Programme, Pie Chart
false
Market Analysis and Trends
Industrial & Manufacturing
Mixed Chart
PwC/Strategy&
Add to my slides
Remove from favorites
The layout includes a title and two columns of text, one for economic contribution details and the other for graphic representation of the same. The design is streamlined, with clear differentiation between sections.
Financial Performance
Government & Public Sector
Provides a comprehensive breakdown of the economic contributions of the Tempest partners’ activities, focusing on job creation and GVA contributions, making it apt for discussions on economic strategies in defense and related financial planning.
Combat Air, Tempest, GVA, Jobs, Economic Strategy, Defense
false
Financial Performance
Government & Public Sector
Text Only
PwC/Strategy&
Add to my slides
Remove from favorites
A diagrammatic slide with labeled tech clusters indicating their roles as Infrastructure, Enablers, and Applications. Uses a simple black and white scheme for a professional, analytical look.
Strategic Planning
Technology & Software
This slide demonstrates the exponential growth due to the combinatorial effects of technology across industries. It helps in understanding how the convergence of various tech advancements enables new business models and innovation, making it essential for strategic discussions about technological investments and industry evolution.
Combinatorial Effects, Technology, Growth, Innovation, Business Models, Investment, Industry Evolution
false
Strategic Planning
Technology & Software
Framework
McKinsey
Add to my slides
Remove from favorites
Images of mobile devices and graphs represent new client solutions like TravelBank and RTP. Text explains the benefits of each service.
Product and Service Analysis
Financial Services
Discusses innovative solutions offered to commercial clients, focusing on tech-driven management and real-time payments, targeting underrepresented markets and large corporations.
Commercial Clients, TravelBank, RTP
false
Product and Service Analysis
Financial Services
Mixed Chart
Goldman Sachs
Add to my slides
Remove from favorites
Integrates pie charts and text blocks. Blue and grey tones highlight different regions and sectors in real estate.
Risk Assessment and Management
Real Estate & Construction
Offers an analysis of non-recourse loans and exposure in CRE by region and sector, highlighting financial risks and market conditions.
Commercial real estate, loans, stress test, market analysis, risk assessment, regions, sectors
false
Risk Assessment and Management
Real Estate & Construction
Multiple Chart
Deutsche Bank
Add to my slides
Remove from favorites
Line chart showing annual average price trends for power, gas, and oil on a 2020 basis from 2020-2023 YTD. Moderate complexity, effectively visualizing commodity price volatility over the years.
Market Analysis and Trends
Financial Services
This slide analyzes the volatility in commodity prices, particularly in power, gas, and oil. It discusses the trends in average prices from 2020 to 2023 YTD, highlighting the significant fluctuations in commodity markets.
Commodity prices, power, gas, oil, volatility
false
Market Analysis and Trends
Financial Services
Single Chart
EY
Add to my slides
Remove from favorites
The slide features a column chart displaying council members' responses regarding the impact of communication during acquisitions. There is an image of a high-rise building on the right.
Mergers and Acquisitions
Professional Services
Discusses the role of communication in various phases of acquisition: pre-acquisition scoping, execution, and integration.
Communication, Acquisition, Integration, Strategy, Professional Services
false
Mergers and Acquisitions
Professional Services
Mixed Chart
IPSOS
Add to my slides
Remove from favorites
The slide presents a two-column text format with a small section in the lower right corner depicting a U.S. map with colored dots indicating branch locations. The colors correspond to a legend identifying various cities. The layout is well-organized and easy to follow.
Financial Performance
Financial Services
Highlights the expansion of community centers and the role of Community Managers. It discusses trust-building with clients and providing financial education, with a focus on minority communities. The map shows branch locations across the U.S.
Community Banking, Financial Education, Branch Expansion, Trust-Building, Minority Communities, U.S. Map, Community Managers
false
Financial Performance
Financial Services
Boxed
JP Morgan
Add to my slides
Remove from favorites
Photos of branch interiors and community engagement. Data boxes outline community strategy and roles.
Strategic Planning
Financial Services
Bank's approach to community engagement through tailored branch formats and local strategy implementation.
Community Engagement, Branch Evolution, Tailoring Execution, Local Strategy, Financial Services
false
Strategic Planning
Financial Services
Table
JP Morgan
Add to my slides
Remove from favorites
Features column charts and statistics on community engagement, volunteer hours, and the impact of community hubs on quality of life.
Operational Efficiency
Government & Public Sector
Assesses the impact of community hubs on participant engagement and quality of life improvements, detailing volunteer contributions and personal benefits.
Community hubs, engagement, quality of life, volunteer hours, personal benefits
false
Operational Efficiency
Government & Public Sector
Multiple Chart
Deloitte
Add to my slides
Remove from favorites
Includes bar charts showing commute times and primary work locations. Key findings are provided in bullet points.
Market Analysis and Trends
Professional Services
Analyzes how office attributes like commute time and primary work location influence employee preferences, including tenure at the current company.
Commute time, Work location, Employee preferences, Tenure, Office attributes
false
Market Analysis and Trends
Professional Services
Multiple Chart
EY
Add to my slides
Remove from favorites
Contains text with icons and a circular diagram, using a green and white color scheme. The layout is well-structured and clear.
Organizational Structure and Change
Professional Services
Highlights the importance of personnel in driving the company's evolution, suitable for discussions on company culture and human resources.
Company Culture, Organic Growth, Accountability, Integrity
false
Organizational Structure and Change
Professional Services
Mixed Chart
Morgan Stanley
Add to my slides
Remove from favorites
Bar chart showing company priorities for 2019, focusing on areas such as product portfolio, production, controlling & finance, sales & marketing, and procurement.
Strategic Planning
Financial Services
The slide outlines the top priorities for companies in 2019, with a significant focus on the product portfolio. It highlights the growing importance of controlling and finance activities, alongside other strategic areas like production, sales, and marketing, reflecting the key areas where businesses plan to concentrate their efforts.
Company Priorities, Product Portfolio, Strategic Planning
false
Strategic Planning
Financial Services
Multiple Chart
Roland Berger
Add to my slides
Remove from favorites
Combination of text, percentage circles, and visual comparisons highlighting differences in optimism about company culture between employees and employers post-pandemic.
Human Resources and Talent Management
Professional Services
This slide examines the impact of the pandemic on company culture, showing increased employee optimism versus declining employer optimism, and significant staff turnover.
Company culture, pandemic impact, employee optimism, employer pessimism, staff turnover
false
Human Resources and Talent Management
Professional Services
Multiple Chart
EY
Add to my slides
Remove from favorites
The slide presents a comparative table of various players in the market research industry, showing turnover and focus areas.
Competitive Landscape
Professional Services
The slide compares Ipsos with other market research companies, highlighting turnover figures and areas of specialization.
Comparative, Market Research, Turnover, Specialization, Ipsos
false
Competitive Landscape
Professional Services
Multiple Chart
IPSOS
Add to my slides
Remove from favorites
Contains text boxes with bullet points comparing the US and France with Australia in terms of cement industry characteristics.
Strategic Planning
Industrial & Manufacturing
Compares the cement supply chain and import-export dynamics of the US Northeast and France with Australia. Identifies key factors for selection of comparators, such as economic development and shipping methods.
Comparators, cement industry, US, France, Australia
false
Strategic Planning
Industrial & Manufacturing
Header Vertical
LEK
Add to my slides
Remove from favorites
P&L comparison for connectivity funding models
Strategic Planning
Telecommunications
Shows bar graphs comparing costs and gaps across various funding models, including government subsidies and community contributions. The layout is straightforward, focusing on the financial aspects with clear labels and color differentiation.
Compares profitability and losses across different funding models for school connectivity in Java, Bali, and Sumatra, discussing the efficacy and limitations of each.
false
Strategic Planning
Telecommunications
Multiple Chart
BCG
Add to my slides
Remove from favorites
Pie chart and data points, featuring a concise and clean layout.
Investment Analysis
Energy & Utilities
Provides an overview of Compass's Oil & Gas portfolio, key figures, and risk assessments for BBVA USA.
Compass, portfolio, BBVA, risk
false
Investment Analysis
Energy & Utilities
Mixed Chart
Morgan Stanley
Add to my slides
Remove from favorites
This slide uses a combination of tables and a chart to present compensation structures. There are text boxes with bullet points, and a flow diagram depicts the performance share plans linkage to ESG criteria.
Financial Performance
Industrial & Manufacturing
Showcases the integration of ESG criteria into Michelin’s managerial compensation, aligning financial incentives with environmental and social governance. It can be used to discuss performance-based compensation strategies.
Compensation, ESG, Performance, Incentives, Management
false
Financial Performance
Industrial & Manufacturing
Header Horizontal
Morgan Stanley
Add to my slides
Remove from favorites
This slide features a puzzle-shaped triangle diagram segmented into three parts, each labeled with a key component of an attractive rewards and compensation structure.
Human Resources and Talent Management
Professional Services
The slide is designed to discuss the three core components that constitute an attractive rewards and compensation system in an organization, likely used as part of a detailed HR presentation on employee remuneration and benefits.
Compensation, Employee Benefits, Rewards Structure, HR Strategy
false
Human Resources and Talent Management
Professional Services
Framework
Kearney
Add to my slides
Remove from favorites
The slide features two column charts comparing the impact of the Great Resignation on front and back office compensation packages. An image on the left shows professionals in a casual meeting. The charts use different shades of orange and red to display data.
Human Resources and Talent Management
Financial Services
The slide outlines how managers have increased base compensation and discretionary bonuses to address labor challenges for both front and back offices, focusing on improving compensation to retain staff.
Compensation, labor trends, Great Resignation, front office, back office
false
Human Resources and Talent Management
Financial Services
Multiple Chart
EY
Add to my slides
Remove from favorites
The slide features a structured diagram illustrating the competencies required for a Data Scientist, with a mix of foundational non-tech skills and next-level tech-skills, clearly divided and labeled in distinct boxes.
Strategic Planning
Technology & Software
The slide is used for outlining the essential competencies for a Data Scientist role, delineating both foundational non-technical skills and advanced technical skills necessary for the profession.
Competency, Data Scientist, Skills, Framework, Role-Specific
false
Strategic Planning
Technology & Software
Diagram
Kearney
Add to my slides
Remove from favorites
The slide features a circular diagram categorizing competition by sectors and specialties, with Ipsos at the center.
Competitive Landscape
Professional Services
The slide provides an overview of the competitive landscape, illustrating how Ipsos competes across various sectors and specialties.
Competition, Sectors, Specialties, Ipsos, Market Research
false
Competitive Landscape
Professional Services
Diagram
IPSOS
Add to my slides
Remove from favorites
World map with highlighted countries and text boxes detailing Ipsos' strengths and global presence.
Competitive Landscape
Professional Services
Showcases Ipsos' competitive advantages, including global market leadership, extensive public sector research, and multidisciplinary teams. Highlights geographic and institutional reach.
Competitive Advantage, Global Presence, Research, Ipsos
false
Competitive Landscape
Professional Services
Graphic
IPSOS
Add to my slides
Remove from favorites
This slide features a multi-colored stacked heatmap detailing Hong Kong's competitiveness in various ESG-related areas. The chart uses different shades to represent degrees of competitiveness.
Market Analysis and Trends
Financial Services
The data visualizes Hong Kong's position in the financial market maturity, presence in international markets, and local enthusiasm for ESG, among others. Each area is assessed for competitiveness, showcasing Hong Kong's strengths and areas for improvement in the context of ESG finance.
Competitiveness, Financial markets, Hong Kong, ESG, Sustainability
false
Market Analysis and Trends
Financial Services
Table
PwC/Strategy&
Add to my slides
Remove from favorites
Two column charts comparing industry compliance costs and Credit Suisse compliance costs, with other performance metrics.
Regulatory and Compliance
Financial Services
The slide presents advanced technical capabilities to manage risk and compliance costs, showing industry and Credit Suisse comparisons.
Compliance costs, technical capabilities, risk management, industry comparison, performance metrics
false
Regulatory and Compliance
Financial Services
Multiple Chart
Credit Suisse
Add to my slides
Remove from favorites
The slide contains column chart, tables, and a bullet-pointed textual analysis. It uses shades of green for the bars and a mix of bold and standard text for emphasis.
Regulatory and Compliance
Financial Services
Displaying the escalating costs of compliance, the slide breaks down expenditures into regulatory project and routine compliance costs, alongside an analysis of historical spending trends.
Compliance, Regulatory, Cost, Analysis, Trend
false
Regulatory and Compliance
Financial Services
Mixed Chart
Morgan Stanley
Add to my slides
Remove from favorites
A slide with four horizontal blocks labeled 'Reputational Risk', 'Insider Threat', 'Surveillance', and 'Conduct', each with an arrow pointing to a list of specific strategies or tools related to the block's topic.
Regulatory and Compliance
Financial Services
Outlines key focus areas in compliance, such as reputational risk frameworks, insider threat committees, surveillance tools, and conduct guidelines, emphasizing continuous improvement. Ideal for compliance training sessions.
Compliance, Reputational Risk, Insider Threat, Surveillance, Conduct
false
Regulatory and Compliance
Financial Services
Header Vertical
Goldman Sachs
Add to my slides
Remove from favorites
Highlights types of computing hardware optimized for different ML tasks, like GPUs and TPUs.
Technology and Digital Transformation
Technology & Software
Focuses on hardware solutions for software interconnection and workload optimization in the ML process.
Computing hardware, GPUs, TPUs, NPUs, ML optimization
false
Technology and Digital Transformation
Technology & Software
Header Horizontal
McKinsey
Add to my slides
Remove from favorites
Contains three overlaid line charts under the header 'National Concession Rate by Class', representing classes A, B, and C. The slide uses distinct colors for each class, plotted across a timeline with monthly granularity. The data is well-organized, with the source referenced at the bottom.
Risk Assessment and Management
Real Estate & Construction
This slide is used for analyzing the trends of concession rates in multifamily housing across different property classes over time, which is relevant for investors and property managers assessing market conditions and risks.
Concession Rates, Property Classes, Market Trends, Multifamily Housing, Investment Risk, Data Analysis, Real Estate Market, Time Series, Performance Tracking
false
Risk Assessment and Management
Real Estate & Construction
Single Chart
Citigroup
Add to my slides
Remove from favorites
The slide includes a table with financial data and two line charts showing revenue and contribution margin trends for the conferences segment.
Market Analysis and Trends
Professional Services
It covers the financial performance of the conferences segment, including revenue growth, contribution margins, and the number of conferences and attendees.
Conferences, Revenue, Growth, Contribution Margin, Attendees, Segment Performance
false
Market Analysis and Trends
Professional Services
Multiple Chart
Gartner
Add to my slides
Remove from favorites
The slide features a column chart showing quarterly revenue and contribution margin along with text summarizing the mission and value of conferences.
Performance Metrics and KPIs
Professional Services
It highlights the value and engagement of conferences, showing revenue and margin trends, and aligns the content to the roles and functions served.
Conferences, value, audience, revenue, margin, engagement, mission, professional, performance, trends
false
Performance Metrics and KPIs
Professional Services
Multiple Chart
Gartner
Add to my slides
Remove from favorites
Previous
Next
You don't have any favorites yet.
Please wait loading your favorites slides...
Create a FREE account to continue browsing
Receive Instant Access to 7,500+ of the internet's best slides
First Name
Last Name
Email
Password
I agree to all
Terms & Privacy Policy
Thank you! Your submission has been received!
Oops! Something went wrong while submitting the form.
Have an account?
Sign in
Upgrade to PRO to Save slides
Advanced Search and Filters
Access to 8,000+ slides
Access to Category Pages
Save/Bookmark Slides
PowerPoint Template Library
(Coming Soon)
Pick a Plan
MONTHLY
$12/month
Billed every month, Cancel anytime.
YEARLY
$9/year
Billed $108 annually, Cancel anytime.
Checkout for $12/month
Checkout for $108/yr
Secured by Stripe | AES-256 bit encryption