My Account
My Slides
Search by Category
Companies
Slide Type
Use Case
Industry
Pricing
Templates
View All Templates
Download Template Slides
✦ AI
AI Prompt Library
AI Search
Feedback
Login
Logout
Get Started
Browse all Slides
Browse all Slides
Create a FREE Account
Instant access to 1,000+ real slides from top companies like McKinsey, BCG, Goldman Sachs, Google and many more!
First Name
Last Name
Email
Password
I agree to all
Terms & Privacy Policy
Thank you! Your submission has been received!
Oops! Something went wrong while submitting the form.
Have an account?
Sign in
Saved Slides
Total No. of slides saved
0
↻ Refresh
✖ Clear all
Diagram of agile principles and their impact on management, with color-coded sections and descriptive text.
Operational Efficiency
Professional Services
Details how agile methodologies influence manager and team dynamics, focusing on alignment, trust, and transparency, beneficial for implementing agile practices in companies.
agile methodology, team dynamics, management efficiency, organizational change, professional services, alignment, trust, transparency
false
Operational Efficiency
Professional Services
Diagram
BCG
Add to my slides
Remove from favorites
A bar graph displaying potential revenue increase from agility across various industries, with an 'Estimated average revenue lift' callout box.
Financial Performance
Professional Services
Details how adopting an agile business model is projected to impact revenue across different industries, with a focus on future growth.
Agile Model, Revenue Impact, Industry Comparison, Bar Graph, Future Growth
false
Financial Performance
Professional Services
Single Chart
Kearney
Add to my slides
Remove from favorites
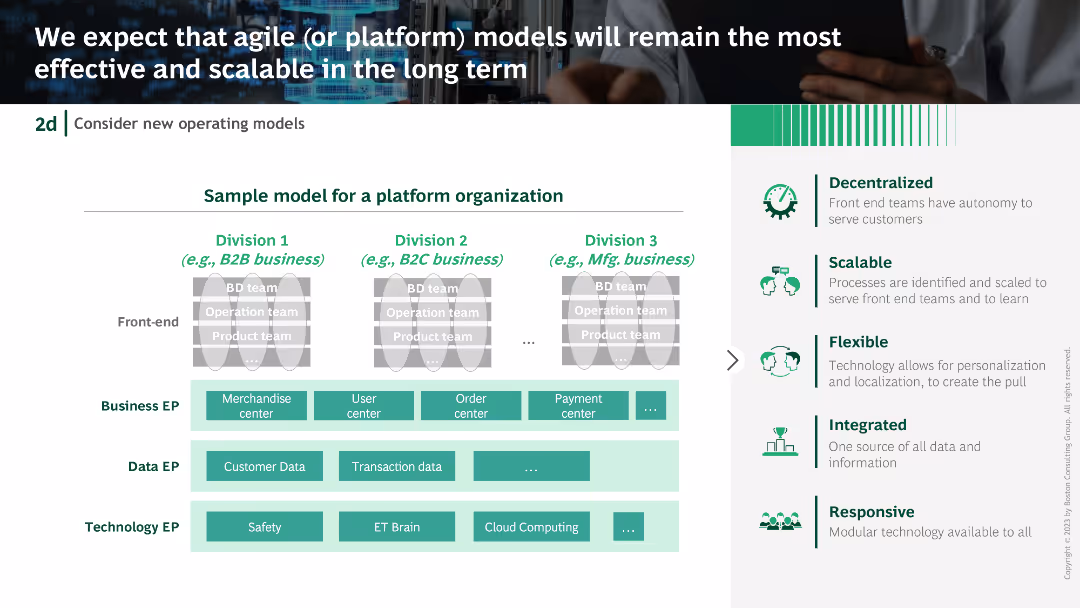
Platform organization model diagram with divisions and EP (Enterprise Processes) for business, data, and technology. Accompanied by descriptive text boxes and icons.
Operational Efficiency
Technology & Software
Advocates for agile or platform models for scalability and efficiency, presenting a sample model for a platform organization and its benefits.
agile models, platform organization, scalability, efficiency, enterprise processes
false
Operational Efficiency
Technology & Software
Table
BCG
Add to my slides
Remove from favorites
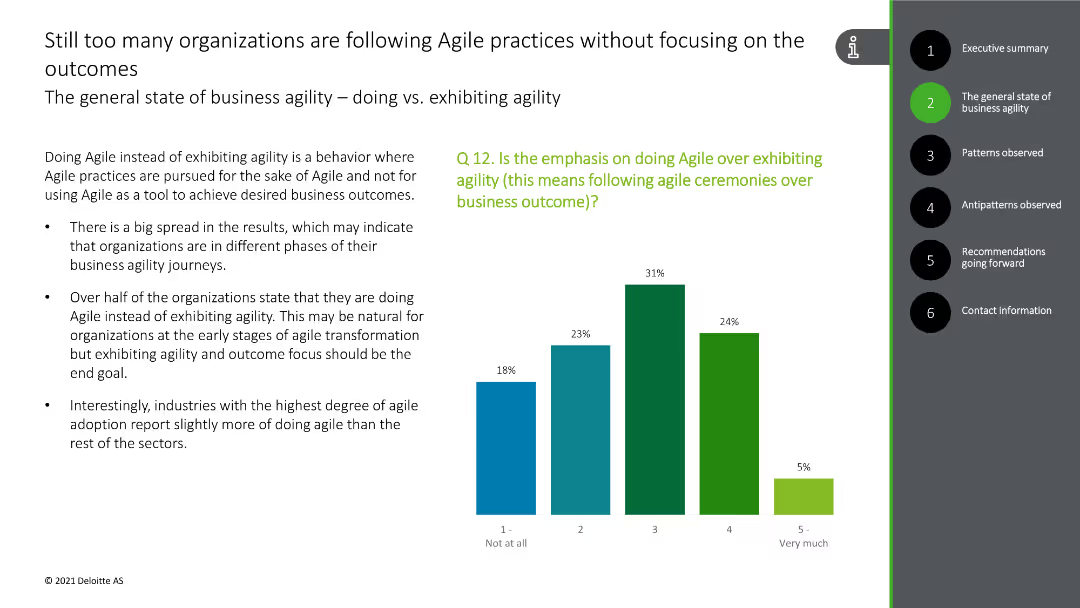
This slide contains a column chart showing the emphasis on following Agile ceremonies over outcomes, with green and blue bars.
Strategic Planning
Technology & Software
The slide discusses the focus on Agile practices rather than outcomes in many organizations, with survey data supporting this observation.
Agile practices, outcomes, focus, survey data, organizational behavior
false
Strategic Planning
Technology & Software
Mixed Chart
Deloitte
Add to my slides
Remove from favorites
A section header slide with a bold title "Chapter 3" on the left and supporting text on the right, accompanied by a column chart.
Strategic Planning
Financial Services
This slide introduces Chapter 3, discussing the future of agile risk management in banks, focusing on strategic shifts and leadership development.
agile risk management, future, strategic planning, leadership, chapter 3
false
Strategic Planning
Financial Services
Multiple Chart
EY
Add to my slides
Remove from favorites
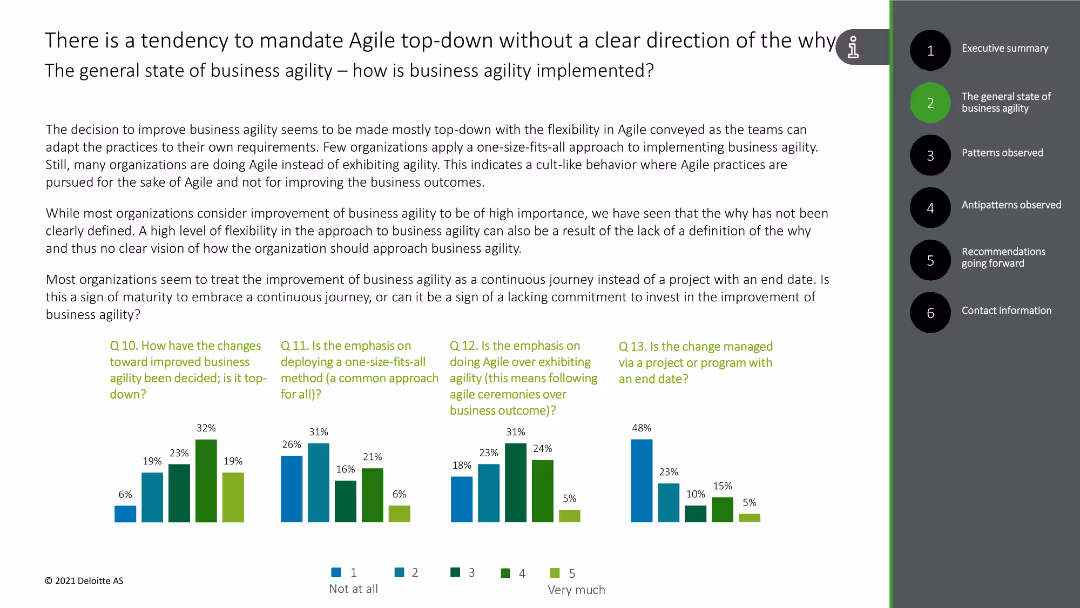
This slide includes a column chart depicting the approach towards business agility changes in organizations, with bars in green and blue.
Organizational Structure and Change
Technology & Software
The slide discusses the top-down mandate of Agile practices without clear articulation of the purpose, supported by survey data.
Agile, top-down, business agility, survey data, organizational change
false
Organizational Structure and Change
Technology & Software
Multiple Chart
Deloitte
Add to my slides
Remove from favorites
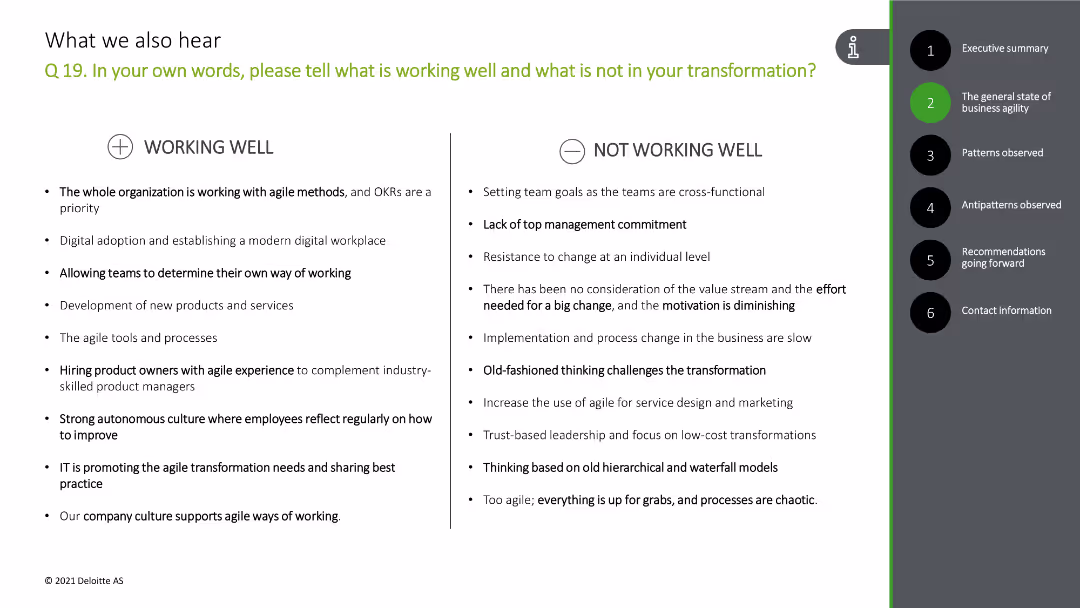
The slide has a comparative layout with two columns: "Working Well" and "Not Working Well." Each column lists several bullet points.
Risk Assessment and Management
Professional Services
This slide analyzes what is working well and what is not in the organization's transformation process based on client feedback.
agile, transformation, feedback, working well, challenges
false
Risk Assessment and Management
Professional Services
Header Horizontal
Deloitte
Add to my slides
Remove from favorites
Diagrams and icons illustrating changes in management behavior and career path strategies within agile frameworks.
Strategic Planning
Professional Services
Outlines the extensive changes required at individual and organizational levels to adopt agile, including new roles and learning paths, essential for strategic transformation initiatives.
agile transformation, management change, professional services, strategic planning, career paths, learning development, organizational change
false
Strategic Planning
Professional Services
Header Horizontal
BCG
Add to my slides
Remove from favorites
Pie charts showing survey results, text with bullet points and manifesto sections
Organizational Structure and Change
Professional Services
Discusses EY's approach to flexible work policies, survey results, and the EYManifesto
Agile work, flexibility, survey, manifesto, EY
false
Organizational Structure and Change
Professional Services
Multiple Chart
EY
Add to my slides
Remove from favorites
The slide features two column charts comparing 'Production Releases' and 'Improved App Ratings' over time, with annotations. On the right side, there's a text box listing awards and recognitions.
Financial Performance
Financial Services
Demonstrates increased agility in technology with a threefold increase in production releases and higher app ratings. It includes accolades such as innovation and model bank awards, implying industry recognition for technological advancements.
Agility, App Ratings, Awards, Recognition, Innovation, Technology
false
Financial Performance
Financial Services
Single Chart
Goldman Sachs
Add to my slides
Remove from favorites
Bar graph and quotes highlighting cultural and other barriers to organizational agility.
Operational Efficiency
Professional Services
Identifies and quantifies the main barriers to achieving agility in business, with cultural issues being the most significant.
Agility Barriers, Culture, Organizational Change, Bar Graph, Executive Quotes
false
Operational Efficiency
Professional Services
Mixed Chart
Kearney
Add to my slides
Remove from favorites
Bar graph comparison between 'Today' and '2026' expectations of business agility, accompanied by a pie chart indicating industry goals for agility.
Market Analysis and Trends
Media & Entertainment
Details executive insights on the need for agility in business processes and systems, forecasting changes by 2026.
Agility, Business Processes, Executive Survey, Future Forecasting, Industry Goals, Respondent Views
false
Market Analysis and Trends
Media & Entertainment
Mixed Chart
Kearney
Add to my slides
Remove from favorites
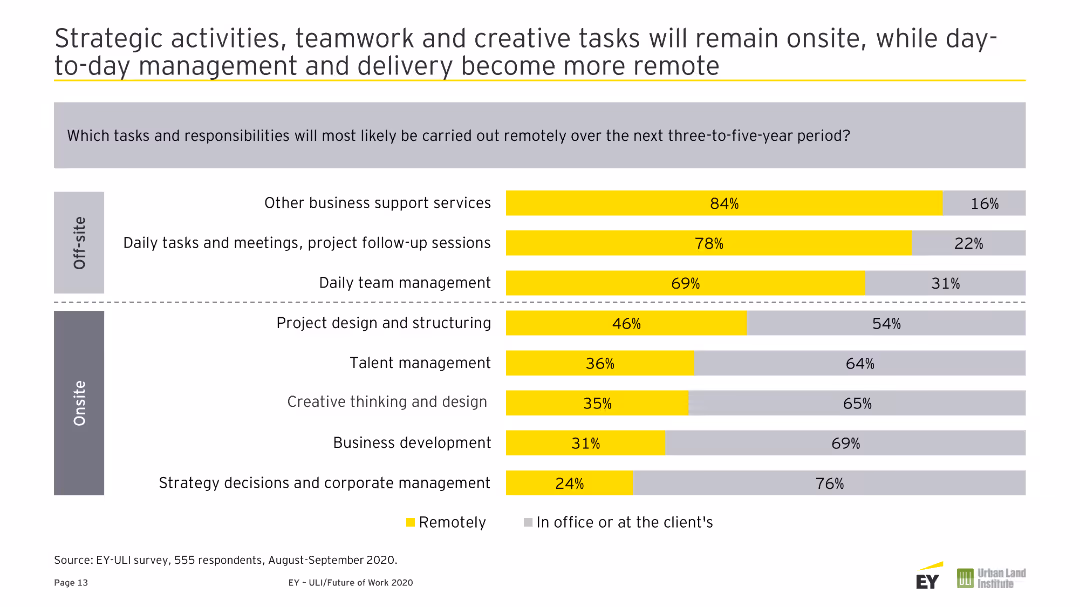
Column chart depicting potential benefits from the Future of Work. The right side of the slide contains two text quotes in gray boxes. Colors are primarily yellow and gray.
Strategic Planning
Real Estate & Construction
Highlights the top 5 benefits of the Future of Work, including increased work flexibility, reduced commuting, and better workplace environments.
Agility, Flexibility, Work, Corporate, Office, Real Estate, Environment, Commuting, Costs, Savings
false
Strategic Planning
Real Estate & Construction
Single Chart
EY
Add to my slides
Remove from favorites
Features a bar graph and breakout boxes highlighting the prioritization of agility by job titles and company size.
Market Analysis and Trends
Professional Services
Examines the priority levels that executives in different roles and company sizes place on achieving agility within their organizations.
Agility, Prioritization, Executives, Company Size, Bar Graph
false
Market Analysis and Trends
Professional Services
Single Chart
Kearney
Add to my slides
Remove from favorites
Features a couple of bar charts, clean design with blue and gray colors. Moderate text for explanations.
Human Resources and Talent Management
Professional Services
Focuses on factors impacting GBS footprint strategy and how organizations have added agility and resilience to their models.
Agility, resilience, GBS, business model, strategy
false
Human Resources and Talent Management
Professional Services
Multiple Chart
Deloitte
Add to my slides
Remove from favorites
Displaying a dynamic office scene, this slide emphasizes the agility of risk teams. It includes a text section detailing the benefits of enhancing flexibility in operations to respond more effectively to emerging risks. The visual portrays a team in an active discussion, suggesting a collaborative approach to agile risk management.
Operational Efficiency
Technology & Software
The slide outlines key steps for risk teams to improve their agility in managing business risks. It focuses on the adoption of new technologies, faster data processing, and stronger partnerships as means to enhance response capabilities to rapidly changing market conditions. This slide is valuable for organizations aiming to increase their operational flexibility and risk responsiveness.
agility, risk management, operational efficiency, technology adoption, partnerships, collaboration
false
Operational Efficiency
Technology & Software
Mixed Chart
Accenture
Add to my slides
Remove from favorites
Slide presents bar charts and descriptive text on a gradient background. The chart illustrates responses regarding speed, scope, and scale of transformation during uncertain times.
Operational Efficiency
Technology & Software
Discusses how companies in Growth Markets adapt to rapid changes and manage multiple transformations simultaneously. Useful for operational strategy sessions and discussions on business agility.
agility, transformation, Growth Markets, business strategy, operations management
false
Operational Efficiency
Technology & Software
Mixed Chart
Accenture
Add to my slides
Remove from favorites
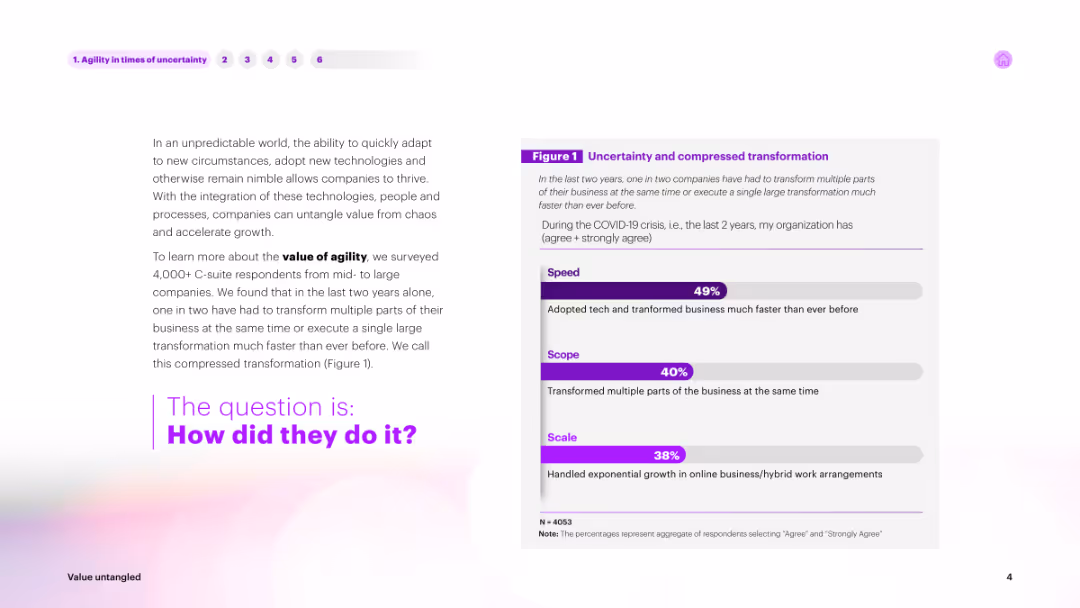
The slide includes a combination of text and a horizontal bar chart titled "Uncertainty and compressed transformation." The bars are in shades of purple, showing percentages for Speed, Scope, and Scale.
Operational Efficiency
Technology & Software
Discusses the importance of agility in an unpredictable world. Provides survey results from C-suite respondents about the value of agility, showing how companies adapted technology and transformed multiple business parts faster during COVID-19.
agility, uncertainty, transformation, survey, speed
false
Operational Efficiency
Technology & Software
Mixed Chart
Accenture
Add to my slides
Remove from favorites
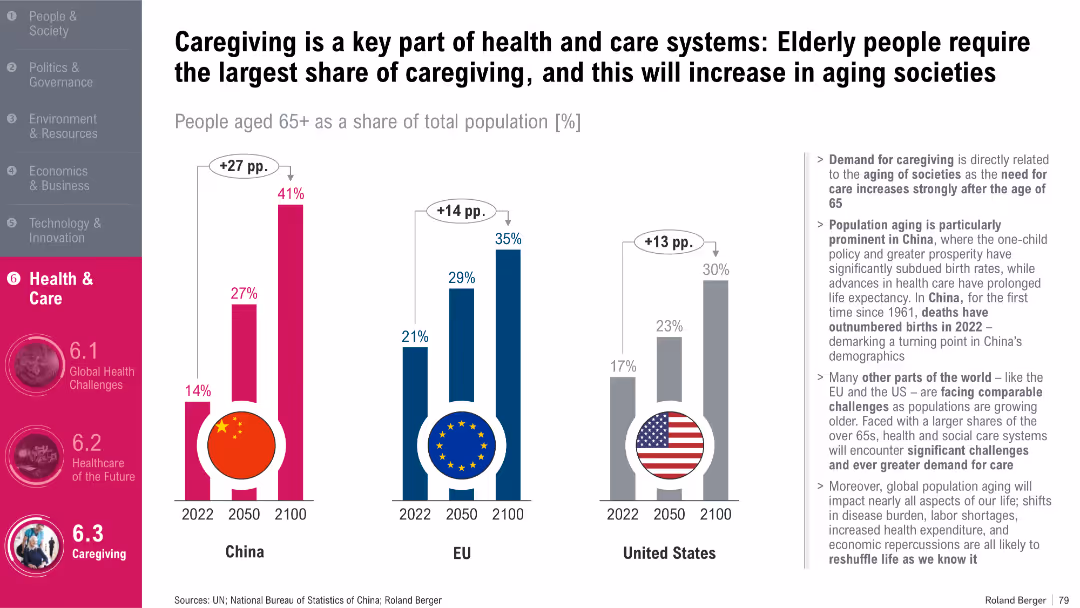
Three side-by-side bar graphs showing aging population projections; flag icons; summary text block
Human Resources and Talent Management
Healthcare & Pharmaceuticals
This slide visualizes the growing proportion of people aged 65+ in China, the EU, and the US through 2100. It explains that an aging population increases demand for caregiving services and highlights demographic trends that influence health system planning and workforce needs in elderly care.
Aging, Caregiving, Elderly, Demographics, Health Workforce
false
Human Resources and Talent Management
Healthcare & Pharmaceuticals
Multiple Chart
Roland Berger
Add to my slides
Remove from favorites
Contains multiple population pyramids showing the distribution of the world's population by age and sex in 2020 and projections for 2050, categorized by continent.
Market Analysis and Trends
Government & Public Sector
Examines changes in the global demographic structure, highlighting the growth of younger populations in Africa compared to aging populations in regions like Europe and North America. Offers insights into future societal and economic impacts of these trends.
aging, demographics, Africa, Europe, population pyramid
false
Market Analysis and Trends
Government & Public Sector
Multiple Chart
Roland Berger
Add to my slides
Remove from favorites
Displays column charts and maps illustrating the old-age dependency ratio and median age by region for 2020 and 2050.
Market Analysis and Trends
Government & Public Sector
Focuses on the increasing old-age dependency ratio worldwide, particularly in developed regions, and discusses the challenges and policy implications for healthcare, pensions, and labor markets.
aging, dependency ratio, policy, healthcare, demographics
false
Market Analysis and Trends
Government & Public Sector
Multiple Chart
Roland Berger
Add to my slides
Remove from favorites
The slide presents column charts and statistics on the aging of the global population, focusing on the median age increase and the shift in population age structures between 2020 and 2050.
Market Analysis and Trends
Healthcare & Pharmaceuticals
Highlights the increase in global median age and the expected demographic shifts that will place more demand on healthcare systems and affect global workforce dynamics.
aging, healthcare, demographics, median age, global trends
false
Market Analysis and Trends
Healthcare & Pharmaceuticals
Mixed Chart
Roland Berger
Add to my slides
Remove from favorites
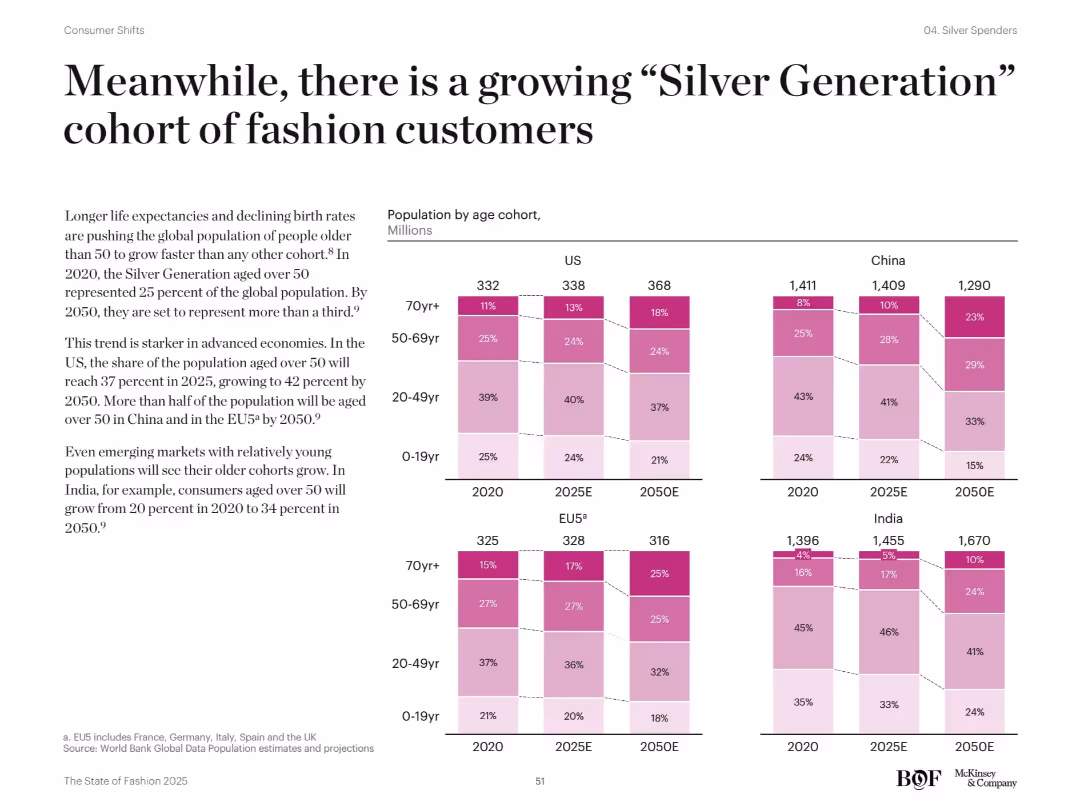
Full-width bar chart with age cohorts across countries (US, EU5, China, India) from 2020–2050. Left-aligned narrative text explains demographic trends. Pink gradient tones indicate age brackets.
Market Analysis and Trends
Retail & E-commerce
Shows population aging across regions and highlights the rapid growth of those over 50. Discusses implications for fashion brands, with China and EU5 expected to have over half of the population aged 50+ by 2050.
aging population, demographics, Silver Generation, global trends, fashion consumers
false
Market Analysis and Trends
Retail & E-commerce
Mixed Chart
McKinsey
Add to my slides
Remove from favorites
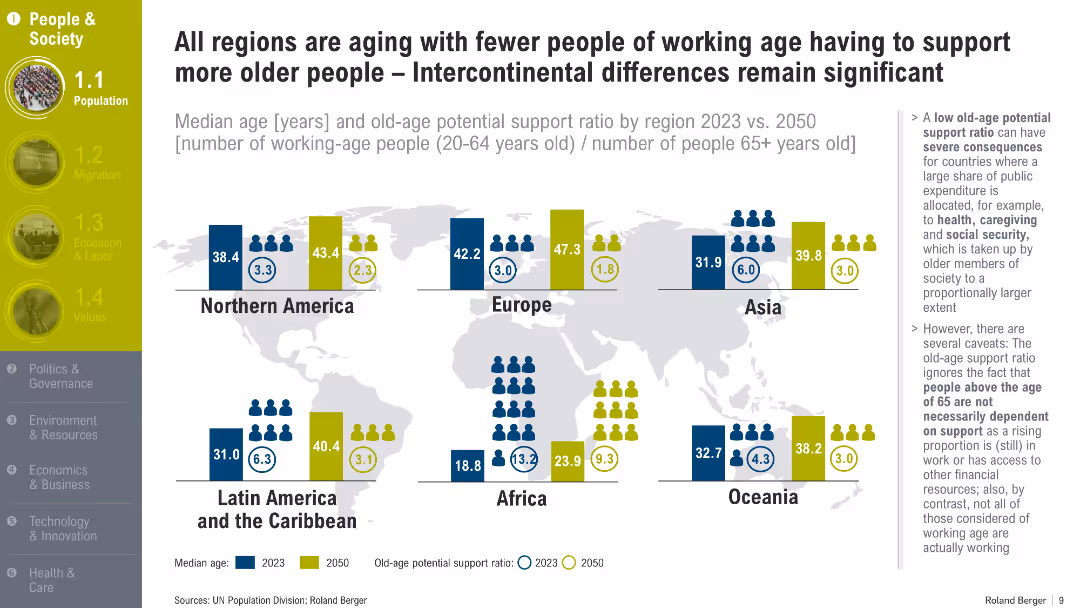
Regional map with median age and support ratio figures (2023 vs. 2050); visualized with icon sets and numeric values
Human Resources and Talent Management
Government & Public Sector
This slide highlights aging demographics globally, showing rising median ages and declining support ratios across continents. It emphasizes the increasing economic burden on working-age populations to support elderly populations by 2050.
Aging Population, Support Ratio, Median Age, 2050, Global Demographics, Workforce, Social Impact
false
Human Resources and Talent Management
Government & Public Sector
Mixed Chart
Roland Berger
Add to my slides
Remove from favorites
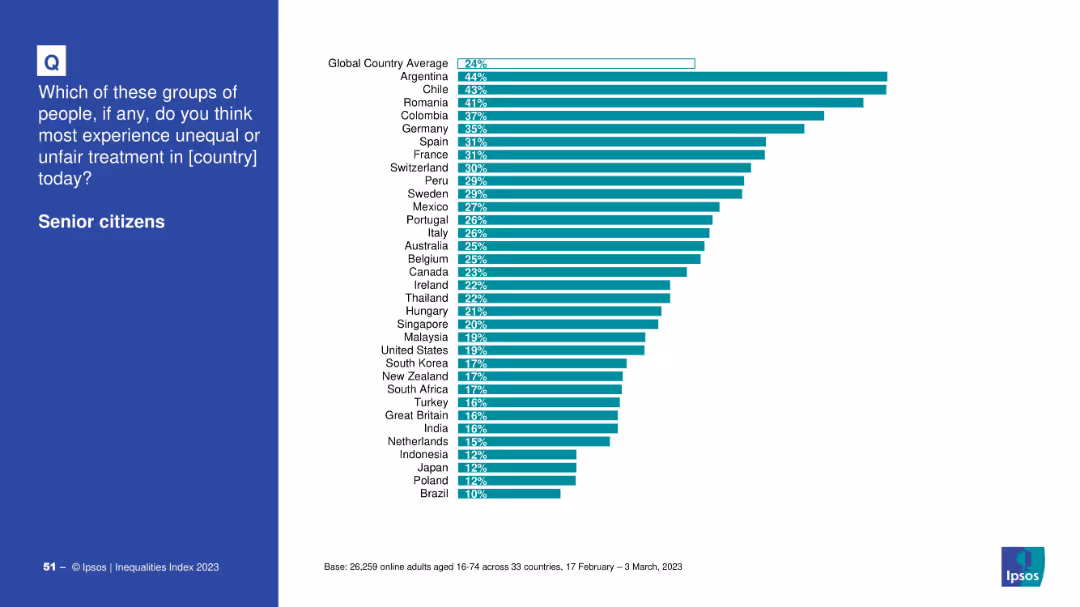
Country comparison bar chart on white background with global average line
Market Analysis and Trends
Government & Public Sector
This slide highlights the perceived inequality faced by senior citizens in various countries. Argentina, Chile, and Romania top the list, while Brazil and Poland are at the bottom. The global average perception is 24%.
aging, senior citizens, inequality, country ranking, Ipsos, discrimination, public perception, 2023
false
Market Analysis and Trends
Government & Public Sector
Mixed Chart
IPSOS
Add to my slides
Remove from favorites
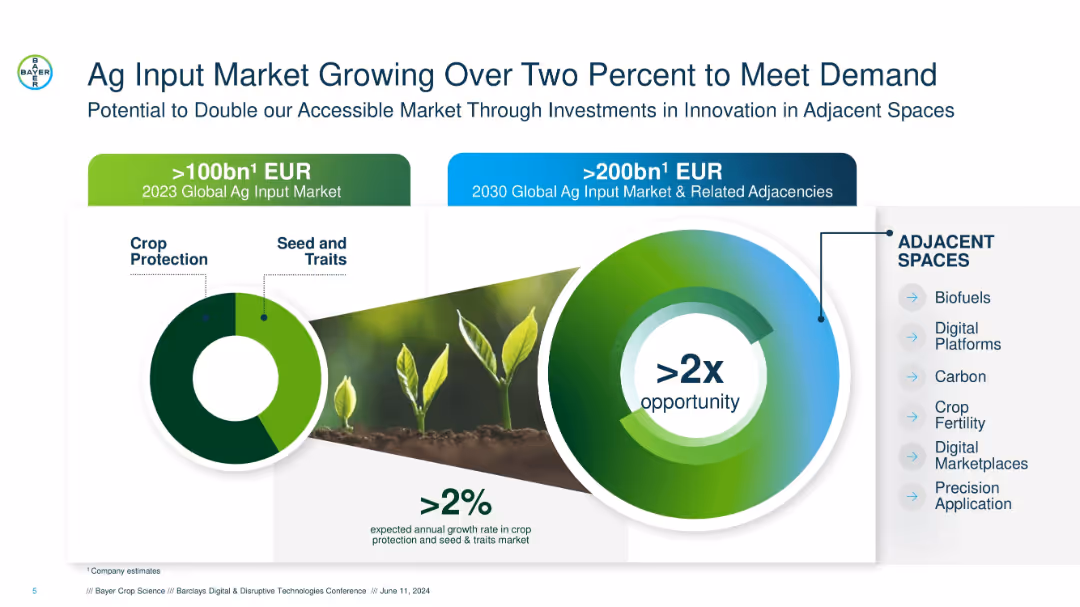
Split layout with two radial charts, plant imagery, and icons. Green and blue color scheme with bold headings.
Market Analysis and Trends
Agriculture & Food Production
Highlights the projected doubling of the agricultural input market by 2030, emphasizing >2x opportunity via innovations and adjacent investments like biofuels, digital platforms, and crop fertility.
ag inputs, crop protection, growth rate, adjacent markets, seed traits, digital platforms, 2030 projection, >2x market
false
Market Analysis and Trends
Agriculture & Food Production
Mixed Chart
Barclays
Add to my slides
Remove from favorites
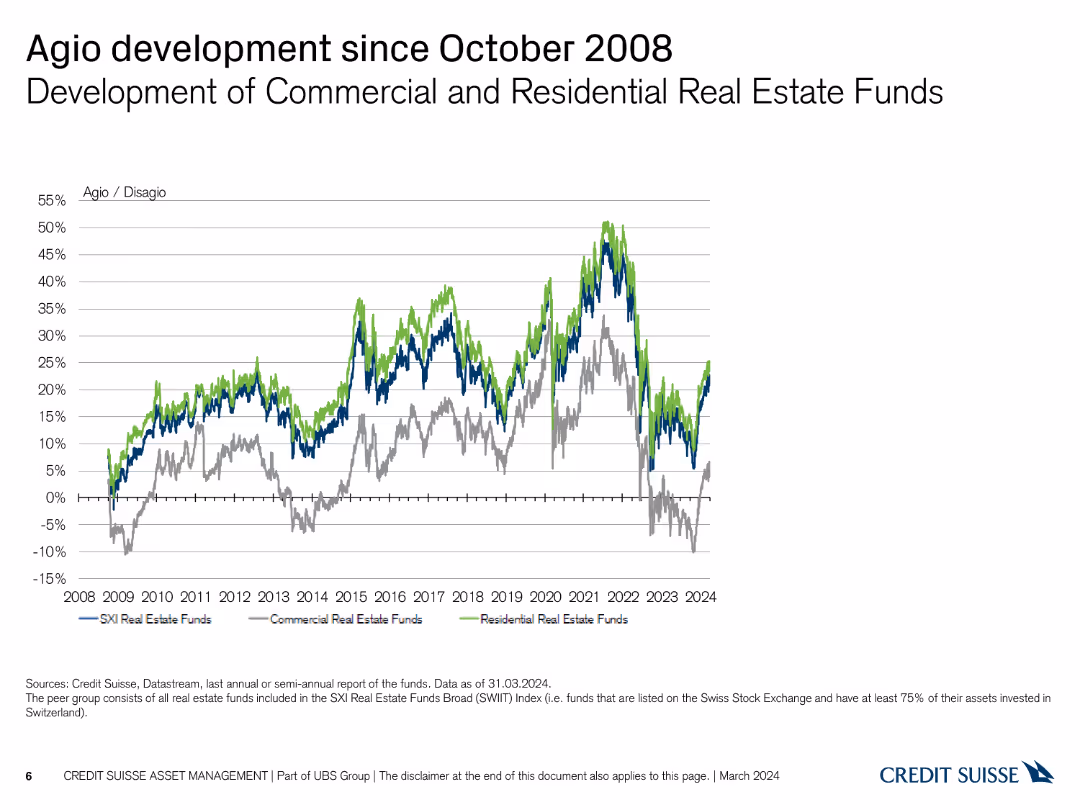
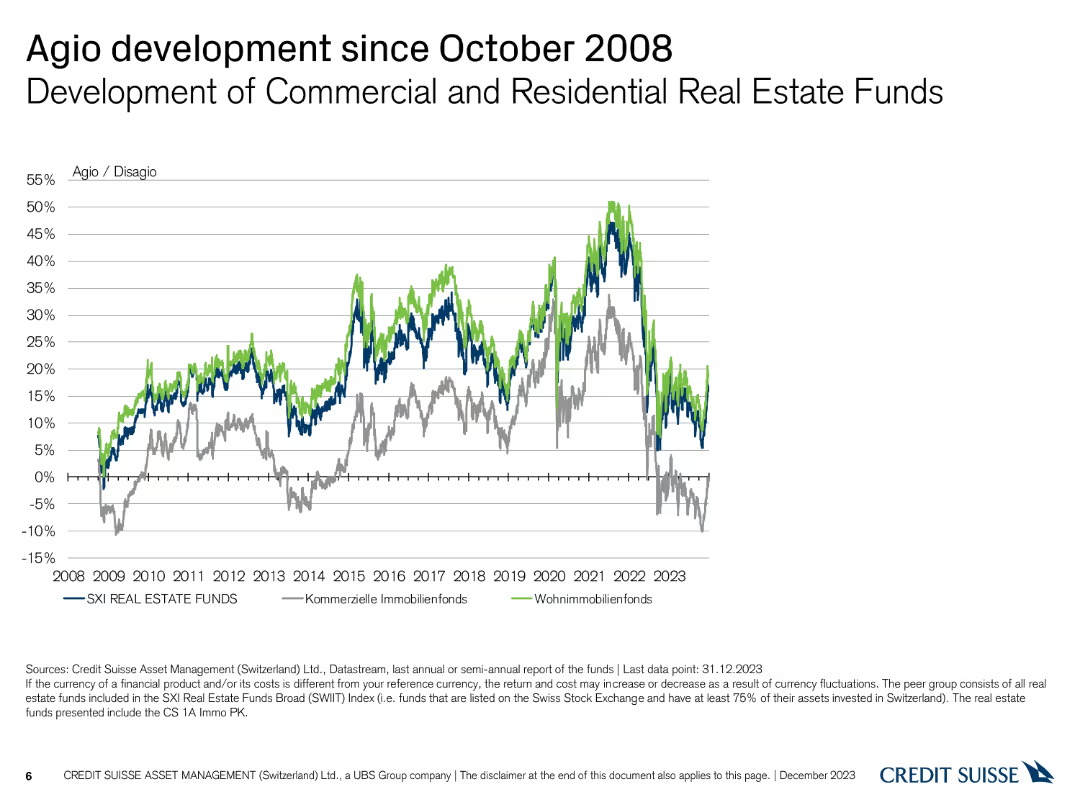
The slide shows a line chart with three lines representing the development of agio/disagio for different types of real estate funds from 2008 to 2024, using blue, green, and grey.
Market Analysis and Trends
Real Estate & Construction
This slide compares the performance of commercial, residential, and SXI Real Estate funds in terms of agio/disagio rates since the financial crisis of 2008.
agio, disagio, commercial, residential, comparison
false
Market Analysis and Trends
Real Estate & Construction
Single Chart
Credit Suisse
Add to my slides
Remove from favorites
A line chart showing the development of Agio/Disagio percentages for commercial and residential real estate funds, with multiple colored lines.
Market Analysis and Trends
Financial Services
This slide presents the Agio/Disagio development for Swiss commercial and residential real estate funds from 2008 to 2023, highlighting significant market shifts.
Agio, Disagio, Commercial, Residential, Trends
false
Market Analysis and Trends
Financial Services
Single Chart
Credit Suisse
Add to my slides
Remove from favorites
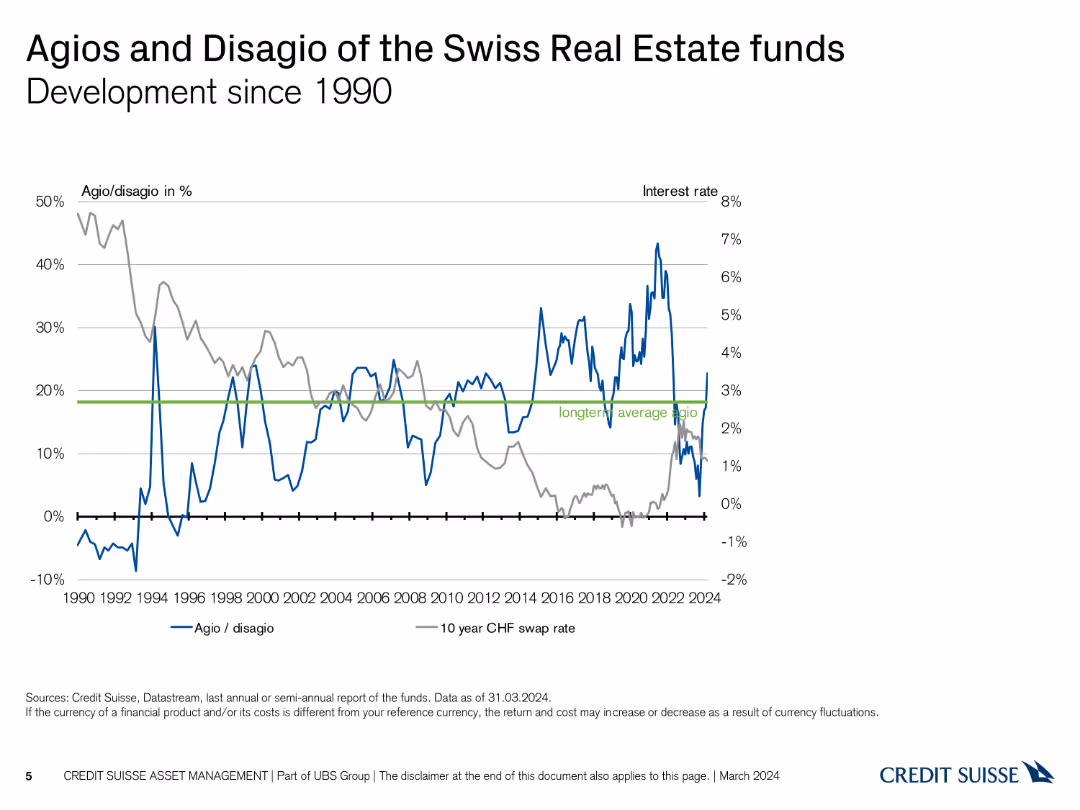
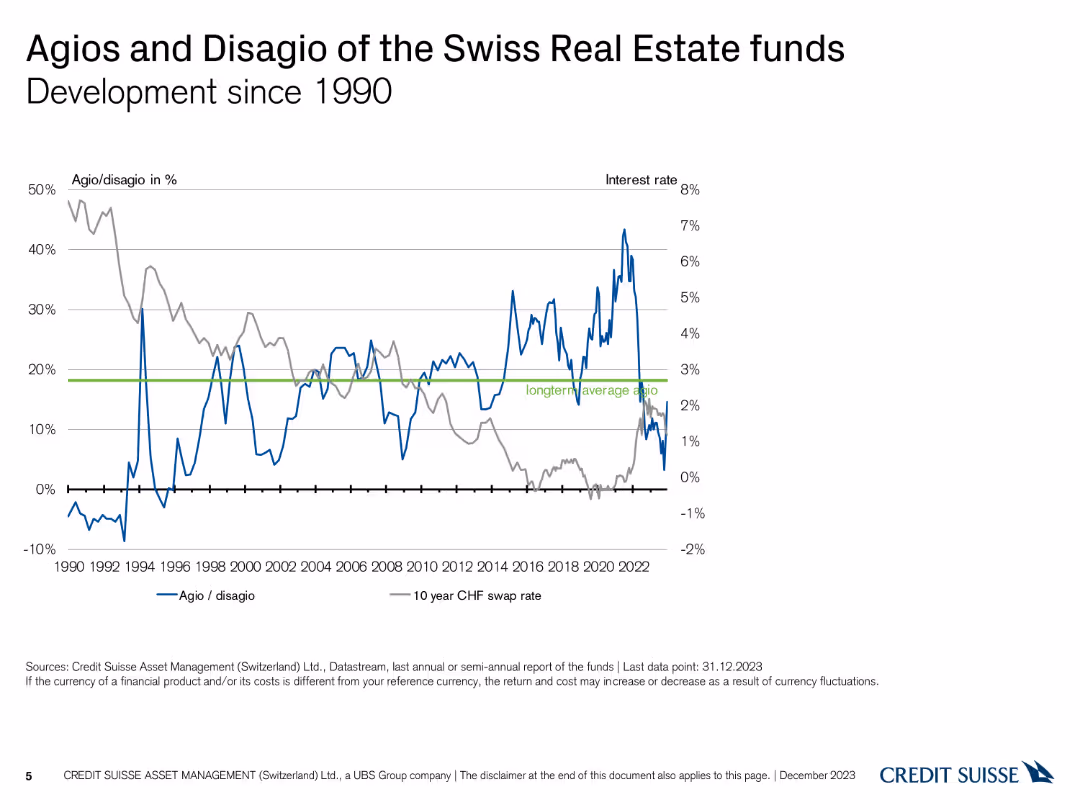
The slide features a line chart showing the development of agio/disagio percentages and interest rates over time, from 1990 to 2024. The chart uses blue and grey lines.
Market Analysis and Trends
Real Estate & Construction
This slide provides a historical overview of the agios and disagios of Swiss Real Estate funds in relation to interest rates, tracking changes over more than three decades.
agio, disagio, development, interest rates, timeline
false
Market Analysis and Trends
Real Estate & Construction
Single Chart
Credit Suisse
Add to my slides
Remove from favorites
A line chart comparing Agio/Disagio percentages and interest rates over time, with separate lines for each metric and key dates highlighted.
Financial Performance
Financial Services
This slide tracks the historical development of Agio/Disagio percentages and interest rates for Swiss real estate funds since 1990, showing key trends and fluctuations.
Agio, Disagio, Historical Data, Interest Rates, Trends
false
Financial Performance
Financial Services
Single Chart
Credit Suisse
Add to my slides
Remove from favorites
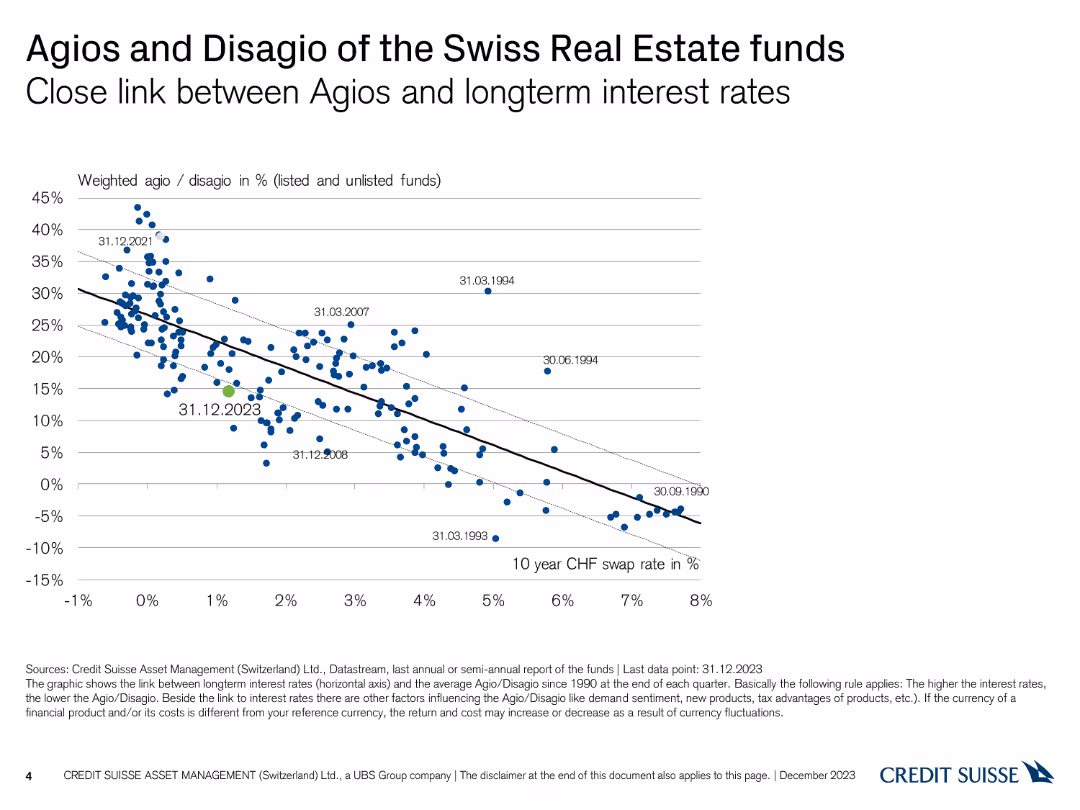
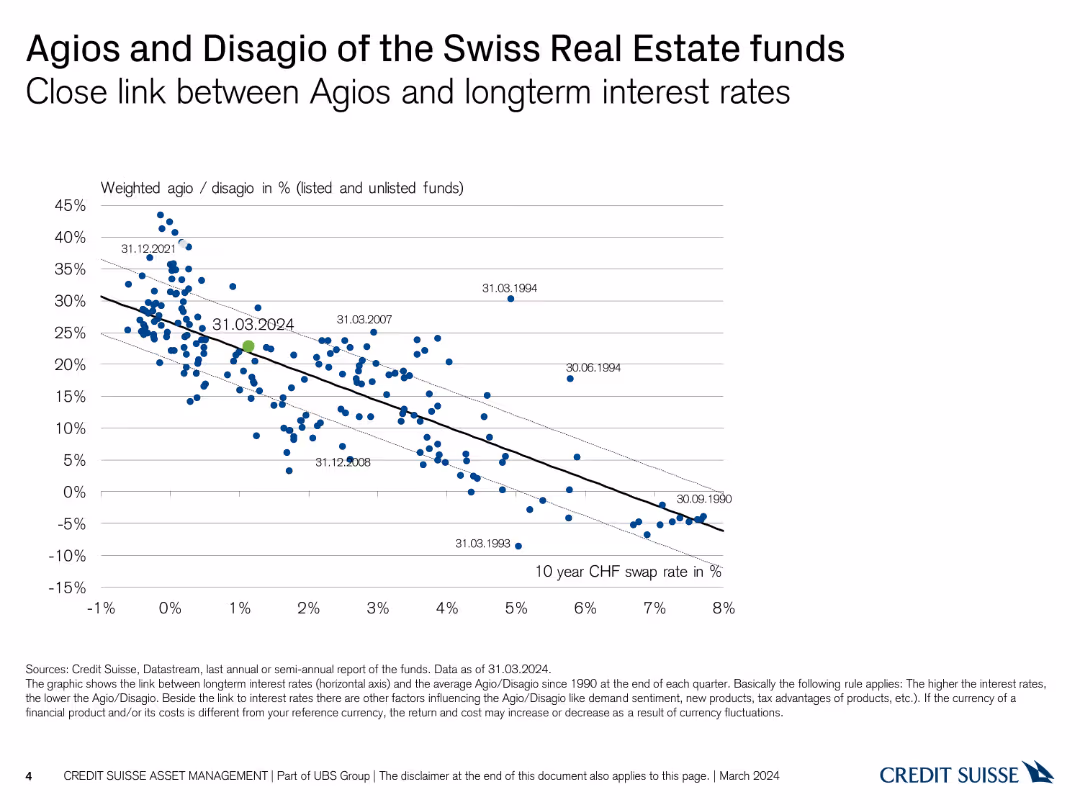
A scatter plot showing the relationship between Agio/Disagio percentages and long-term interest rates, with a trend line illustrating the correlation.
Financial Performance
Financial Services
This slide demonstrates the correlation between the Agio/Disagio percentages of Swiss real estate funds and long-term interest rates, based on data since 1990.
Agio, Disagio, Interest Rates, Correlation, Funds
false
Financial Performance
Financial Services
Single Chart
Credit Suisse
Add to my slides
Remove from favorites
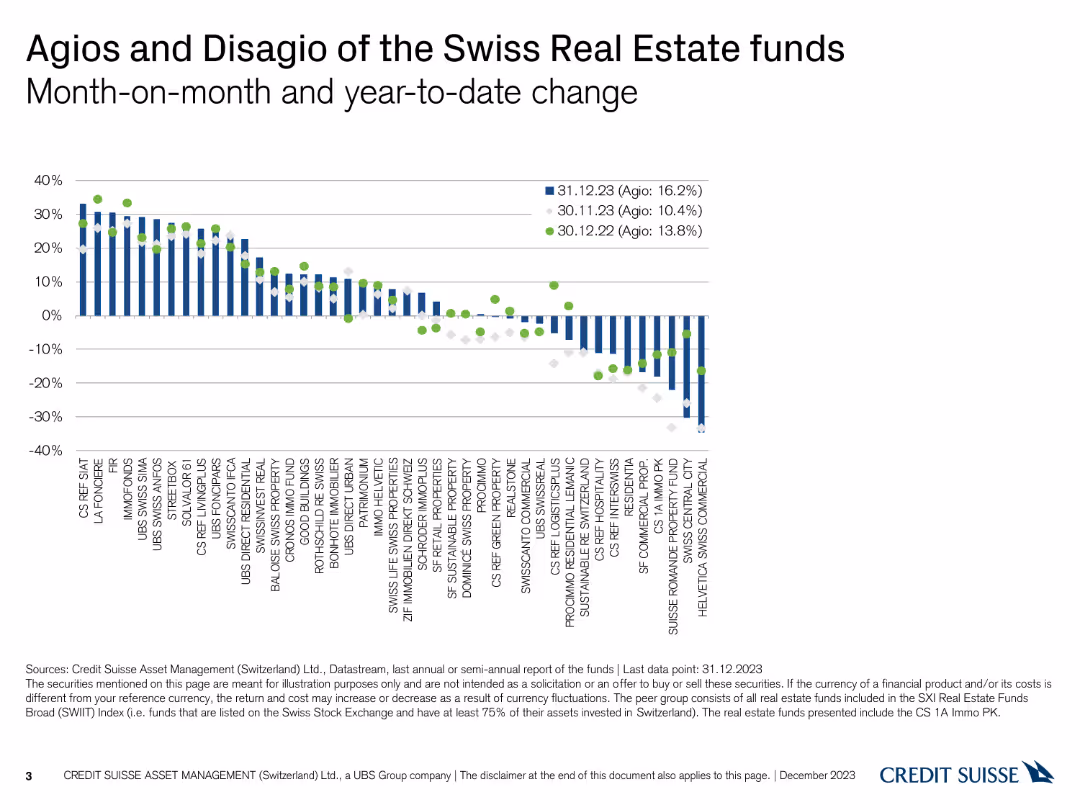
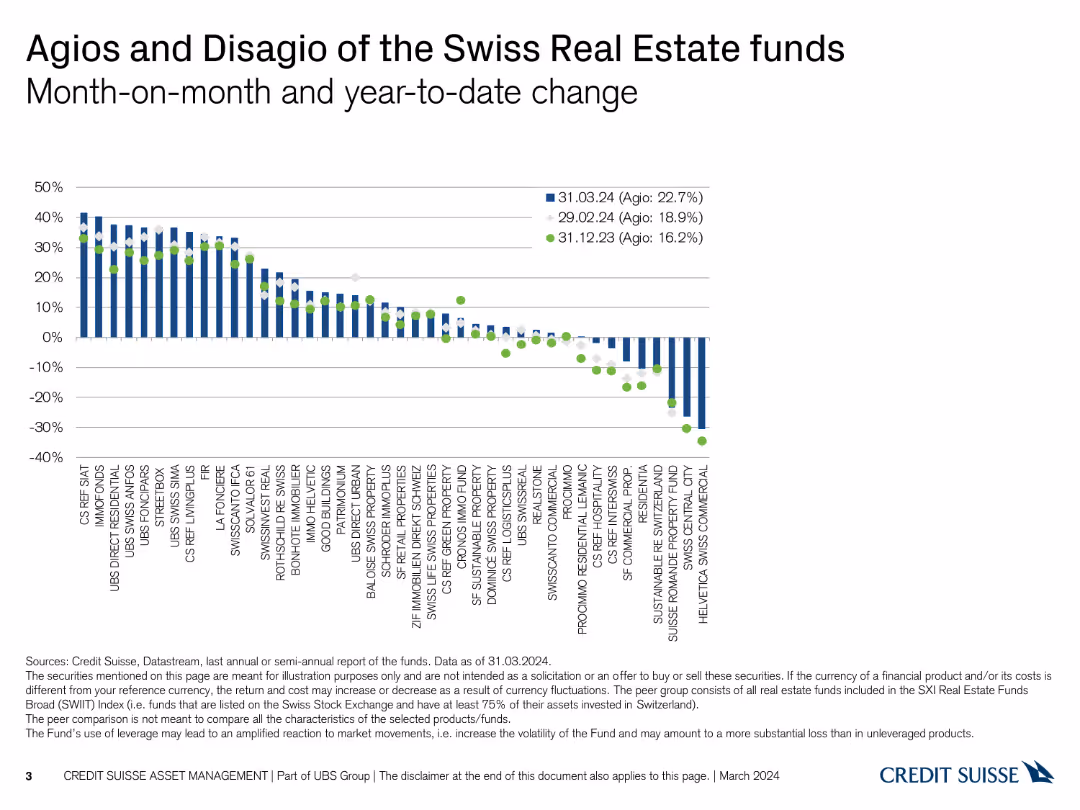
A column chart depicting month-on-month and year-to-date changes in Agio and Disagio percentages for Swiss real estate funds with three data points.
Financial Performance
Financial Services
This slide shows the month-on-month and year-to-date changes in the Agio and Disagio of various Swiss real estate funds, comparing data from three different dates.
Agio, Disagio, Month-on-Month, Year-to-Date, Funds
false
Financial Performance
Financial Services
Single Chart
Credit Suisse
Add to my slides
Remove from favorites
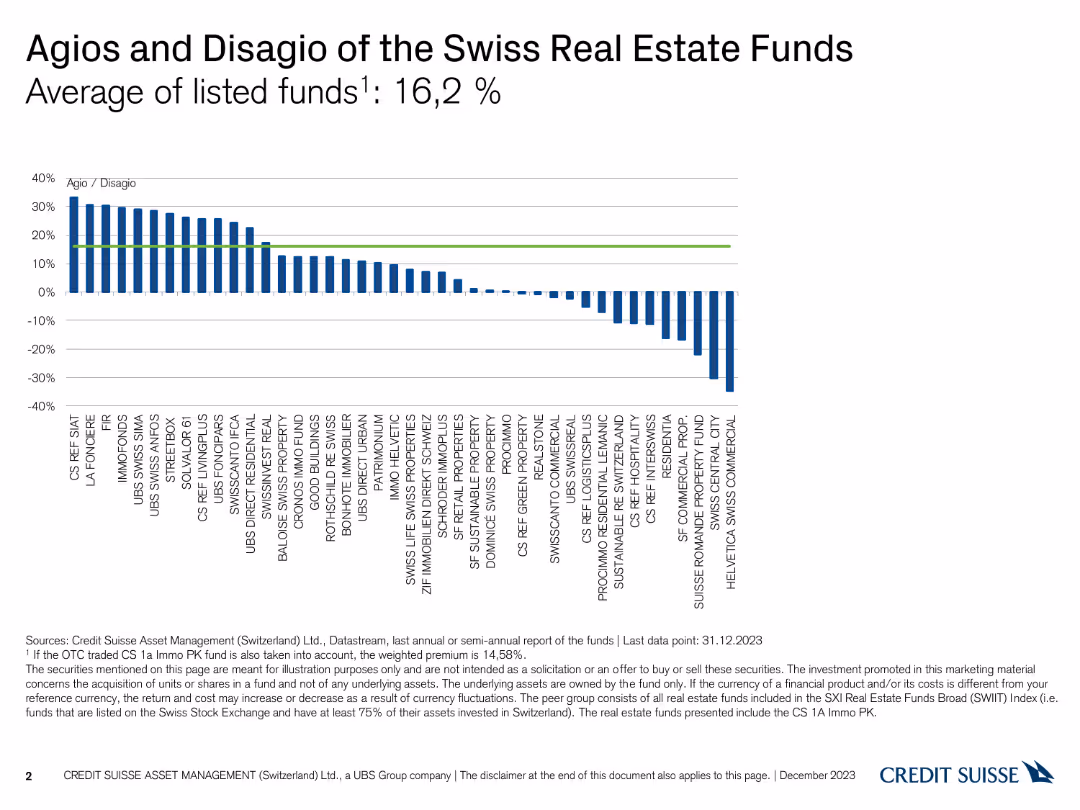
A column chart showing the Agio and Disagio percentages of various Swiss real estate funds, with bars extending above and below a zero line.
Financial Performance
Financial Services
This slide illustrates the Agio (premium) and Disagio (discount) of different Swiss real estate funds as of December 31, 2023, highlighting an average of 16.2%.
Agio, Disagio, Real Estate Funds, Premium, Discount
false
Financial Performance
Financial Services
Single Chart
Credit Suisse
Add to my slides
Remove from favorites
The slide shows a scatter plot with a trend line, displaying the relationship between agios/disagio and long-term interest rates from 1990 to 2024. The data points are in blue.
Financial Performance
Real Estate & Construction
This slide analyzes the correlation between agios/disagio rates of Swiss Real Estate funds and long-term interest rates. It is used to assess the impact of interest rates on fund performance.
agios, disagio, interest rates, real estate, trend line
false
Financial Performance
Real Estate & Construction
Single Chart
Credit Suisse
Add to my slides
Remove from favorites
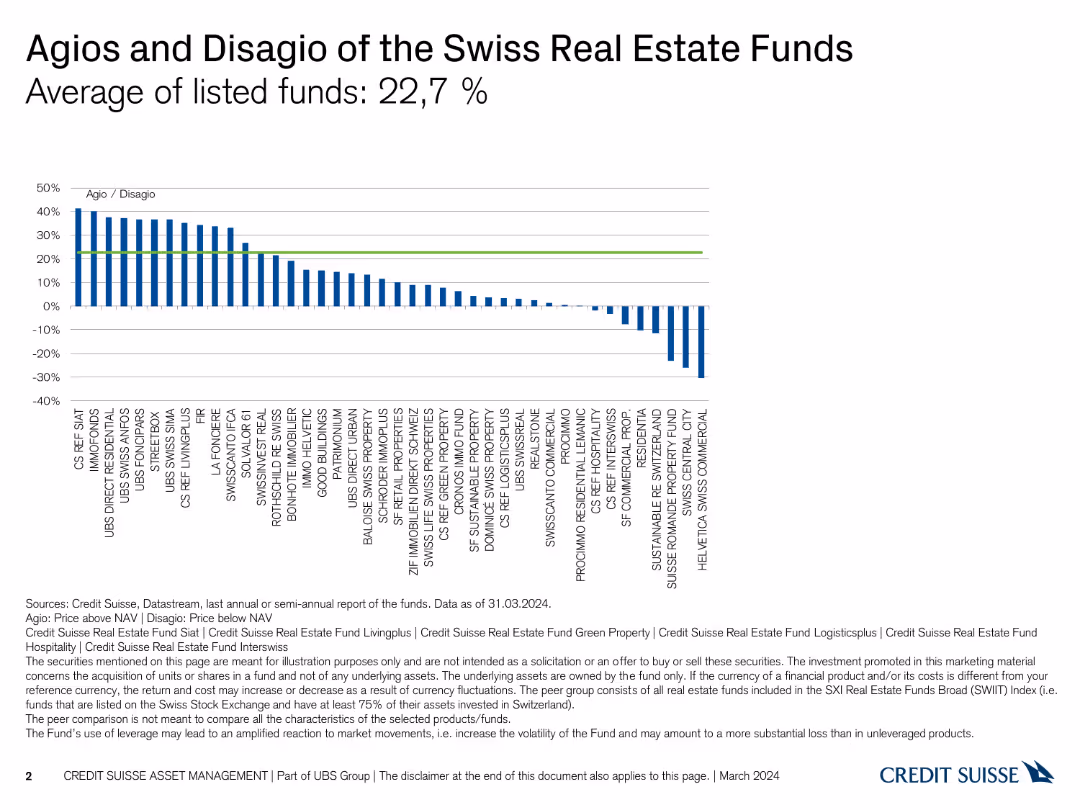
The slide includes a column chart showing agios and disagio of various Swiss real estate funds. It is moderately complex with clear visual data representation.
Investment Analysis
Real Estate & Construction
The slide analyzes the average agios and disagio of Swiss real estate funds, providing insights into fund performance as of March 2024.
agios, disagio, real estate, funds, performance
false
Investment Analysis
Real Estate & Construction
Single Chart
Credit Suisse
Add to my slides
Remove from favorites
The slide includes a column chart with additional month-on-month and year-to-date changes indicated by different markers. It is moderately complex with detailed visual data.
Investment Analysis
Real Estate & Construction
The slide compares agios and disagio of Swiss real estate funds with month-on-month and year-to-date changes, providing a comprehensive performance overview.
agios, disagio, real estate, funds, performance, changes
false
Investment Analysis
Real Estate & Construction
Single Chart
Credit Suisse
Add to my slides
Remove from favorites
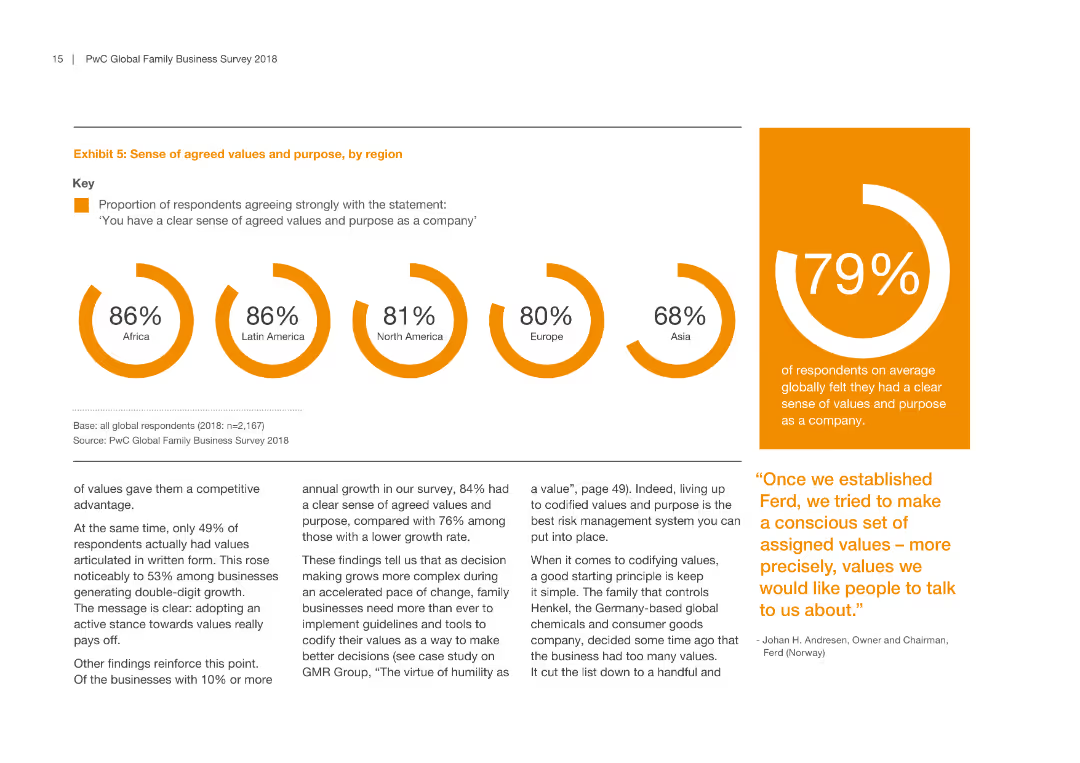
Features a bar graph showing the percentage of respondents agreeing strongly with the statement regarding agreed values and purpose, segmented by region.
Strategic Planning
Professional Services
This slide emphasizes the importance of agreed values and purpose within companies, with data segmented by geographic region to show regional differences.
agreed values, purpose, regional differences, company culture, strategic alignment
false
Strategic Planning
Professional Services
Multiple Chart
PwC/Strategy&
Add to my slides
Remove from favorites
This slide features horizontal bar charts comparing percentages of agreement and disagreement on various social statements. A table highlights the highest and lowest agreement countries.
Market Analysis and Trends
Government & Public Sector
The slide discusses the belief in "live and let live" across different countries, illustrating tensions and divisions. It also shows where agreement is highest and lowest for these beliefs.
agreement, social beliefs, live and let live, tensions, divisions, countries, percentage, bar chart, highest, lowest
false
Market Analysis and Trends
Government & Public Sector
Mixed Chart
IPSOS
Add to my slides
Remove from favorites
The slide has multiple bar graphs, a legend for input and equipment providers, and a concentration index at the bottom.
Market Analysis and Trends
Agriculture & Food Production
The slide provides a detailed look into the ag retailer space, showing market concentration and naming major retailers and cooperatives. It is useful for understanding the revenue distribution and market share among different agricultural players.
ag retailers, consolidation, market concentration, cooperatives, revenue, market share, distribution, bar graph
false
Market Analysis and Trends
Agriculture & Food Production
Mixed Chart
EY
Add to my slides
Remove from favorites
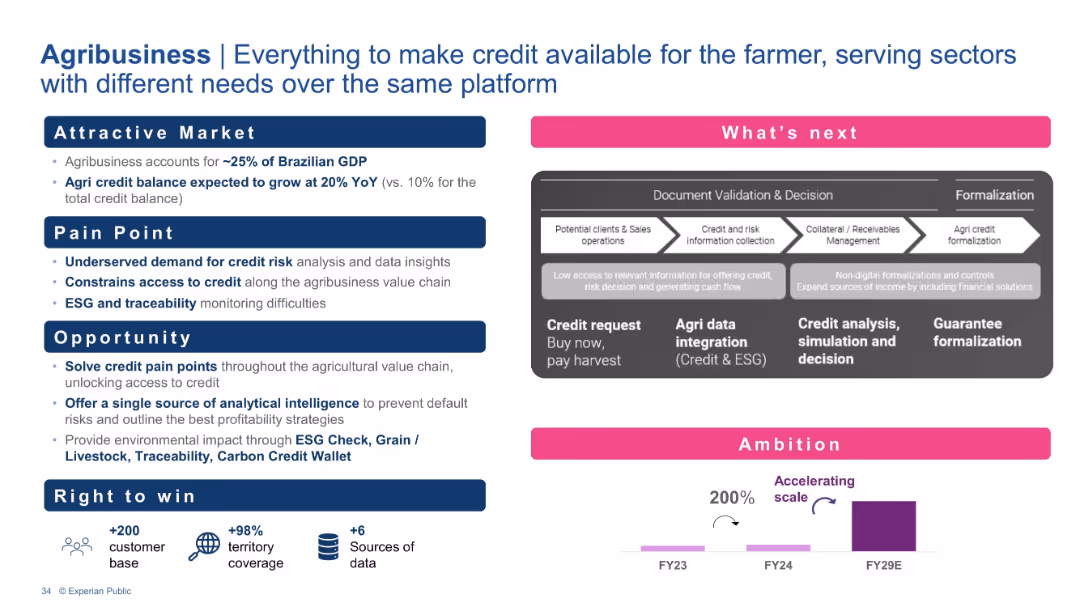
Structured in classic pain-point/opportunity format with flowchart showing the agri-credit process. Metrics and ambition chart below.
Product and Service Analysis
Agriculture & Food Production
This slide focuses on Experian's agribusiness strategy. It highlights the underserved market in credit access and ESG data, and introduces a platform to support end-to-end agri-credit processing. Growth is driven by credit analytics, ESG intelligence, and data validation services.
Agribusiness, Credit access, ESG, Traceability, Platform integration, Rural finance, Agri credit
false
Product and Service Analysis
Agriculture & Food Production
Mixed Chart
Barclays
Add to my slides
Remove from favorites
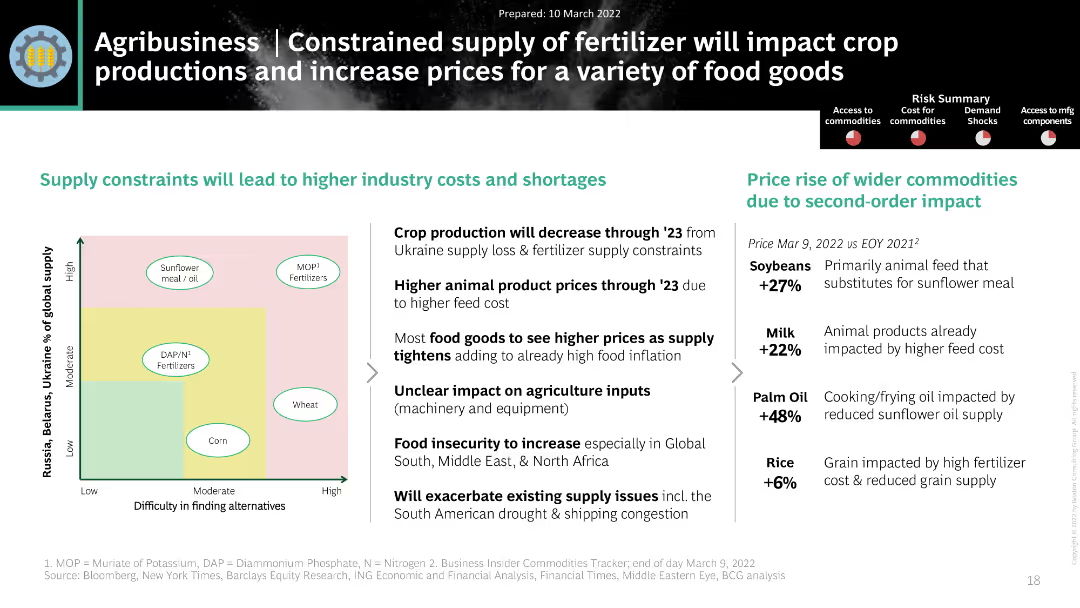
The slide includes a matrix chart and a column chart showing commodity price rises. The layout is moderately dense.
Market Analysis and Trends
Agriculture & Food Production
It discusses the constrained supply of fertilizers from Ukraine and its impact on crop production and prices of food goods.
Agribusiness, Fertilizers, Crop Production, Prices, Ukraine
false
Market Analysis and Trends
Agriculture & Food Production
Header Horizontal
BCG
Add to my slides
Remove from favorites
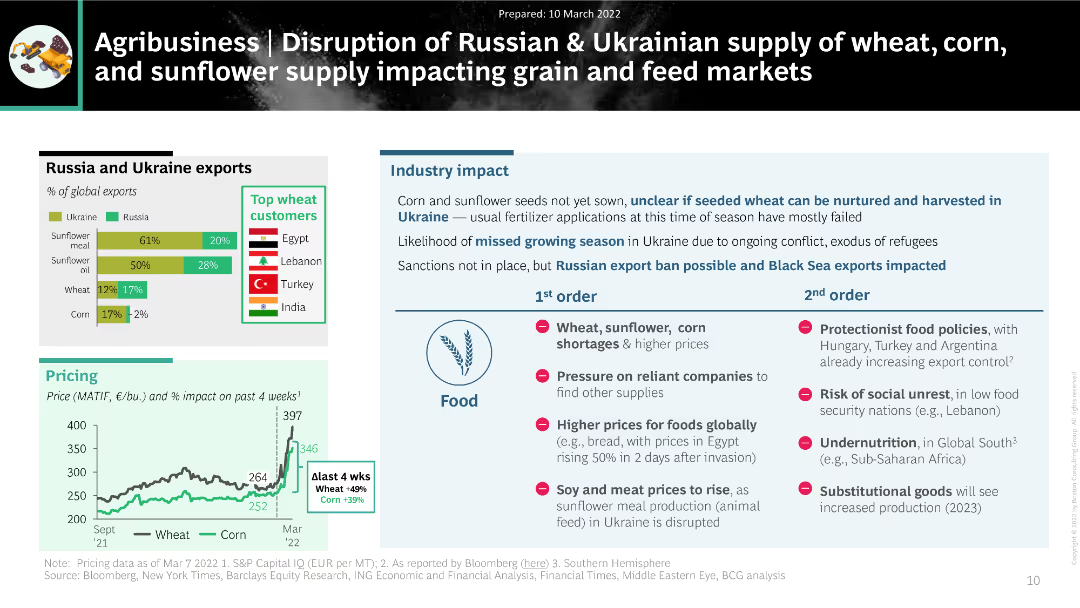
The slide uses a combination of bar charts and text to present the impact of disrupted Russian and Ukrainian exports of wheat, corn, and sunflower on global agribusiness markets.
Market Analysis and Trends
Agriculture & Food Production
The slide discusses the significant impact of disrupted grain and sunflower supply from Russia and Ukraine on global agribusiness. It highlights export percentages, top customers, and potential industry impacts, including food shortages and price increases.
agribusiness, supply disruption, wheat, corn, sunflower, exports
false
Market Analysis and Trends
Agriculture & Food Production
Multiple Chart
BCG
Add to my slides
Remove from favorites
The slide features a diagram and detailed table presenting the total potential of agricultural residues for energy production by 2060, including theoretical, technical, and sustainable potentials, and various factors affecting its scalability and sustainability constraints.
Technology and Digital Transformation
Energy & Utilities
This slide provides a deep-dive into the potential of agricultural residues as a feedstock for energy production, analyzing its total potential by 2060 and highlighting the scalability issues and sustainability constraints associated with its use.
agricultural residues, feedstock, total potential, energy production, 2060, scalability, sustainability constraints
false
Technology and Digital Transformation
Energy & Utilities
Mixed Chart
Kearney
Add to my slides
Remove from favorites
Bullet points and icons, with a blue and white color scheme, focused on agriculture.
Risk Assessment and Management
Agriculture & Food Production
Analyzes the impact of bioengineering on agricultural practices and food production.
Agriculture, Bioengineering, Food Production, Impact Analysis
false
Risk Assessment and Management
Agriculture & Food Production
Header Horizontal
McKinsey
Add to my slides
Remove from favorites
The title slide for a presentation with a vivid background image of a wheat field, the logos of EY and Parthenon, and the names of two managing directors.
Industry Overview
Agriculture & Food Production
This introductory slide sets the theme for a presentation on investing in the agricultural crop industry, likely to be part of a broader discussion on investment opportunities and strategies within the agriculture sector. The visual backdrop of crops establishes the industry context.
Agriculture, Crop Industry, Investment, EY-Parthenon, Managing Directors, Overview
false
Industry Overview
Agriculture & Food Production
Title
EY
Add to my slides
Remove from favorites
Displays key takeaways and Copernicus applications in agriculture, using icons and small graphs to supplement bullet points. The layout is straightforward and segmented for easy navigation.
Product and Service Analysis
Agriculture & Food Production
Provides insights into the use of Earth Observation data in agriculture, highlighting its impact on farming practices and decision-making. Particularly valuable for understanding technology applications in sustainable farming and resource management.
agriculture, Earth Observation, sustainable farming, decision-making, technology applications
false
Product and Service Analysis
Agriculture & Food Production
Multiple Chart
PwC/Strategy&
Add to my slides
Remove from favorites
Pie chart and bullet points summarizing agriculture's economic value and emissions profile. Text provides an overview of the sector's role and impact.
Industry Overview
Agriculture & Food Production
Describes the economic significance of the Australian agriculture sector, detailing its contributions to GDP and employment, as well as its emissions profile.
Agriculture, Economic Contribution, Emissions Profile, GDP, Employment, National Impact, Sector Overview
false
Industry Overview
Agriculture & Food Production
Multiple Chart
EY
Add to my slides
Remove from favorites
The slide presents a title at the top with two line charts below, depicting the total population and number of undernourished people worldwide.
Industry Overview
Agriculture & Food Production
This slide discusses the role of the agriculture sector in the global economy and the shift towards sustainability, highlighting population growth and food scarcity issues.
Agriculture, Economy, Sustainability, Population, Food Scarcity
false
Industry Overview
Agriculture & Food Production
Mixed Chart
PwC/Strategy&
Add to my slides
Remove from favorites
Features a line chart showing the percentage contribution to GDP by agriculture, forestry, meat processing, and grain mill over a decade.
Market Analysis and Trends
Agriculture & Food Production
Discusses the role of agriculture and food sectors in Namibia's GDP, showing trends over time to understand sectoral impact on economic growth.
agriculture, GDP contribution, Namibia, economic growth, forestry, meat processing, grain mill
false
Market Analysis and Trends
Agriculture & Food Production
Single Chart
PwC/Strategy&
Add to my slides
Remove from favorites
A complex circular diagram dominates the slide, illustrating the 'source-to-consume' life cycle with icons and text. Surrounding the cycle are boxes detailing megatrends and profiles for producers and consumers.
Investment Analysis
Agriculture & Food Production
This slide offers an intricate look at the agriculture industry's complexity, showing the various players and stages from production to consumption, alongside influential megatrends.
agriculture, industry lifecycle, megatrends, production, consumption, producers, consumers
false
Investment Analysis
Agriculture & Food Production
Linear Flow
EY
Add to my slides
Remove from favorites
A set of stacked column chart with a high amount of detail, comparing global market sizes and concentration for agricultural inputs.
Market Analysis and Trends
Agriculture & Food Production
The slide compares the fragmented and concentrated sectors within the agricultural input provider market, highlighting major players.
agriculture, input providers, market concentration, fragmentation, fertilizers, seeds, equipment
false
Market Analysis and Trends
Agriculture & Food Production
Mixed Chart
EY
Add to my slides
Remove from favorites
The slide features a simple, clean layout with a bold title and a bullet list of upcoming presentation topics. The design is minimalistic, employing only text and no images or charts. The color scheme is blue and white, with the title 'Agenda' prominently displayed at the top.
Investment Analysis
Agriculture & Food Production
This slide outlines the main points to be covered in the presentation, specifically focusing on the agriculture industry, crop market investments, and value chain. It's used to give the audience an overview of what to expect.
agriculture, overview, market, investment, value chain, agenda, crop, presentation
false
Investment Analysis
Agriculture & Food Production
Agenda
EY
Add to my slides
Remove from favorites
The slide includes column chart and diagrams showing the economic impact of Copernicus on agriculture.
Market Analysis and Trends
Agriculture & Food Production
Focuses on precision farming and the economic benefits derived from using Copernicus data in agriculture, aiming to enhance profitability and productivity.
Agriculture, Precision Farming, Copernicus, Profitability, Productivity
false
Market Analysis and Trends
Agriculture & Food Production
Mixed Chart
PwC/Strategy&
Add to my slides
Remove from favorites
The slide shows a column chart on the left showing North American buyout deals and a text box on the right detailing representative deals. The color scheme is mainly blue and white, with text and graph elements.
Investment Analysis
Agriculture & Food Production
This slide provides a comprehensive overview of private equity investment focus within the agriculture industry's value chain from 2014-2016, highlighting specific deals and segments.
agriculture, private equity, investment, value chain, buyout deals, market segments
false
Investment Analysis
Agriculture & Food Production
Single Chart
EY
Add to my slides
Remove from favorites
This slide presents three separate graphs on crop, livestock, and dairy production, using a blue and gray color scheme. It gives an overview of the US agriculture industry's financial output in these sectors.
Investment Analysis
Agriculture & Food Production
A financial breakdown of the US agriculture industry, highlighting the production value of crops, livestock, and dairy, and their respective growth figures over time.
agriculture, US industry, financial data, crops, livestock, dairy, production value
false
Investment Analysis
Agriculture & Food Production
Multiple Chart
EY
Add to my slides
Remove from favorites
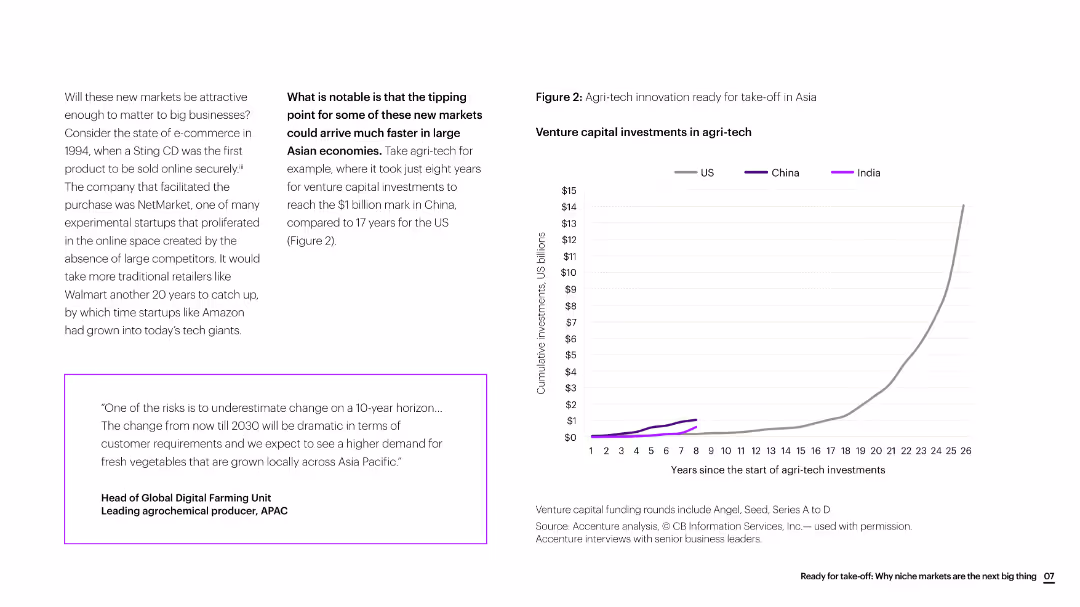
The slide includes text, a quote box, and a line chart showing venture capital investments in agri-tech over time, comparing the US, China, and India.
Market Analysis and Trends
Agriculture & Food Production
The slide discusses the rapid growth of agri-tech innovation in Asia, particularly highlighting the faster investment growth in China compared to the US.
agri-tech, innovation, Asia, venture capital, investment growth, agriculture, market trends
false
Market Analysis and Trends
Agriculture & Food Production
Mixed Chart
Accenture
Add to my slides
Remove from favorites
Contains mainly dense text that describes the number of startups involved in AgTech and their focus areas. The slide is dense with data and uses color to differentiate between segments.
Market Analysis and Trends
Agriculture & Food Production
This slide analyses the precision farming sector within the AgTech industry, highlighting the number of startups, investment trends, and key players in the market. It underlines the significance of sustainable agriculture practices.
AgTech, precision farming, sustainable agriculture, investment, startups
false
Market Analysis and Trends
Agriculture & Food Production
Header Vertical
Accenture
Add to my slides
Remove from favorites
Two sections with lists and images, comparing AGVs and AMRs. Key drivers of e-commerce AGV/AMR adoption are listed on the right.
Technology and Digital Transformation
Transportation & Logistics
Describes AGVs and AMRs, their roles in warehouse automation, and key drivers for their adoption in e-commerce.
AGVs, AMRs, warehouse, automation, e-commerce
false
Technology and Digital Transformation
Transportation & Logistics
Table
LEK
Add to my slides
Remove from favorites
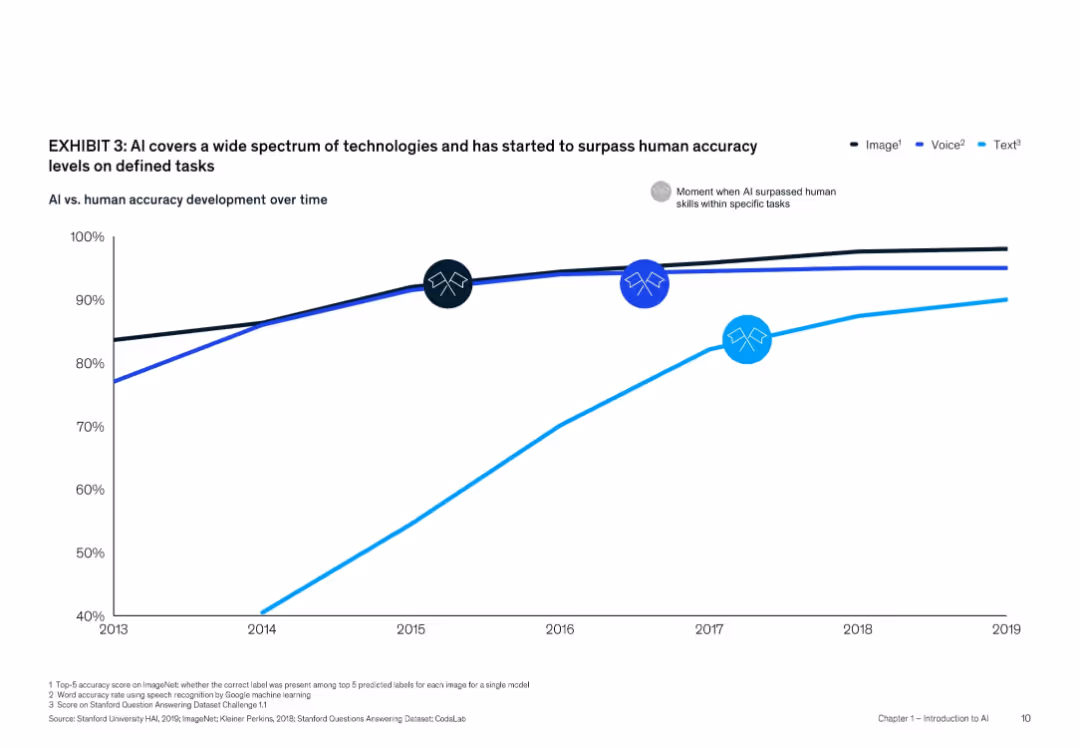
Line graph showing AI vs. human accuracy in Image, Voice, and Text domains from 2013–2019, with markers indicating points AI surpassed humans
Technology and Digital Transformation
Artificial Intelligence
AI accuracy has steadily improved, overtaking human performance in vision, speech, and language tasks by 2016–2017. The chart shows technology maturity across domains and the inflection points of AI advancement.
AI accuracy, image recognition, speech, NLP, human parity, deep learning, benchmarks
false
Technology and Digital Transformation
Artificial Intelligence
Single Chart
McKinsey
Add to my slides
Remove from favorites
The slide uses a scatter plot to display the distribution of organizations based on their AI capabilities. Different colors indicate various categories of AI proficiency.
Performance Metrics and KPIs
Technology & Software
It identifies different levels of AI adoption among organizations, categorizing them into Achievers, Builders, Innovators, and Experimenters based on their AI capabilities and performance.
AI achievers, capabilities, scatter plot, performance, categorization
false
Performance Metrics and KPIs
Technology & Software
Mixed Chart
Accenture
Add to my slides
Remove from favorites
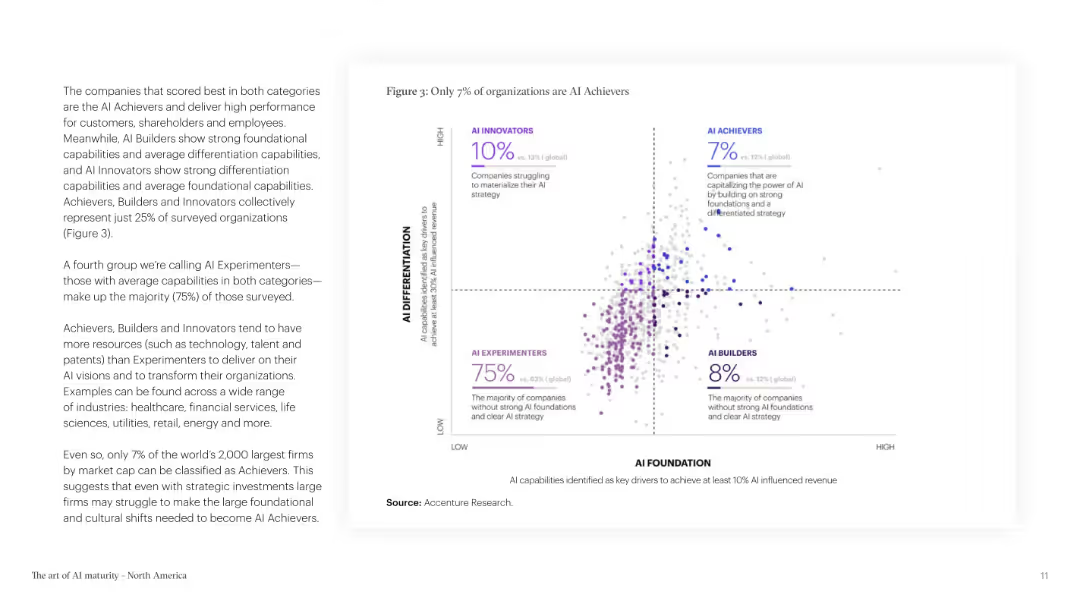
The slide features text and a scatter plot chart categorizing organizations based on AI differentiation and foundation. The color scheme is purple and white.
Technology and Digital Transformation
Technology & Software
The slide categorizes organizations into achievers, builders, innovators, and experimenters based on their AI strategies and foundations, highlighting the small percentage of AI achievers.
AI Achievers, Organizational Strategy, AI Foundation, AI Differentiation, Technology, Business Strategy
false
Technology and Digital Transformation
Technology & Software
Mixed Chart
Accenture
Add to my slides
Remove from favorites
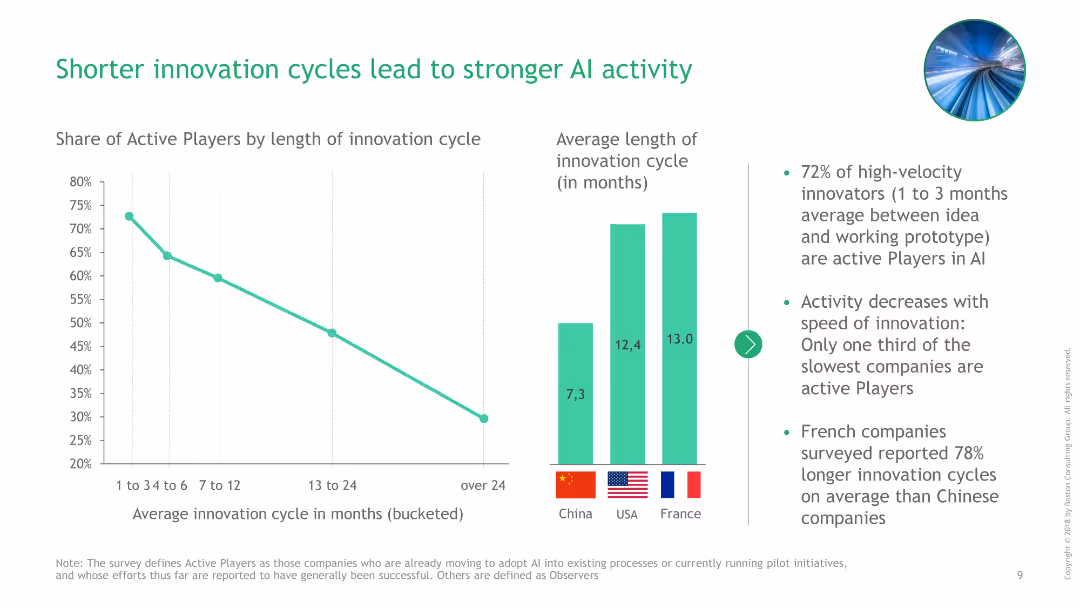
Line chart showing the relationship between innovation cycle length and AI activity levels, with additional bar charts comparing average cycle lengths across countries.
Technology and Digital Transformation
Technology & Software
This slide demonstrates how shorter innovation cycles contribute to stronger AI activity, supported by data comparing innovation cycles in China, USA, and France.
AI activity, innovation cycles, China, USA, France, technology, digital transformation, line chart, bar charts, comparison, data presentation
false
Technology and Digital Transformation
Technology & Software
Multiple Chart
BCG
Add to my slides
Remove from favorites
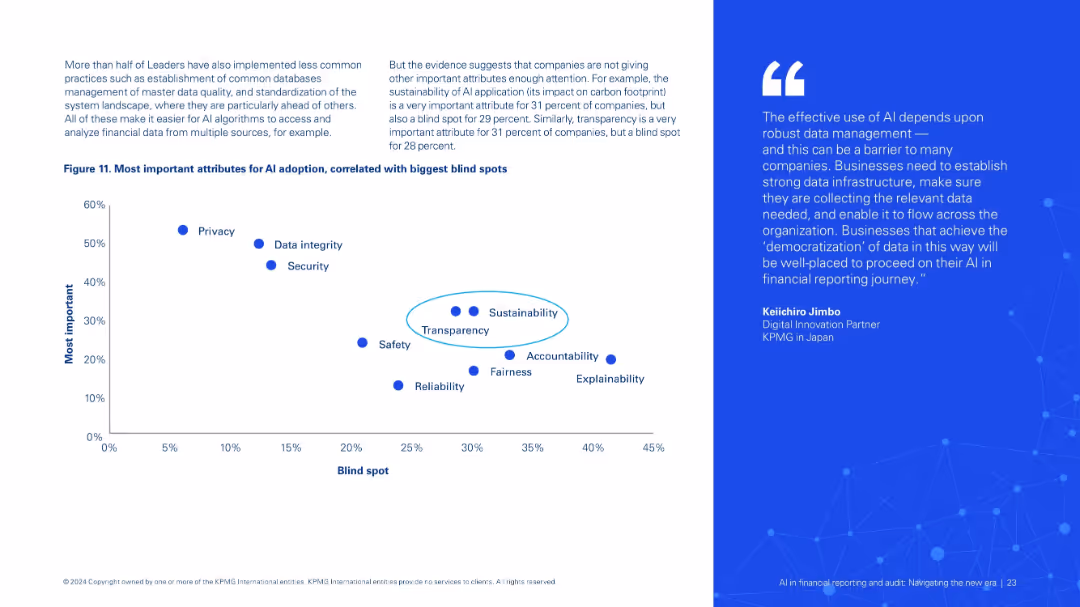
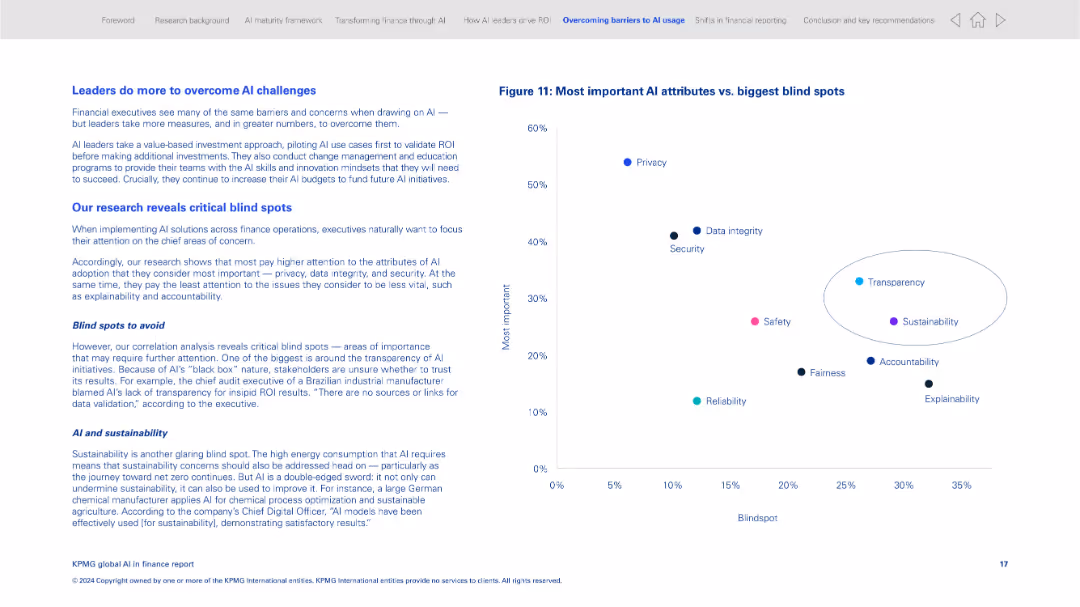
Left side provides context; right side features a scatterplot (Figure 11) mapping importance vs neglect of AI attributes. Blue dots and clean chart design.
Regulatory and Compliance
Financial Services
Analyzes the gap between perceived importance and actual attention given to AI-related attributes such as privacy, transparency, and explainability. Highlights critical blind spots in AI governance practices.
AI adoption, blind spots, privacy, transparency, compliance, explainability
false
Regulatory and Compliance
Financial Services
Mixed Chart
KPMG
Add to my slides
Remove from favorites
The slide presents various graphical representations, including pie charts, bar graphs, and an illustrative side panel with an image of an industrial scenario. It utilizes green, black, and white color scheme with clean lines and a structured layout.
Technology and Digital Transformation
Technology & Software
Focuses on integrating AI into business processes, highlighting the importance of collaboration between tech teams and business units for effective AI adoption. Stresses on both the financial and transformational impacts of AI with real-world business examples.
AI adoption, business transformation, collaboration, technology integration, industry case study
false
Technology and Digital Transformation
Technology & Software
Mixed Chart
BCG
Add to my slides
Remove from favorites
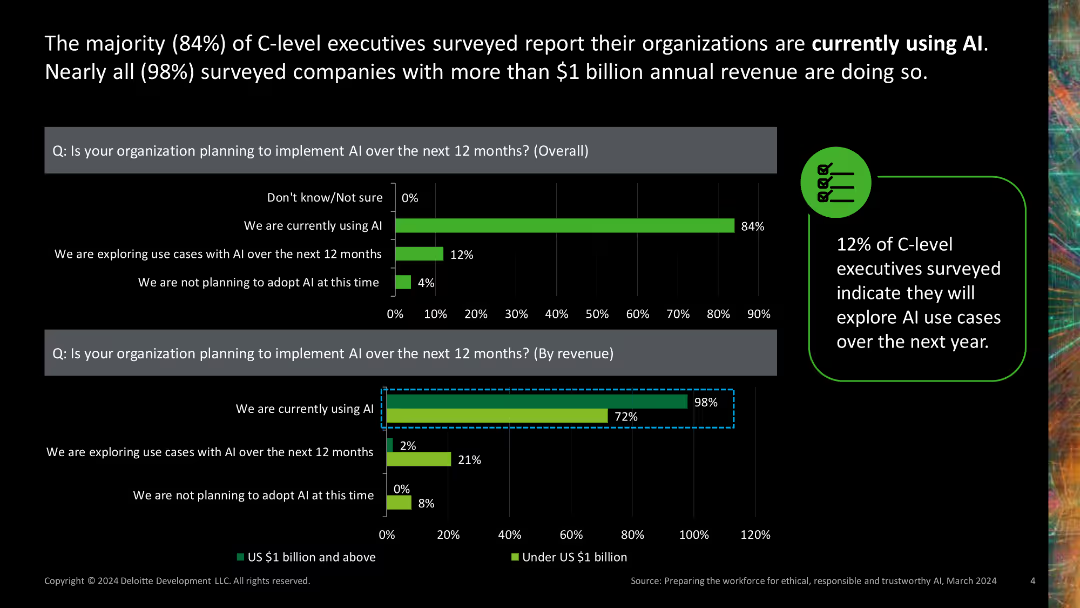
Two column charts showing AI adoption rates by overall and by revenue. Green bars with percentage values.
Market Analysis and Trends
Technology & Software
Presents data on the high rate of AI adoption among C-level executives and companies with significant annual revenue, indicating a trend towards widespread AI implementation.
AI adoption, C-level executives, revenue, market trends, technology
false
Market Analysis and Trends
Technology & Software
Multiple Chart
Deloitte
Add to my slides
Remove from favorites
Slide details the adoption of AI technologies in contact centers through bar, column charts and lists, using green and dark green to differentiate levels of implementation.
Technology and Digital Transformation
Technology & Software
Highlights the adoption and impact of AI technologies in contact centers, focusing on the deployment stages and benefits of voice and text analytics.
AI Adoption, Contact Centers, Technology Implementation, Digital Transformation, Analytics, Service Improvement
false
Technology and Digital Transformation
Technology & Software
Multiple Chart
Deloitte
Add to my slides
Remove from favorites
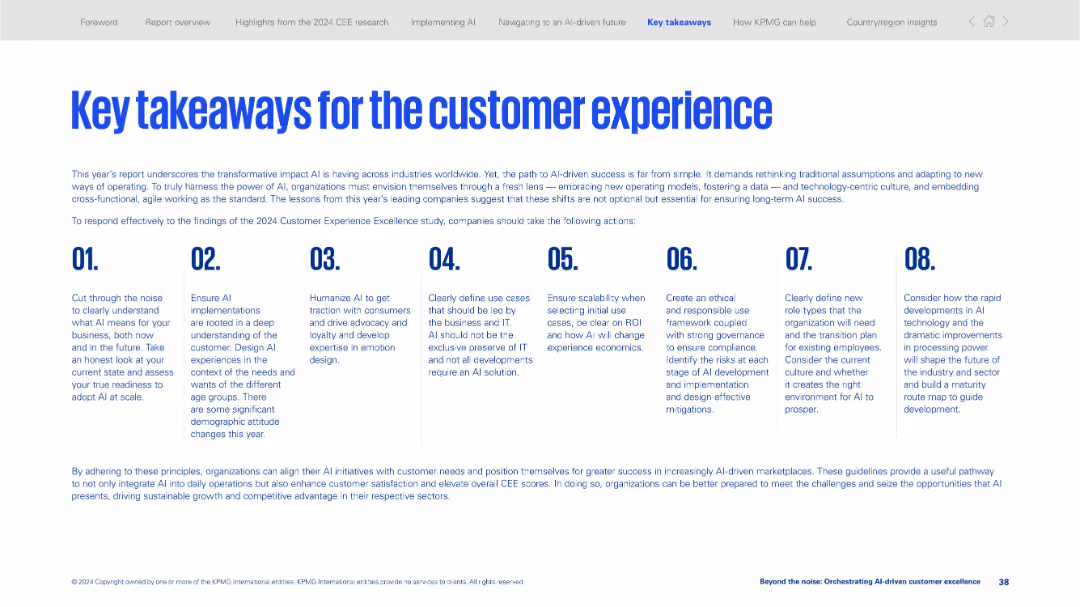
Numbered column layout (01–08) summarizing main recommendations for AI adoption and customer experience.
Strategic Planning
Professional Services
Offers eight key principles to guide organizations in adopting AI for customer experience improvements. Covers readiness assessment, ethical frameworks, clear use cases, role definitions, and scalability.
AI adoption, customer experience, strategy, takeaways, ethics, readiness, scalability, roles, organizational change
false
Strategic Planning
Professional Services
Linear Flow
KPMG
Add to my slides
Remove from favorites
This graph-centric slide shows economic gains by AI adoption cohorts. The clear, bold graphics differentiate front runners, followers, and laggards. The color palette is blue and black, with a professional design aesthetic.
Financial Performance
Technology & Software
Highlighting the financial benefits of early AI adoption, this slide illustrates economic gains across different cohorts. It is valuable for financial performance reviews and investment discussions, emphasizing the advantage for front runners in tech adoption.
AI Adoption, Economic Gains, Financial Benefits, Tech Adoption, Investment, Performance Review
true
Financial Performance
Technology & Software
Multiple Chart
McKinsey
Add to my slides
Remove from favorites
This slide features a complex chart displaying the adoption levels of generative AI across various business functions. The chart utilizes various sized circles in a gradient from light to dark teal to represent the increasing expertise levels from 'Little expertise' to 'Very high expertise'. The slide background is white with a decorative green bubble design on the left. Each function is listed vertically on the left with corresponding circles across five columns indicating the percentage of expertise.
Market Analysis and Trends
Technology & Software
The slide presents data on generative AI adoption across different business functions like IT/cybersecurity, marketing, and more. The data is categorized by levels of expertise, ranging from 'Little' to 'Very high'. The largest circles indicate the highest adoption and expertise levels. This could be used in presentations to highlight areas of focus for AI skills development or to showcase industry benchmarks in AI expertise. The data is from a survey conducted in Q4 2023, with 2,835 responses, indicating a strong inclination towards higher expertise in IT and product development.
AI adoption, expertise levels, business functions, generative AI, benchmarking, skill development, IT/cybersecurity, marketing, product development
false
Market Analysis and Trends
Technology & Software
Single Chart
Deloitte
Add to my slides
Remove from favorites
A data-centric slide with multiple bar graphs showing the adoption of AI across various geographies. Accompanied by icons and statistics on AI expansion, implementation ease, and innovation growth.
Financial Performance
Technology & Software
Leaders are urged to consider the significance of AI adoption, evidenced by statistics on global expansion, innovation, and investment, reflecting AI's impact on business performance.
AI Adoption, Financial Growth, Global Expansion, Innovation, Investment, Business Performance
false
Financial Performance
Technology & Software
Single Chart
McKinsey
Add to my slides
Remove from favorites
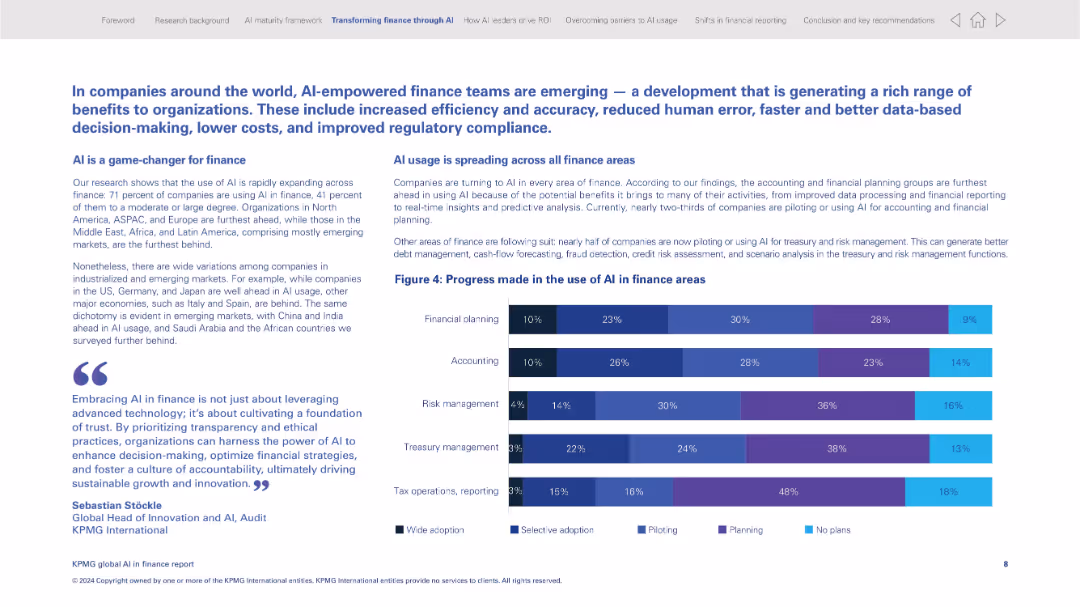
Two-column layout with text and a horizontal bar chart; strong use of KPMG blue; emphasis on AI adoption by function
Technology and Digital Transformation
Financial Services
The slide outlines how AI is being adopted across various finance functions, including planning, accounting, and risk management. It shows a bar chart visualizing the extent of AI adoption across areas, highlighting how AI is becoming a game-changer. The text provides regional insights and quotes an executive emphasizing trust and transparency.
AI adoption, financial planning, accounting, risk management, predictive analytics, KPMG, transformation, trust, compliance, efficiency
false
Technology and Digital Transformation
Financial Services
Mixed Chart
KPMG
Add to my slides
Remove from favorites
Contains three circular graphs illustrating financial benefits of AI in banking, showing improvements in productivity, revenue growth, and return on equity.
Financial Performance
Financial Services
Details projected financial benefits for banks adopting AI, emphasizing significant gains in productivity, revenue growth, and return on equity, suitable for financial strategy discussions.
AI adoption, financial projections, banking, productivity, revenue growth
false
Financial Performance
Financial Services
Pillar
Accenture
Add to my slides
Remove from favorites
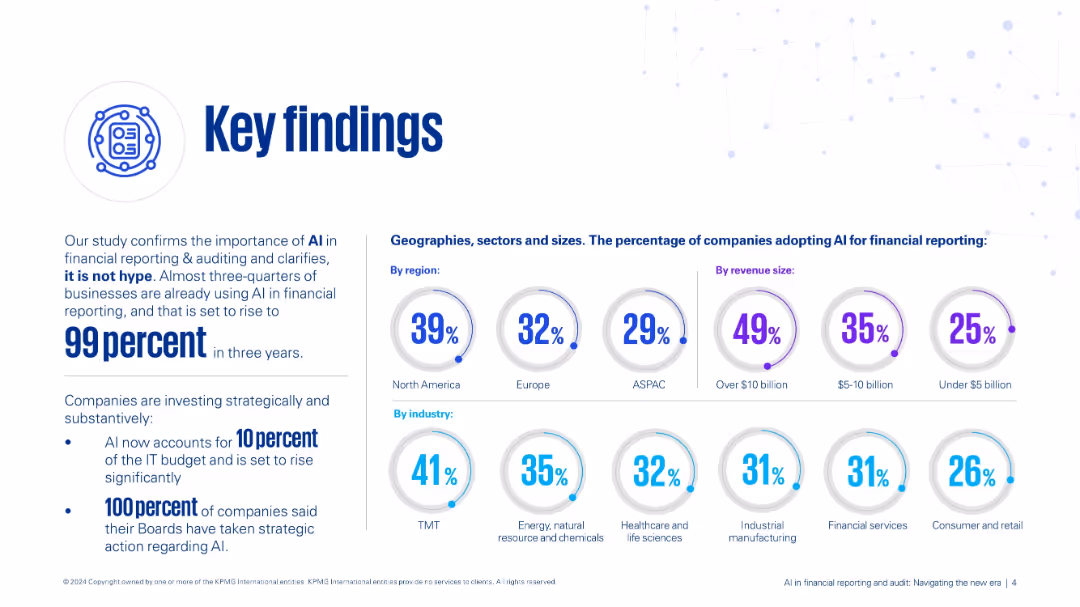
Clean layout with bold infographic icons and segmented stats by region, revenue, and industry. Blue and purple theme.
Financial Performance
Financial Services
Presents key findings on AI adoption in financial reporting, showing high current and projected adoption rates. Highlights geographic and industry-specific adoption stats and the strategic role of AI in IT budgets and board decisions.
AI adoption, financial reporting, IT budget, regional stats, industry trends, board action
false
Financial Performance
Financial Services
Mixed Chart
KPMG
Add to my slides
Remove from favorites
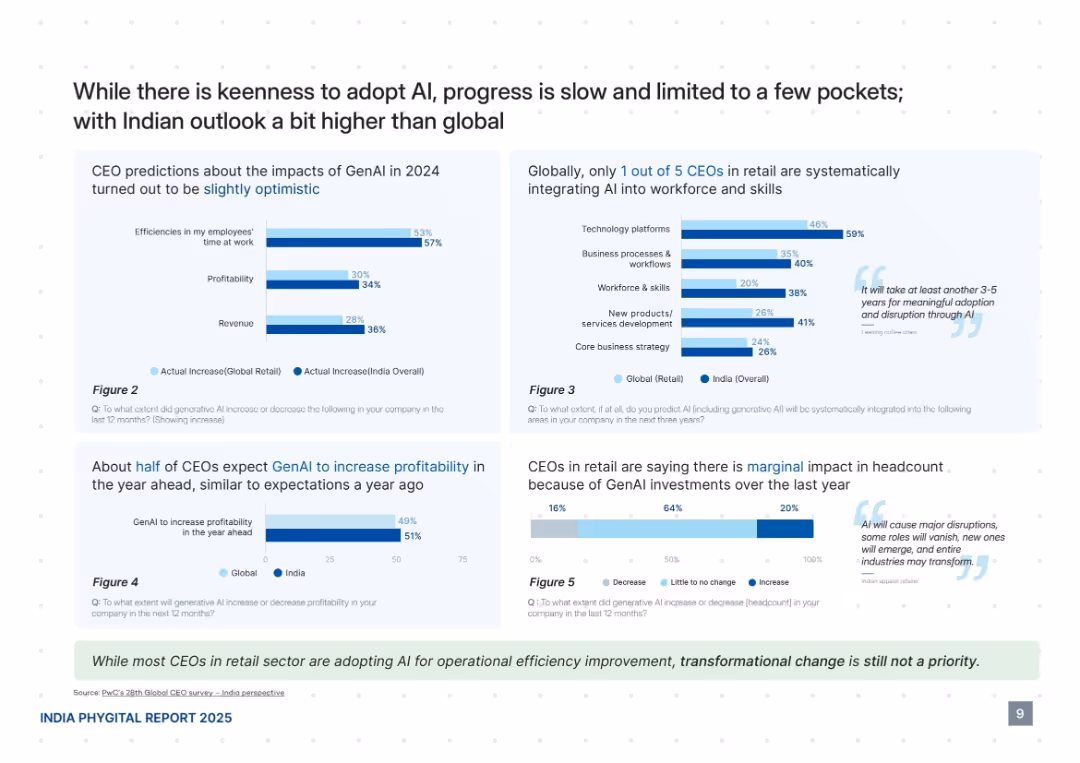
Multi-chart slide with side-by-side horizontal bar charts and supporting quotes. Blue and white color scheme, with light box highlights and callouts.
Strategic Planning
Retail & E-commerce
The slide compares Indian and global retail CEO perspectives on AI adoption, revealing higher optimism and expectations in India. Charts show GenAI's impact on efficiency, revenue, and profitability. It also notes marginal headcount changes and limited AI workforce integration, highlighting early-stage adoption and varied strategic focus across companies.
AI adoption, GenAI, retail CEOs, India vs global, profitability, workforce, technology integration, headcount impact
false
Strategic Planning
Retail & E-commerce
Multiple Chart
PwC/Strategy&
Add to my slides
Remove from favorites
Slide includes textual content with adjacent column chart comparing attitudes by age and location
Technology and Digital Transformation
Financial Services
Highlights variations in AI adoption attitudes across different generations and geographical locations.
AI adoption, generational differences, geographical differences, financial services
false
Technology and Digital Transformation
Financial Services
Mixed Chart
Deloitte
Add to my slides
Remove from favorites
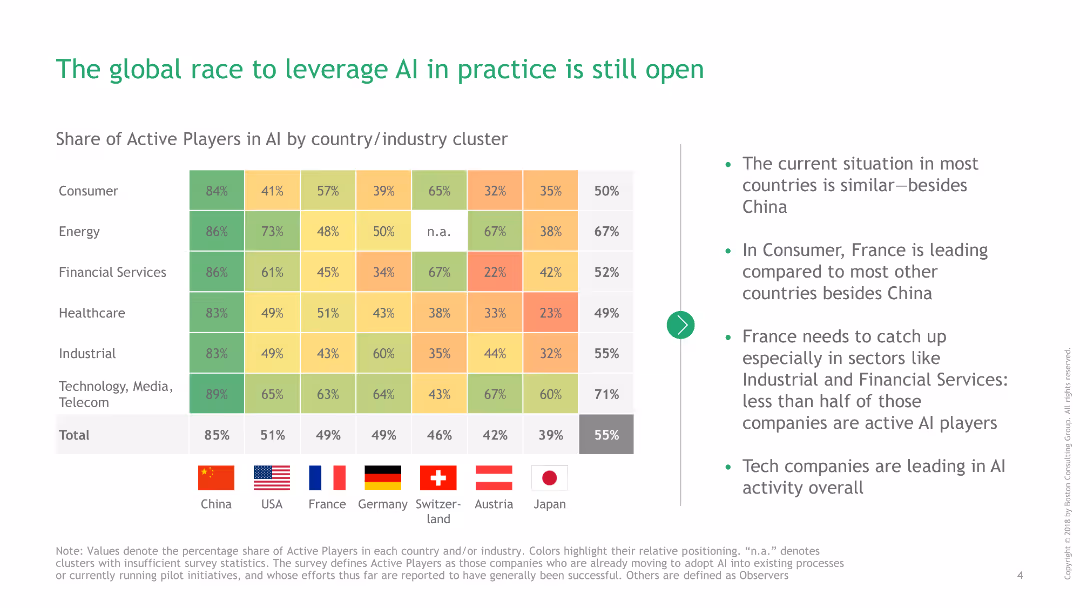
The slide includes a heatmap chart showing AI adoption by industry and country, accompanied by a text summary.
Market Analysis and Trends
Technology & Software
Examines the global state of AI adoption across various industries and countries, noting areas where France needs to improve.
AI adoption, global race, industries, technology, France
false
Market Analysis and Trends
Technology & Software
Table
BCG
Add to my slides
Remove from favorites
Contains text blocks and icons, describing four key areas critical for AI adoption in risk management.
Technology and Digital Transformation
Technology & Software
Discusses the necessary enablers for adopting AI within organizations, emphasizing governance and skills.
AI adoption, governance, skills, risk management
false
Technology and Digital Transformation
Technology & Software
Pillar
PwC/Strategy&
Add to my slides
Remove from favorites
Features a comprehensive table showing the percentage of AI adoption by industry and function, highlighted with color gradients for visual distinction.
Market Analysis and Trends
Technology & Software
The slide provides a detailed breakdown of AI adoption rates across industries and business functions, indicating a higher rate in technology-centric fields.
AI Adoption, Industry Analysis, Business Functions, Technology Sector, Market Research, Data Analysis
false
Market Analysis and Trends
Technology & Software
Single Chart
McKinsey
Add to my slides
Remove from favorites
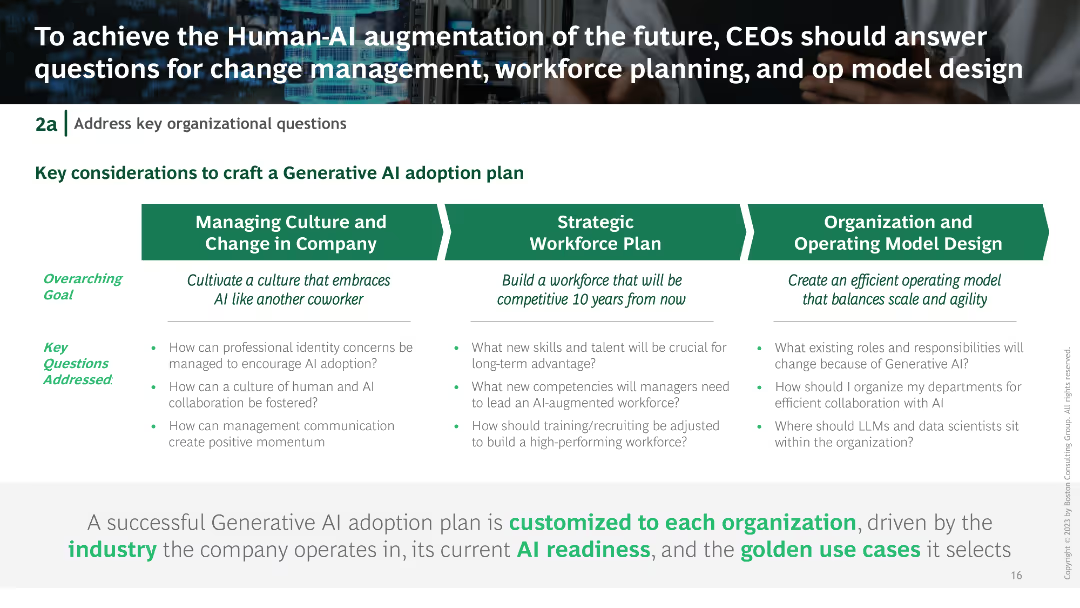
Text is organized in three columns with key considerations for crafting a generative AI adoption plan. Visual elements include icons and text boxes highlighting managing culture, workforce planning, and model design.
Organizational Structure and Change
Technology & Software
Discusses key organizational questions for generative AI adoption, including managing culture, strategic workforce planning, and operational model design.
AI adoption, organizational change, workforce planning, operational model, generative AI
false
Organizational Structure and Change
Technology & Software
Table
BCG
Add to my slides
Remove from favorites
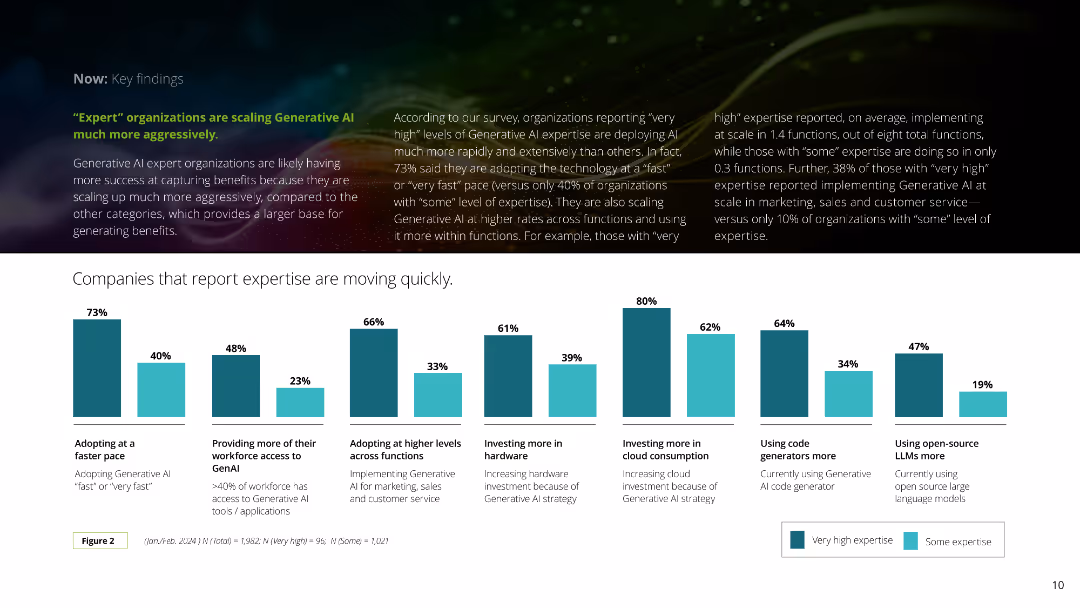
The slide displays a series of vertical bar charts comparing the pace of Generative AI adoption and the scope of its application across various business functions. The bars are in shades of blue and green for clarity.
Technology and Digital Transformation
Technology & Software
It highlights that organizations with high expertise in Generative AI are adopting and scaling the technology more rapidly and extensively, investing in various areas like hardware, cloud, and code generators.
AI adoption, scaling, expertise, investment, chart
false
Technology and Digital Transformation
Technology & Software
Mixed Chart
Deloitte
Add to my slides
Remove from favorites
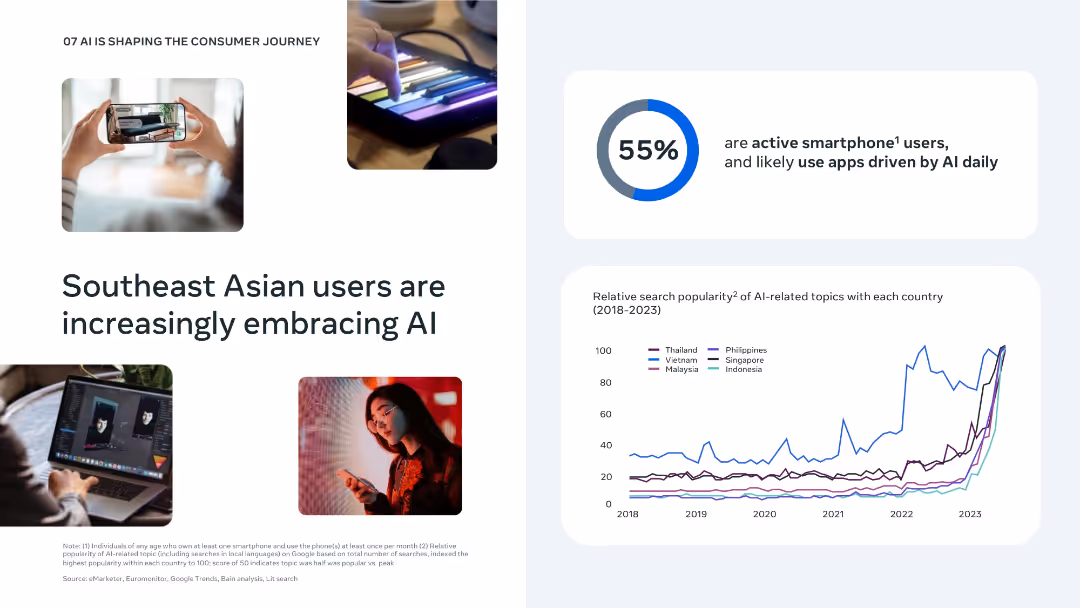
Split layout with photos, bold statistics, and a line chart showing AI search trend growth across countries; clean, data-rich design.
Market Analysis and Trends
Artificial Intelligence
Demonstrates increasing engagement with AI among Southeast Asian users, especially through smartphone use. Search trend data confirms a steady rise in interest in AI topics across countries, highlighting a fertile environment for AI adoption in consumer and business applications.
AI adoption, smartphone use, search trends, Southeast Asia, technology
false
Market Analysis and Trends
Artificial Intelligence
Multiple Chart
Bain
Add to my slides
Remove from favorites
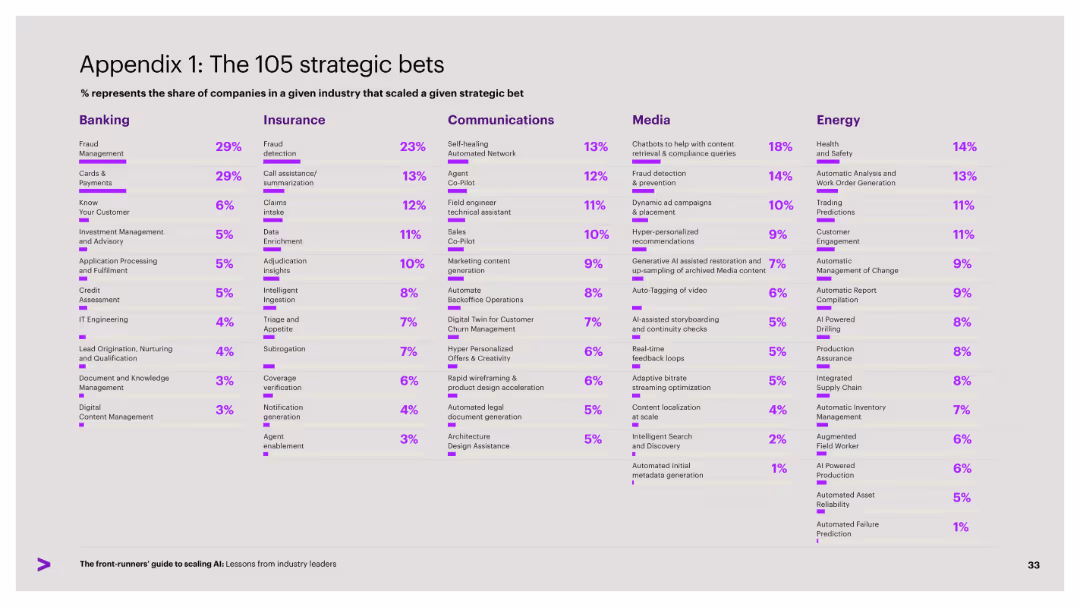
Dense grid layout with five industry columns, each listing AI-related strategic initiatives by adoption rate. Purple accent bars and text for % indicators.
Strategic Planning
Artificial Intelligence
This slide outlines the top AI-related strategic bets scaled by companies across various industries, ranked by the percentage of firms adopting each. It highlights the leading AI initiatives by sector, from fraud detection to agent enablement.
AI adoption, strategic bets, industry comparison, scaling, technology
false
Strategic Planning
Artificial Intelligence
Single Chart
Accenture
Add to my slides
Remove from favorites
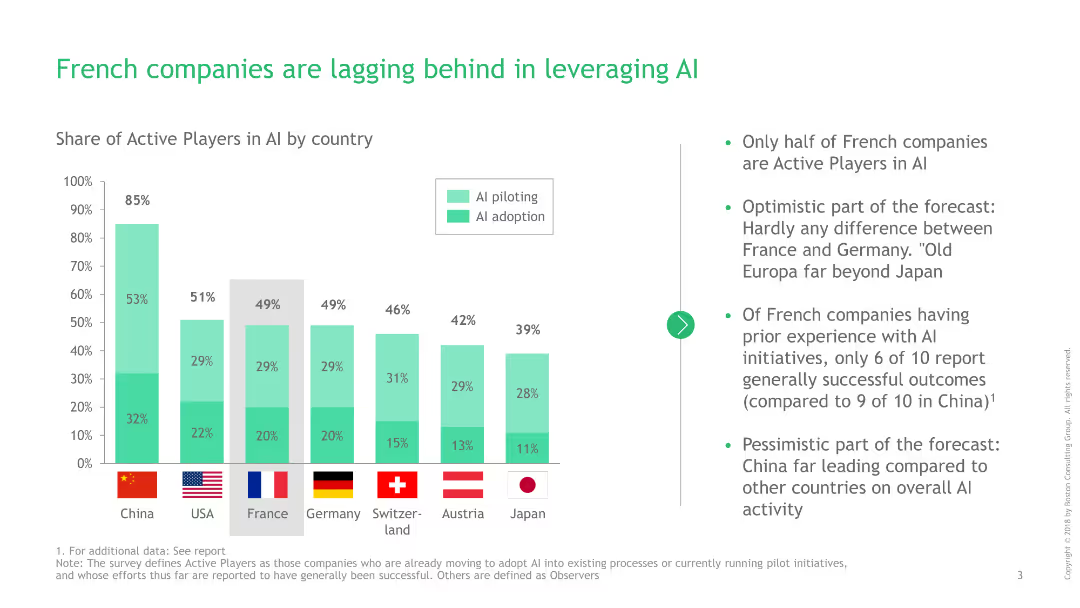
Contains a column chart showing the share of active AI players by country, with additional text highlighting France's position.
Technology and Digital Transformation
Technology & Software
Discusses the slower adoption and piloting rates of AI among French companies compared to other countries.
AI adoption, technology, France, global comparison, active players
false
Technology and Digital Transformation
Technology & Software
Mixed Chart
BCG
Add to my slides
Remove from favorites
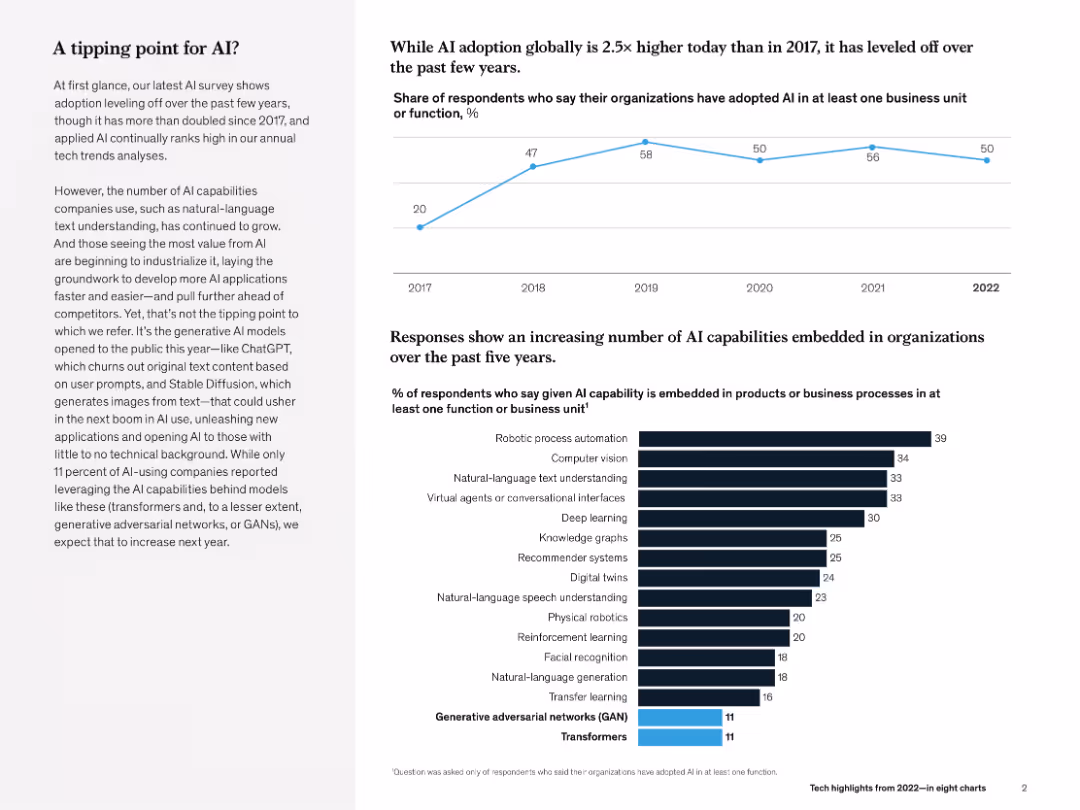
Line chart (top) and bar chart (bottom). Left-aligned text explains key insight. Minimalist black-and-blue theme.
Technology and Digital Transformation
Artificial Intelligence
The slide evaluates AI adoption trends (flatlining at ~50% post-2018) and shows growing diversity in AI use cases (e.g., robotic process automation, NLP). Emphasis is placed on emerging generative AI models like GANs and transformers.
AI adoption, transformers, GANs, NLP, robotic automation, McKinsey, business unit, survey
false
Technology and Digital Transformation
Artificial Intelligence
Multiple Chart
McKinsey
Add to my slides
Remove from favorites
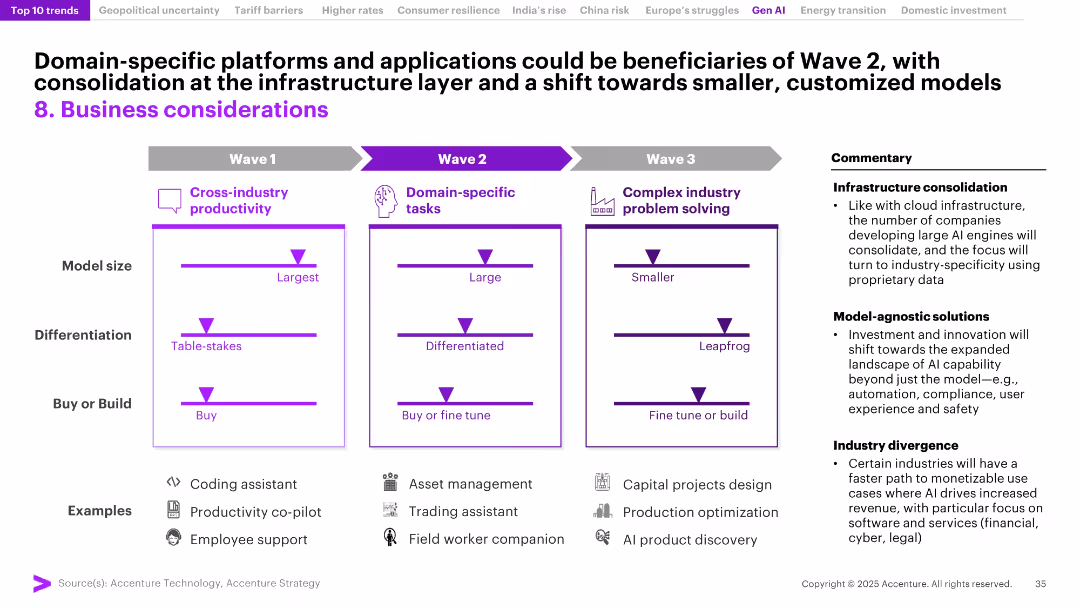
Three-column framework titled Waves 1–3 showing AI model evolution (from cross-industry to domain-specific and problem-solving); commentary on right.
Product and Service Analysis
Artificial Intelligence
The slide lays out a roadmap for AI adoption: from general productivity tools to specialized and complex use cases. It emphasizes trends like infrastructure consolidation and industry divergence, indicating a shift toward tailored, high-impact AI applications in sectors such as legal, financial, and industrial operations.
AI adoption, wave strategy, domain-specific AI, infrastructure consolidation, product evolution, industry divergence, AI models, customization
false
Product and Service Analysis
Artificial Intelligence
Mixed Chart
Accenture
Add to my slides
Remove from favorites
Bold purple background with split columns of explanatory text and a large circular stat.
Technology and Digital Transformation
Financial Services
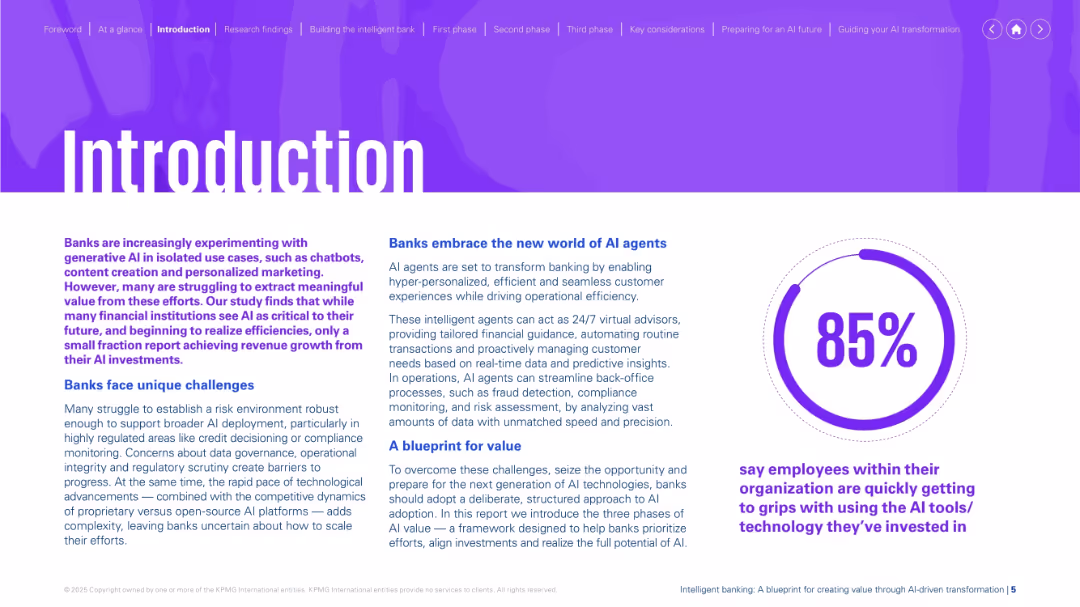
Introduces the report’s purpose, highlighting banks’ experimentation with AI agents and challenges in scaling. Emphasizes opportunity to realize efficiencies and sets up a structured framework for adopting AI tools.
AI agents, banking, generative AI, personalization, challenges, transformation, adoption framework
false
Technology and Digital Transformation
Financial Services
Mixed Chart
KPMG
Add to my slides
Remove from favorites
Horizontal bar chart with country-wise data split into two segments: "Central or complementary role" (light green) and "Exploring" (dark green).
Market Analysis and Trends
Artificial Intelligence
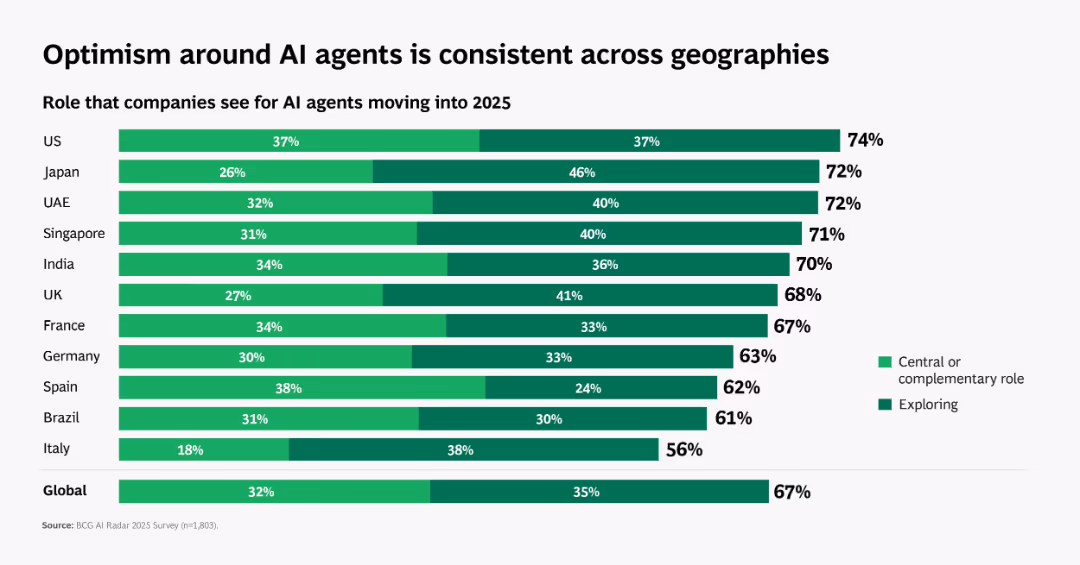
This slide highlights global perspectives on the role of AI agents in 2025. Countries like the US, Japan, and UAE show high percentages of companies viewing AI agents as having a central or exploratory role. A global average of 67% indicates strong optimism around AI deployment.
AI agents, global trends, adoption, regional analysis, business outlook
false
Market Analysis and Trends
Artificial Intelligence
Single Chart
BCG
Add to my slides
Remove from favorites
The slide features a diagram illustrating Ipsos's reputation and policy legislation intelligence platform, highlighting data sources, analytics, and actionable alerts.
Technology and Digital Transformation
Technology & Software
It details Ipsos’s AI and advanced analytics platforms, explaining how they help clients sense and respond in real time using various data sources and technologies.
AI, analytics, Ipsos, data, real-time response
false
Technology and Digital Transformation
Technology & Software
Linear Flow
IPSOS
Add to my slides
Remove from favorites
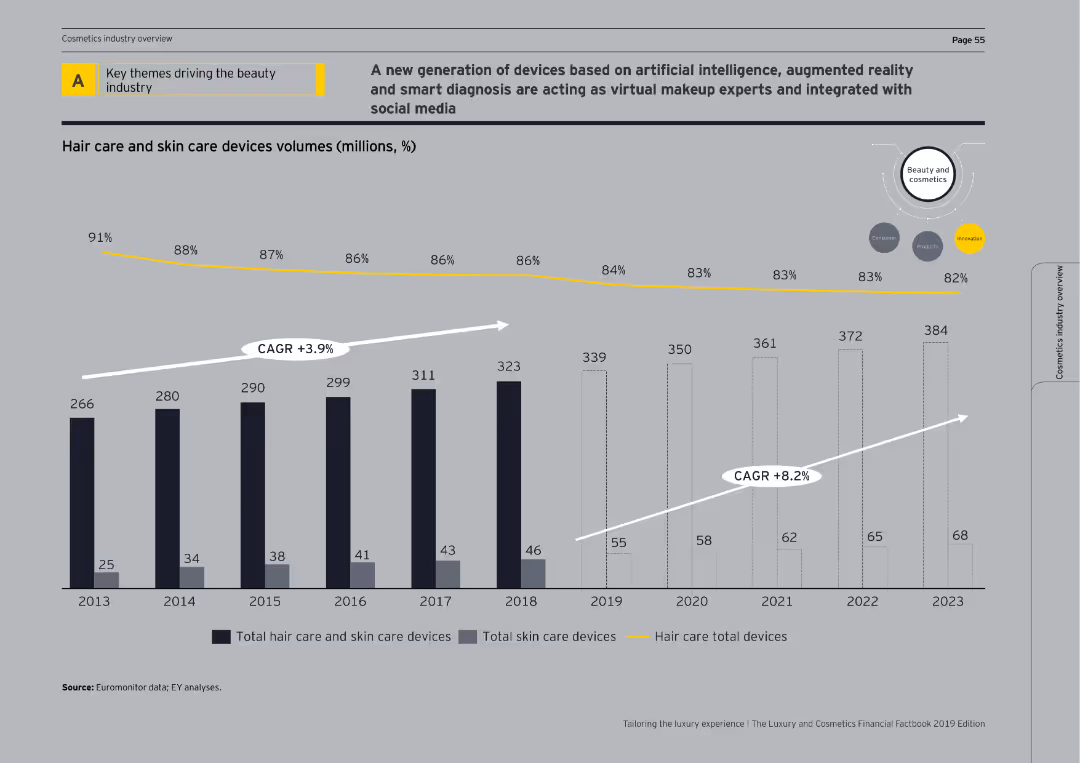
This slide features a column chart showing the volume of hair care and skin care devices from 2013 to 2023. Annotations indicate CAGR for total skin care and hair care total devices.
Market Analysis and Trends
Consumer Goods
The slide highlights the trends in the beauty industry focusing on the adoption of AI, AR, and social media integration in virtual makeup and smart diagnosis devices.
AI, AR, beauty industry, market trends, CAGR
false
Market Analysis and Trends
Consumer Goods
Single Chart
EY
Add to my slides
Remove from favorites
The slide displays a diagram contrasting the current and future state of AI at Morgan Stanley, with icons representing AI tools and their integration into advisor-client interactions.
Technology and Digital Transformation
Technology & Software
The slide highlights Morgan Stanley's leadership in AI, showcasing current tools like AI@MS Assistant and future state interactions to enhance advisor-client experiences.
AI, Artificial Intelligence, Morgan Stanley, Technology Integration, Advisor Tools, Client Interaction, Diagram, Innovation
false
Technology and Digital Transformation
Technology & Software
Diagram
Morgan Stanley
Add to my slides
Remove from favorites
Structured matrix with three AI capability columns; icons for service categories; color-coded impact circles
Customer and Market Segmentation
Financial Services
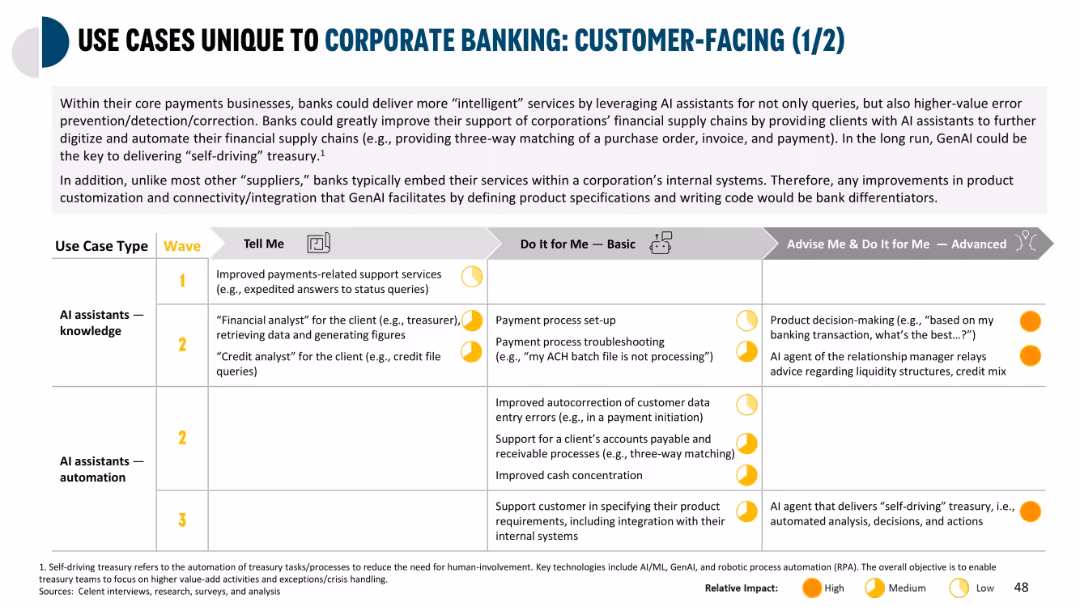
Highlights AI assistant capabilities for corporate banking clients across knowledge and automation use cases. It describes functions such as payment help, financial advice, product setup, and integration support.
AI assistant, customer support, payment setup, digital transformation, corporate clients
false
Customer and Market Segmentation
Financial Services
Mixed Chart
Oliver Wyman
Add to my slides
Remove from favorites
Three-column layout with infographics, text boxes, and circular data visualizations on ESG and cost-of-living impact.
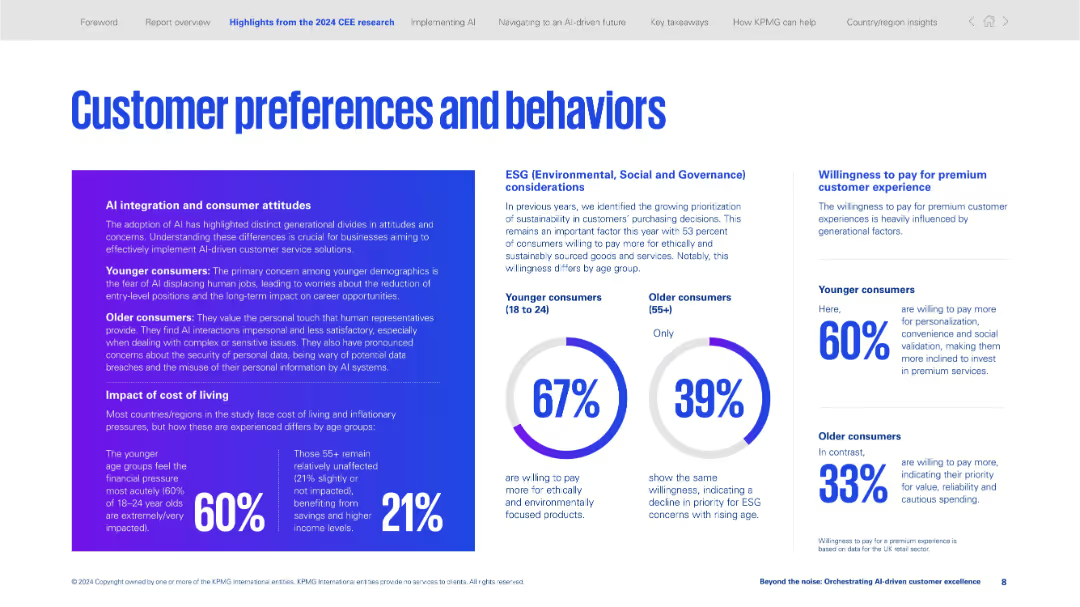
Customer and Market Segmentation
Professional Services
Examines generational attitudes toward AI, cost-of-living sensitivity, and ESG preferences. Younger consumers are more impacted and more willing to pay for personalization and sustainability.
AI attitudes, ESG, generational segmentation, personalization, premium experience, cost of living, consumer behavior, sustainability
false
Customer and Market Segmentation
Professional Services
Mixed Chart
KPMG
Add to my slides
Remove from favorites
Features a split layout with pie charts and text, presenting global opinions on AI within the workplace, highlighting geographic variations in optimism and concern.
Market Analysis and Trends
Technology & Software
Offers a global overview of attitudes towards AI in the workplace, essential for international strategy planning and market entry decisions.
AI attitudes, international strategy, market analysis, geographic variation, workplace impact
false
Market Analysis and Trends
Technology & Software
Multiple Chart
BCG
Add to my slides
Remove from favorites
Text on left and a quadrant-style scatter plot on the right; white background with blue and purple accents
Risk Assessment and Management
Financial Services
The slide presents research findings on AI adoption in finance, focusing on which AI attributes executives prioritize (e.g., privacy, security) and which ones they tend to overlook (e.g., transparency, sustainability). The plot visualizes importance versus blind spot percentage.
AI attributes, blind spots, transparency, sustainability, finance risk, executive perception, scatter plot
false
Risk Assessment and Management
Financial Services
Mixed Chart
KPMG
Add to my slides
Remove from favorites
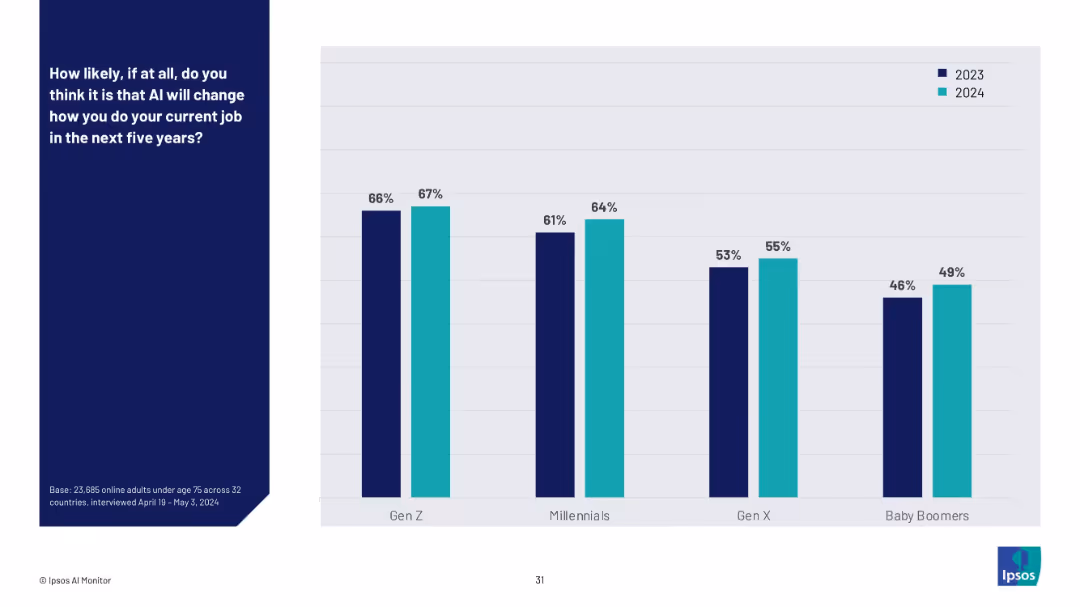
Clustered vertical bar chart comparing generational responses (Gen Z to Baby Boomers) for 2023 and 2024.
Technology and Digital Transformation
Artificial Intelligence
This slide compares generational expectations for job change due to AI from 2023 to 2024. Younger generations (Gen Z, Millennials) continue to show higher belief that AI will impact their work, with slight increases across all age groups year-over-year.
AI at work, generational trends, year-over-year comparison, work transformation, future readiness, survey, technology shift, 2023–2024
false
Technology and Digital Transformation
Artificial Intelligence
Mixed Chart
IPSOS
Add to my slides
Remove from favorites
Five icons representing different factors such as 'Technical feasibility', 'Cost of labor', and 'Regulatory and social factors', each with a descriptive subheading and arranged in a clean, circular layout.
Strategic Planning
Technology & Software
Outlines the major factors that influence the pace and extent of AI and automation adoption in industries, discussing technical, economic, and regulatory considerations.
AI, Automation, Factors, Adoption, Industry
false
Strategic Planning
Technology & Software
Pillar
McKinsey
Add to my slides
Remove from favorites
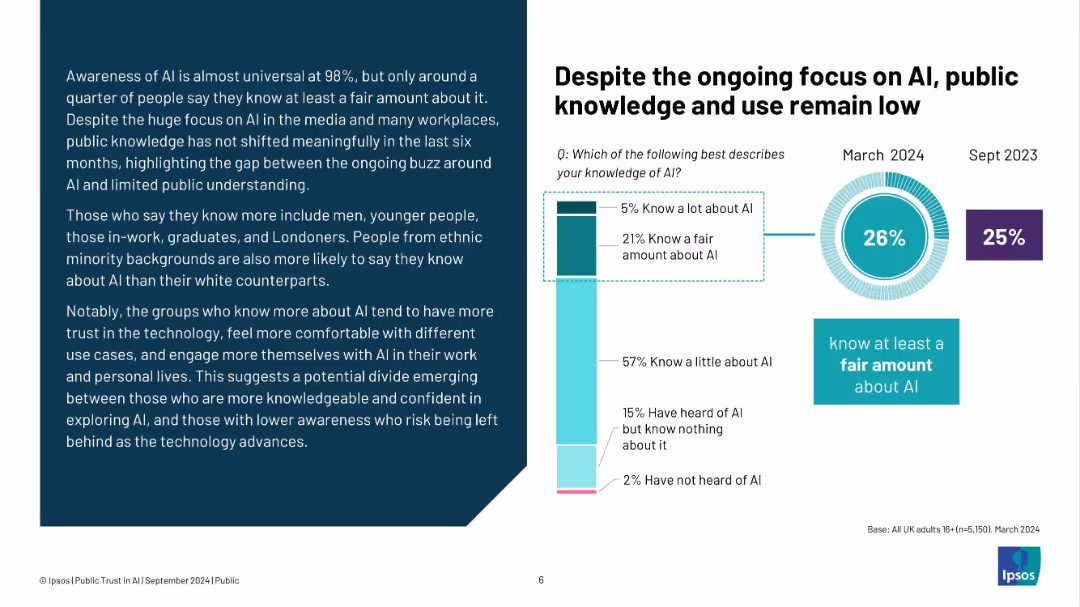
Left: paragraph on AI awareness; right: bar and donut charts on AI knowledge by March 2024 vs Sept 2023
Market Analysis and Trends
Artificial Intelligence
Although awareness of AI is high (98%), only 26% of people know a fair amount or more. The slide highlights demographic disparities in AI knowledge and implies a knowledge divide which affects engagement and trust levels with AI.
AI awareness, public knowledge, demographics, Ipsos, UK, statistics, engagement, trust, education
false
Market Analysis and Trends
Artificial Intelligence
Multiple Chart
IPSOS
Add to my slides
Remove from favorites
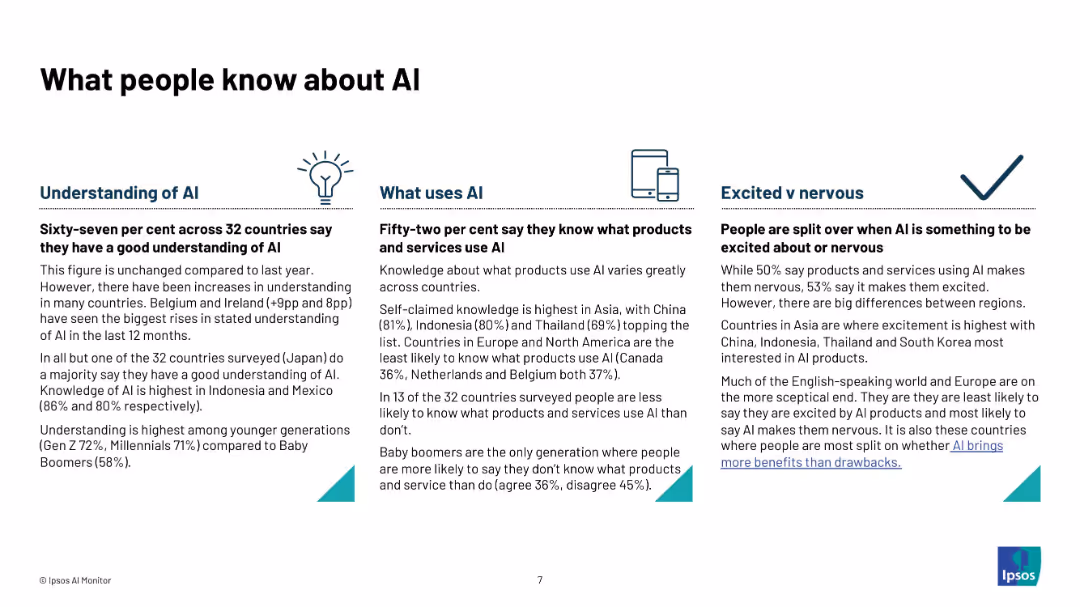
Three-column layout with icons and text under headings: "Understanding of AI", "What Uses AI", and "Excited vs Nervous".
Technology and Digital Transformation
Artificial Intelligence
Describes public knowledge about AI across 32 countries. Details include understanding levels, awareness of AI products, and emotional responses (excited vs nervous). Highlights generational and regional differences in knowledge and comfort levels.
AI awareness, public understanding, product knowledge, excitement, nervousness, generational gap, global survey, Ipsos, infographic
false
Technology and Digital Transformation
Artificial Intelligence
Pillar
IPSOS
Add to my slides
Remove from favorites
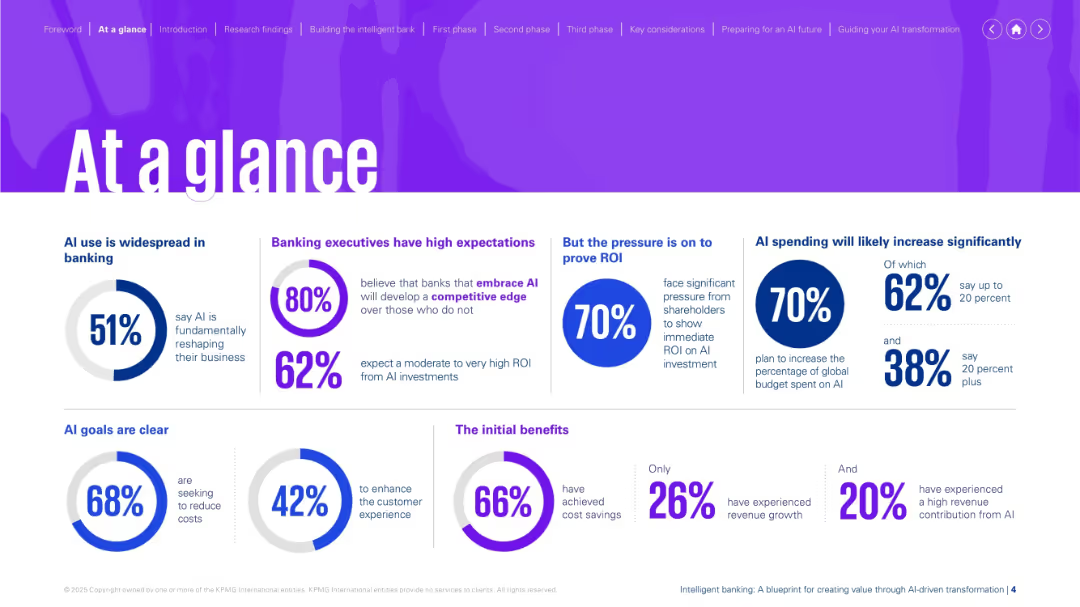
Bright purple theme with multiple infographic elements (pie charts, percent stats, segment boxes).
Strategic Planning
Financial Services
Provides a snapshot of AI's growing role in banking—expectations, spending trends, ROI pressure, and benefits. Highlights that AI is reshaping the sector, with clear goals around cost reduction and customer experience.
AI banking, ROI pressure, spending, cost reduction, customer experience, digital transformation
false
Strategic Planning
Financial Services
Single Chart
KPMG
Add to my slides
Remove from favorites
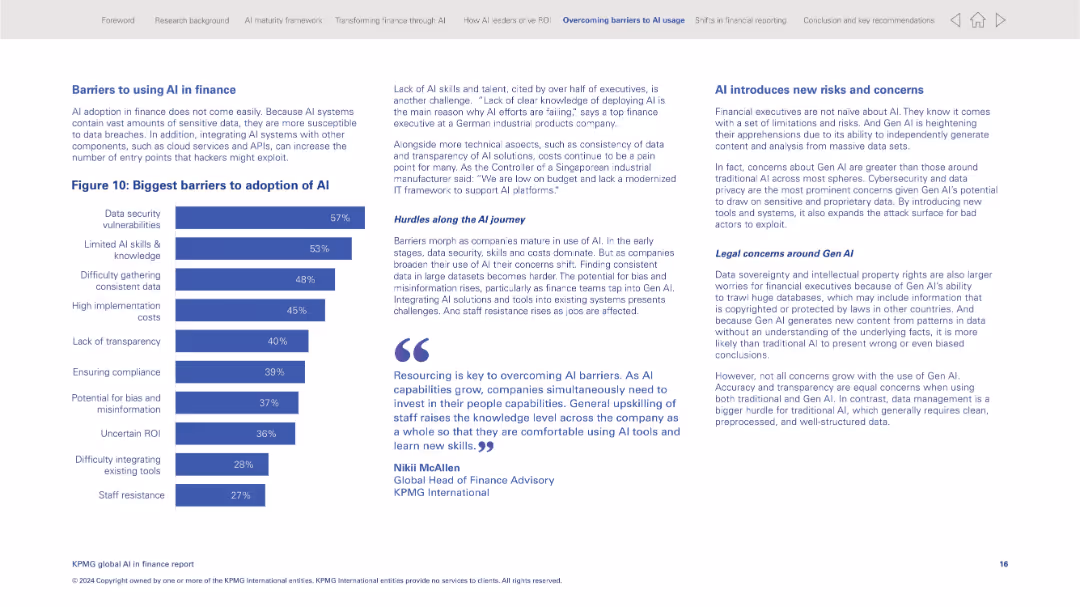
Left-heavy layout with a horizontal bar chart listing top barriers; narrative and quotes on the right
Risk Assessment and Management
Financial Services
This slide outlines the primary challenges to adopting AI in finance, with data security, lack of skills, and data consistency as top concerns. It includes executive commentary and highlights new risks posed by Gen AI, including legal and ethical issues.
AI barriers, data security, Gen AI risks, finance technology, implementation challenges, compliance, staff resistance
false
Risk Assessment and Management
Financial Services
Mixed Chart
KPMG
Add to my slides
Remove from favorites
Previous
Next
You don't have any favorites yet.
Please wait loading your favorites slides...
Create a FREE account to continue browsing
Receive Instant Access to 1,000+ slides from companies like McKinsey, Google, and Goldman Sachs
First Name
Last Name
Email
Password
I agree to all
Terms & Privacy Policy
Thank you! Your submission has been received!
Oops! Something went wrong while submitting the form.
Have an account?
Sign in
Upgrade to PRO to Save slides
Advanced Search and Filters
Access to 15,000+ slides
Access to Category Pages
Save/Bookmark Slides
PowerPoint Template Library
Pick a Plan
MONTHLY
$12/month
Billed every month, Cancel anytime.
YEARLY
$9/year
Billed $108 annually, Cancel anytime.
Checkout for $12/month
Checkout for $108/yr
Secured by Stripe | AES-256 bit encryption