My Account
My Slides
Search by Category
Companies
Slide Type
Use Case
Industry
Pricing
Templates
View All Templates
Download Template Slides
✦ AI
AI Prompt Library
AI Search
Feedback
Login
Logout
Get Started
Browse all Slides
Browse all Slides
Create a FREE Account
Instant access to 1,000+ real slides from top companies like McKinsey, BCG, Goldman Sachs, Google and many more!
First Name
Last Name
Email
Password
I agree to all
Terms & Privacy Policy
Thank you! Your submission has been received!
Oops! Something went wrong while submitting the form.
Have an account?
Sign in
Saved Slides
Total No. of slides saved
0
↻ Refresh
✖ Clear all
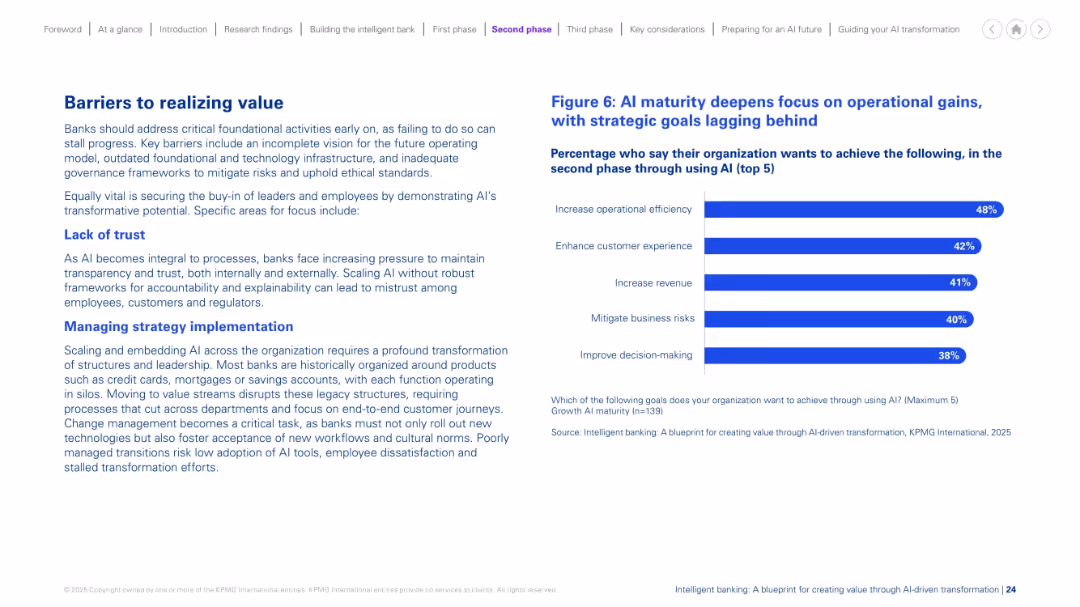
Left-aligned paragraphs describe challenges. Right side has a bar chart listing top AI goals. Balanced layout with headers in blue and clean structure.
Risk Assessment and Management
Financial Services
This slide discusses key obstacles banks face in AI scaling, such as lack of trust and difficulty managing strategic change. It emphasizes transparency, leadership alignment, and breaking down legacy silos. A chart shows the main goals during AI maturity, with a continued focus on efficiency, experience, and revenue.
AI barriers, strategy, trust, legacy systems, maturity, change management
false
Risk Assessment and Management
Financial Services
Mixed Chart
KPMG
Add to my slides
Remove from favorites
The slide offers a visual summary of executive opinions on AI and Cloud benefits through infographics and percentage statistics, with a distinct purple and white color scheme for clarity.
Strategic Planning
Technology & Software
The slide outlines the perceived benefits and untapped potential of AI and Cloud investments among High Tech executives. It acknowledges the pivotal role of Cloud during the pandemic and the need for a clearer cloud strategy to fully unlock its potential.
AI benefits, Cloud potential, High Tech, cost efficiencies, revenue growth, IT modernization, improved productivity, strategic challenges, cloud adoption
false
Strategic Planning
Technology & Software
Multiple Chart
Accenture
Add to my slides
Remove from favorites
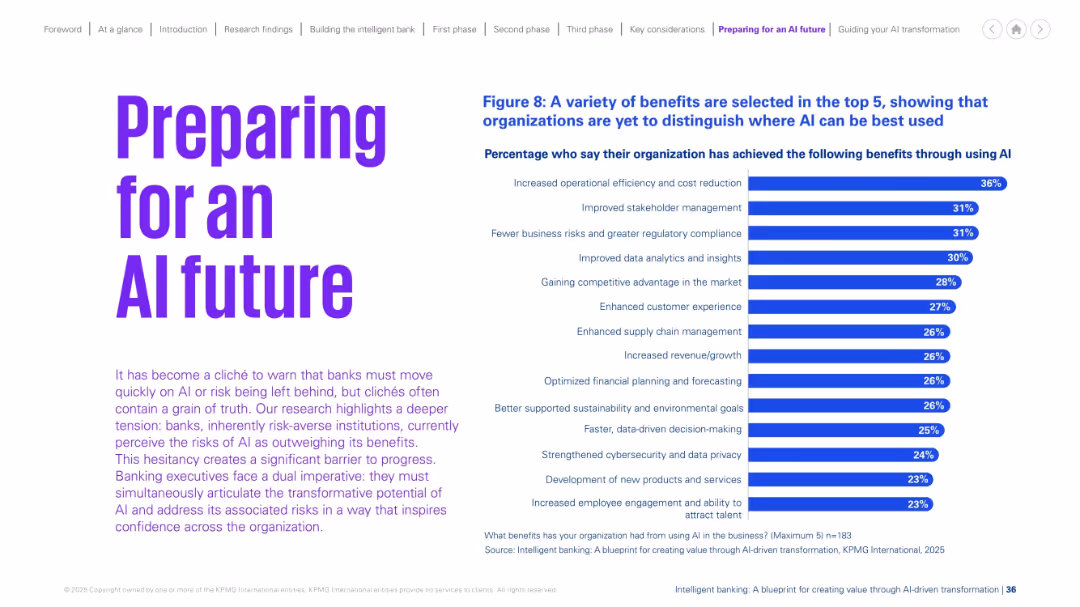
Left-aligned bold heading with a paragraph of explanatory text and a right-aligned bar chart showing benefits of AI.
Technology and Digital Transformation
Financial Services
Highlights benefits achieved through AI such as efficiency, stakeholder management, compliance, and analytics. The data implies organizations are still unclear on where AI yields the greatest value.
AI benefits, operational efficiency, stakeholder management, cost reduction, analytics, transformation, financial planning, sustainability
false
Technology and Digital Transformation
Financial Services
Mixed Chart
KPMG
Add to my slides
Remove from favorites
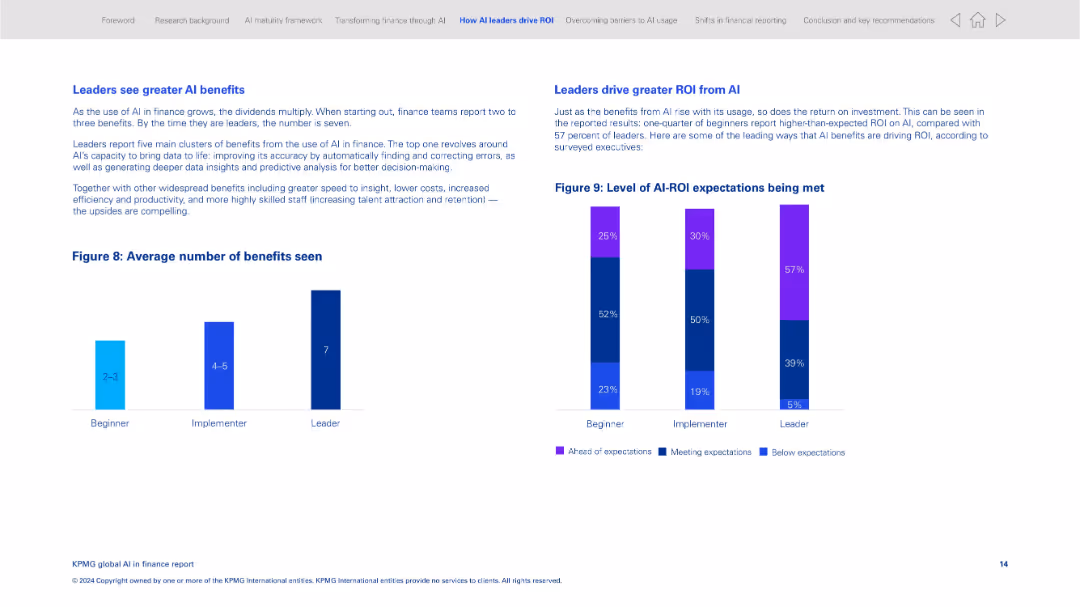
Side-by-side charts and text boxes; minimal layout with bar graph and stacked columns
Performance Metrics and KPIs
Financial Services
The slide compares the average number of benefits seen from AI across beginner, implementer, and leader organizations. It emphasizes how leaders derive greater ROI and more significant benefits from AI implementation, including faster insights and talent retention.
AI benefits, ROI, implementation stages, performance, insights, finance leaders, benchmarking
false
Performance Metrics and KPIs
Financial Services
Multiple Chart
KPMG
Add to my slides
Remove from favorites
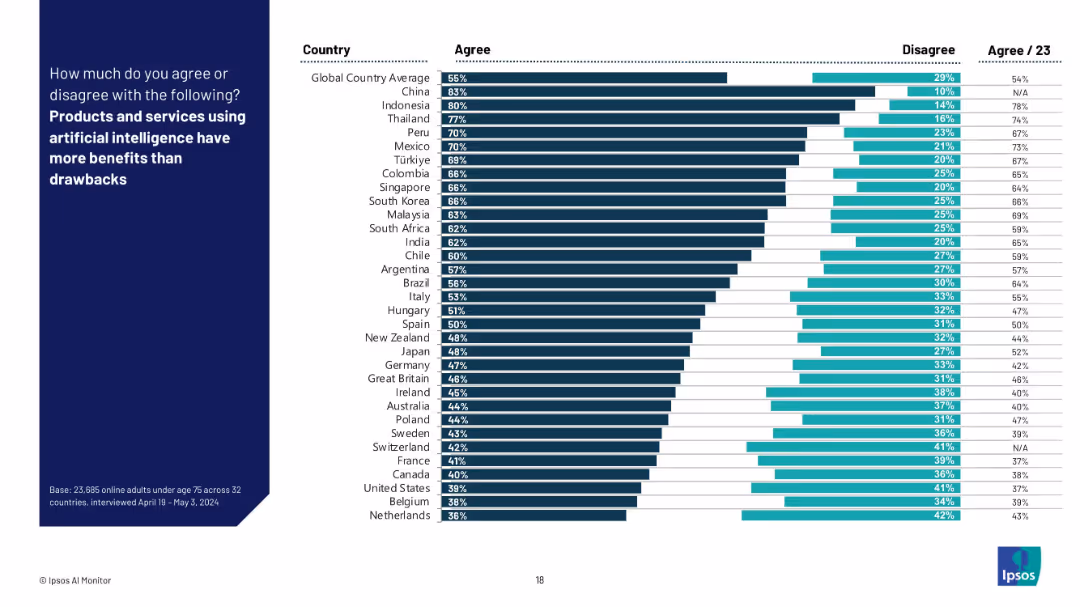
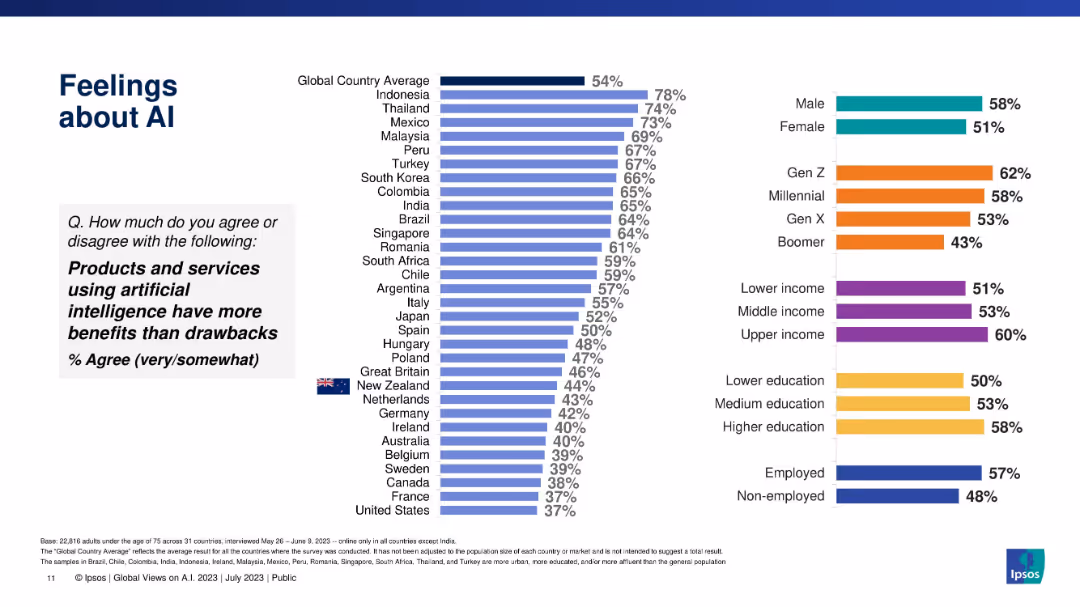
Bar chart format showing % “Agree” and “Disagree” by country with global averages; sorted in descending order of agreement.
Technology and Digital Transformation
Artificial Intelligence
The slide shows the percentage of respondents in each country who believe AI’s benefits outweigh its drawbacks. It reflects overall optimism or skepticism towards AI's societal value and utility.
AI benefits, technology value, opinion survey, Ipsos, optimism, tradeoffs, international data, AI perception, public confidence
false
Technology and Digital Transformation
Artificial Intelligence
Mixed Chart
IPSOS
Add to my slides
Remove from favorites
Circular diagram illustrating the vicious cycle of discrimination and bias aggravated by AI, with sections on world, data, design, and use.
Technology and Digital Transformation
Technology & Software
The slide addresses the issue of discriminatory bias in AI systems, emphasizing the need for efforts to prevent such biases from being embedded. It outlines the cycle of bias, from real-world patterns of inequality to biased AI design and deployment practices, highlighting the challenges and potential solutions for creating fairer AI systems.
AI Bias, Discrimination, Inequality, Fair AI
false
Technology and Digital Transformation
Technology & Software
Linear Flow
Roland Berger
Add to my slides
Remove from favorites
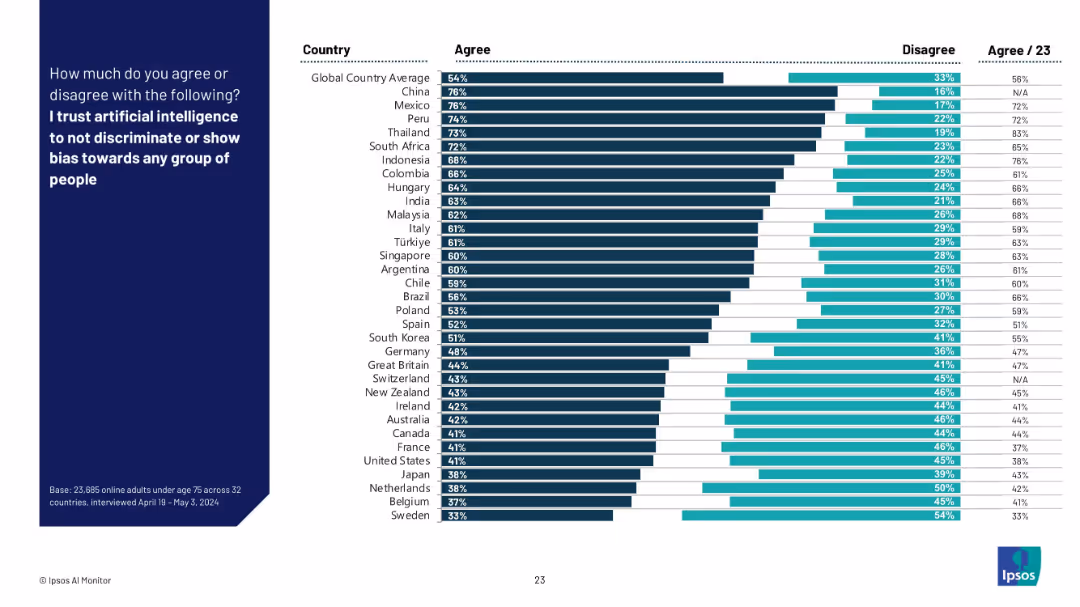
Bar chart by country with % agree and disagree; countries sorted by trust in AI to be unbiased.
Regulatory and Compliance
Artificial Intelligence
This slide presents how much respondents across countries trust AI systems to avoid discrimination or bias. It highlights global perceptions of fairness in AI and potential ethical concerns.
AI bias, fairness, discrimination, trust in AI, ethics, global comparison, Ipsos, regulation, responsible AI
false
Regulatory and Compliance
Artificial Intelligence
Mixed Chart
IPSOS
Add to my slides
Remove from favorites
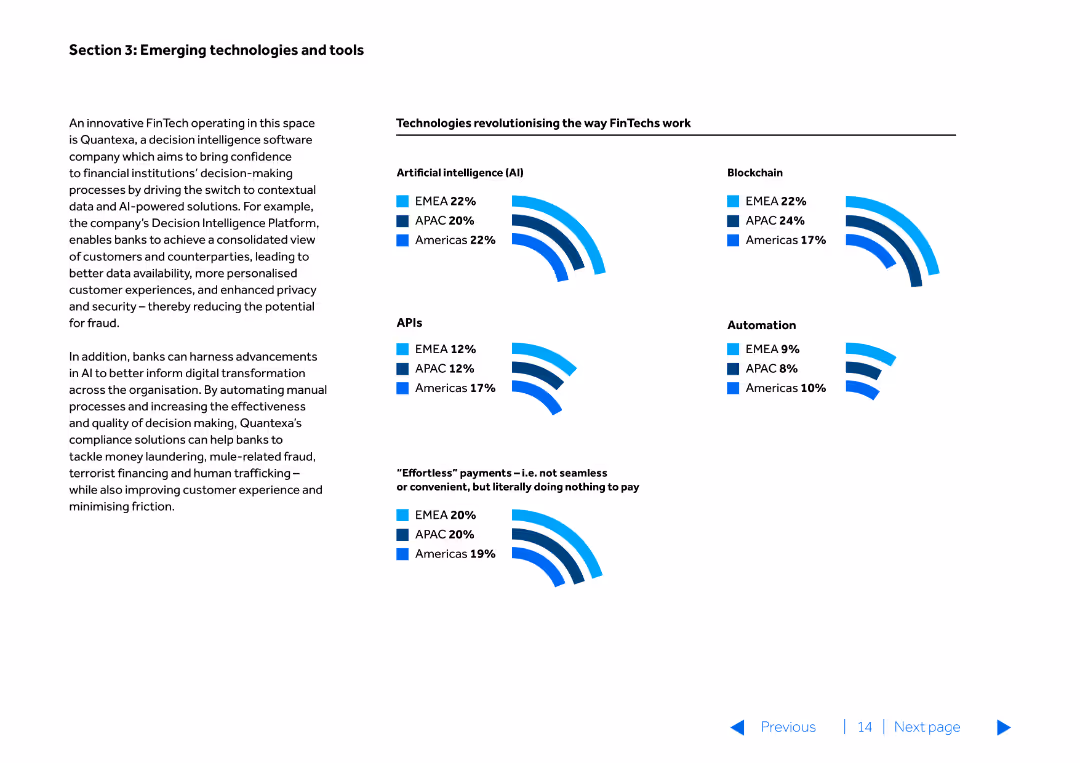
This slide is text-heavy with multiple icons representing different technologies (AI, Blockchain, APIs, Automation). The layout is simple, focusing on the descriptive text and technological impact.
Technology and Digital Transformation
Financial Services
Describes various emerging technologies like AI, blockchain, APIs, and automation, and their transformative impact on the financial services industry.
AI, blockchain, APIs, automation, FinTech
false
Technology and Digital Transformation
Financial Services
Multiple Chart
Barclays
Add to my slides
Remove from favorites
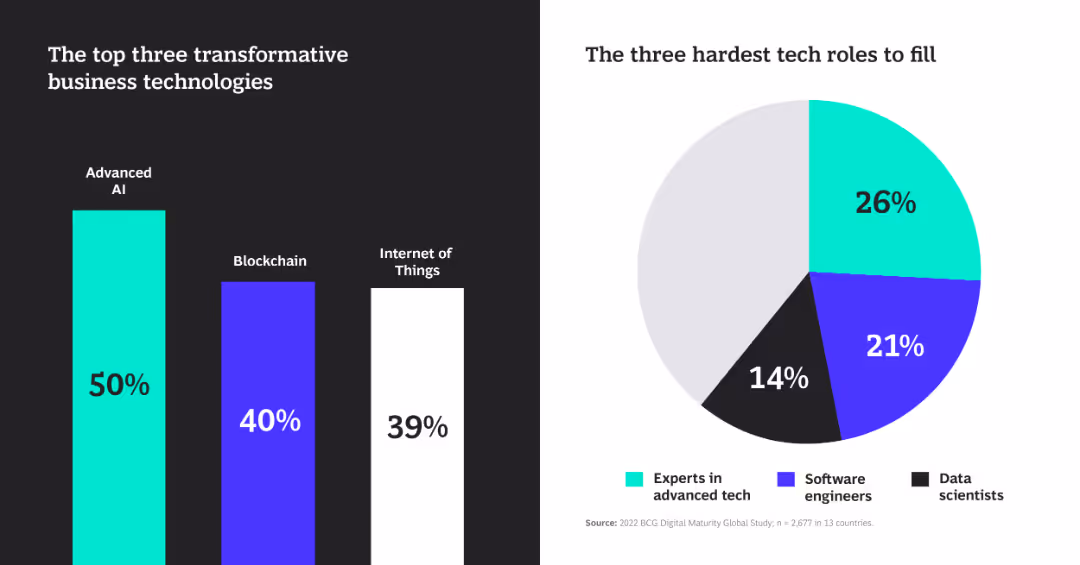
The slide includes a column chart and a pie chart. The column chart shows percentages for transformative technologies, and the pie chart shows hard-to-fill tech roles.
Technology and Digital Transformation
Technology & Software
The slide highlights advanced AI, blockchain, and IoT as top transformative technologies and shows tech roles that are hardest to fill.
AI, blockchain, IoT, technology, roles
false
Technology and Digital Transformation
Technology & Software
Multiple Chart
BCG
Add to my slides
Remove from favorites
Features a stacked column chart representing the importance of AI to American companies' performance in 2023, supplemented by quotes from industry leaders about AI's impact.
Market Analysis and Trends
Technology & Software
Highlights the significant role of AI in enhancing company performance in the U.S., with insights from industry leaders on how AI is transforming business operations and strategy.
AI, business impact, American investors, technology, performance
false
Market Analysis and Trends
Technology & Software
Mixed Chart
Bain
Add to my slides
Remove from favorites
The slide includes a pie chart and a quote, with a clean design focusing on the critical role of AI in business success. The pie chart is green, and the text is concise, making the data and quote stand out effectively.
Technology and Digital Transformation
Technology & Software
Discusses the importance of AI in business, noting that 94% of business leaders believe AI is crucial for success over the next five years. This slide is suitable for presentations on digital transformation and its impact on business growth.
AI, business success, digital transformation, business leaders, future planning, technology impact, enterprise
false
Technology and Digital Transformation
Technology & Software
Mixed Chart
Deloitte
Add to my slides
Remove from favorites
Contains a list of US proprietary data assets and their uses, paired with textual descriptions of AI advantages in Equifax’s operations, emphasizing the integration of AI technologies and data assets.
Technology and Digital Transformation
Technology & Software
The slide provides an overview of how Equifax leverages its proprietary data alongside advanced AI capabilities to enhance decision-making processes and product development, highlighting the strategic use of technology in business.
AI capabilities, proprietary data, technology, Equifax
false
Technology and Digital Transformation
Technology & Software
Header Horizontal
Barclays
Add to my slides
Remove from favorites
Timeline of AI achievements from 2020 to 2050, including tasks like telephone banking, writing a high school essay, and generating a top 40 pop song.
Technology and Digital Transformation
Technology & Software
The slide outlines the projected advancements in AI capabilities over the next few decades. It predicts significant milestones in AI performance, highlighting the increasing complexity and ambition of tasks that intelligent machines will be able to accomplish, potentially surpassing human capabilities.
AI Capabilities, Timeline, Intelligent Machines
false
Technology and Digital Transformation
Technology & Software
Linear Flow
Roland Berger
Add to my slides
Remove from favorites
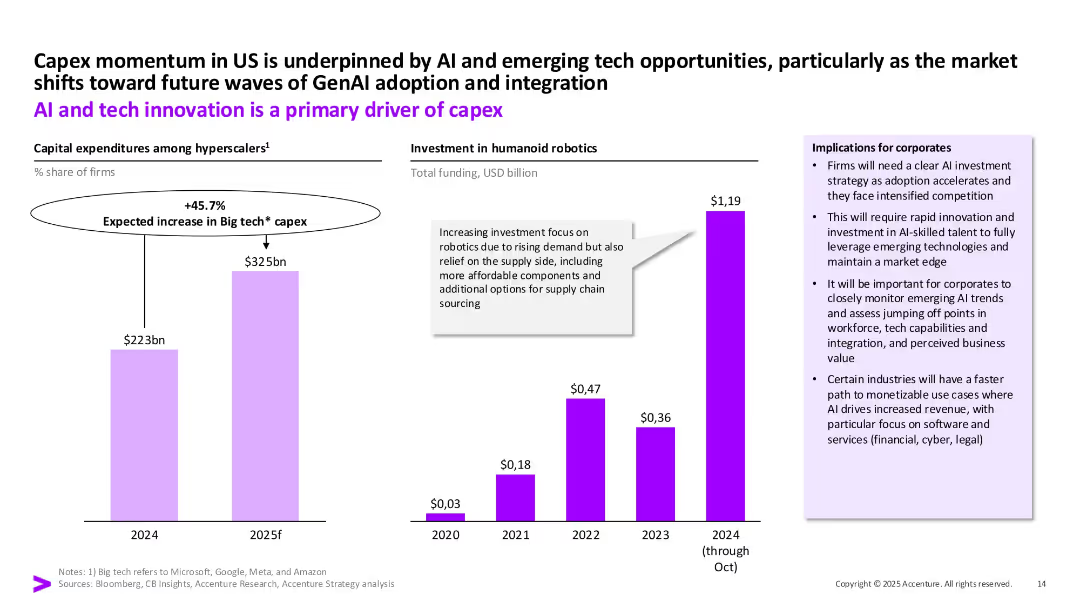
Two side-by-side bar charts (capital expenditures and humanoid robotics investment) with a highlighted box for implications and a callout balloon in center. Purple theme.
Strategic Planning
Technology & Software
This slide outlines how AI and emerging tech, particularly GenAI, are driving capital expenditures in the US. It shows a 45.7% increase in big tech capex and a rising trend in humanoid robotics investment, with corporate implications focused on AI readiness and strategy.
AI, capex, robotics, hyperscalers, investment, GenAI, strategy, innovation
false
Strategic Planning
Technology & Software
Multiple Chart
Accenture
Add to my slides
Remove from favorites
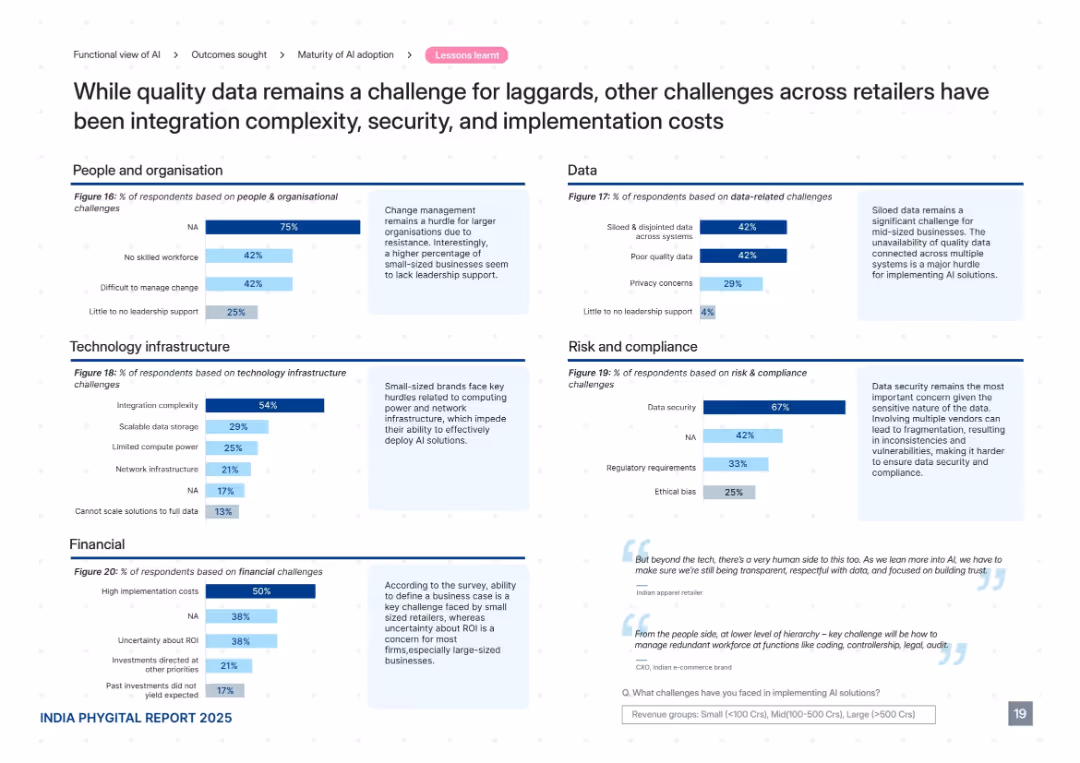
Grid of five charts across categories: People, Tech, Data, Risk, Financial. Each includes horizontal bar graphs with accompanying contextual notes. Soft blue color palette with sectioned layout.
Risk Assessment and Management
Retail & E-commerce
This slide presents challenges to AI adoption among retailers, including data fragmentation, poor quality, integration complexity, high costs, lack of leadership, and ethical concerns. It segments these barriers into five core domains and provides insight into how small and mid-sized businesses especially struggle with foundational AI readiness factors.
AI challenges, data issues, integration, security, cost, leadership, ethics
false
Risk Assessment and Management
Retail & E-commerce
Mixed Chart
PwC/Strategy&
Add to my slides
Remove from favorites
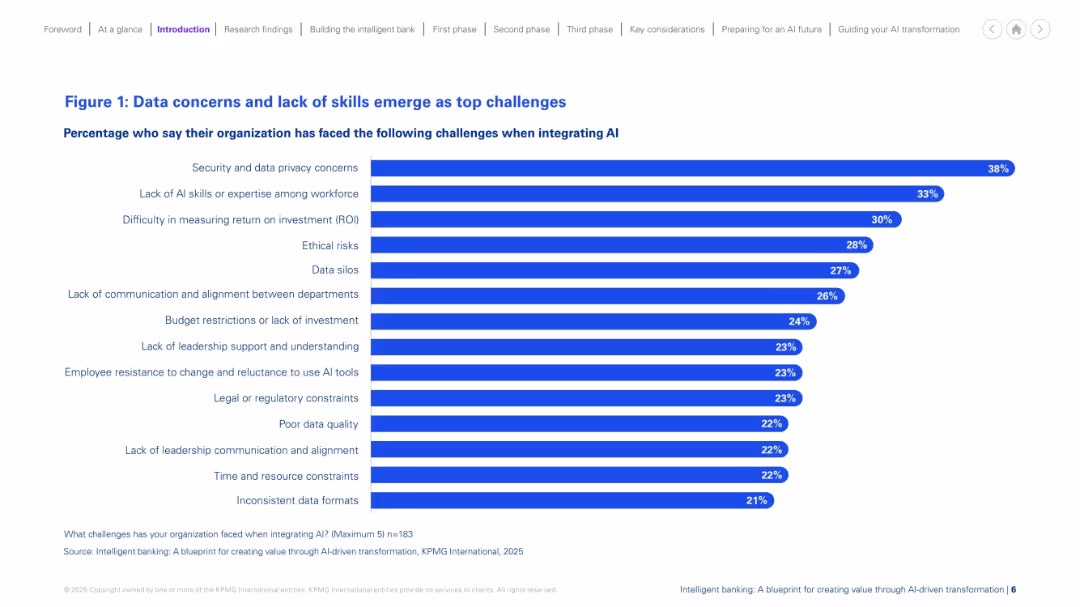
Horizontal bar chart layout on a white background, with bold blue bars and percentage values aligned to the right. Title and subtitle in blue, legend and source at bottom. Clean, structured, minimal visuals.
Risk Assessment and Management
Financial Services
The slide presents the top challenges organizations face when integrating AI. Security and data privacy concerns top the list, followed by lack of AI expertise, and difficulty measuring ROI. Additional barriers include ethical risks, data silos, and lack of leadership support. The data highlights common obstacles that hinder successful AI adoption in financial services.
AI challenges, data privacy, ROI, skills gap, risk, silos, investment, resistance
false
Risk Assessment and Management
Financial Services
Single Chart
KPMG
Add to my slides
Remove from favorites
Features multiple bubble charts overlaid on a light blue background. Each bubble represents a different challenge or inefficiency in AI implementation, with varying sizes indicating prevalence. The layout is uncluttered, focusing on the visual data representation.
Technology and Digital Transformation
Technology & Software
This slide highlights the various challenges and inefficiencies faced by organizations in scaling AI initiatives. It is useful for understanding barriers to technology adoption and strategizing on overcoming these challenges.
AI challenges, inefficiencies, technology adoption, scaling AI, barriers, strategic planning, technology implementation
false
Technology and Digital Transformation
Technology & Software
Multiple Chart
Deloitte
Add to my slides
Remove from favorites
Features bullet points and icons detailing challenges and strategies in AI implementation.
Risk Assessment and Management
Technology & Software
Examines the broader challenges of AI adoption, including labor market shifts, data management, and regulatory concerns.
AI Challenges, Labor Market, Data Management, Regulatory Issues, Risk Management, AI Adoption, Ethical Considerations
false
Risk Assessment and Management
Technology & Software
Multiple Chart
BCG
Add to my slides
Remove from favorites
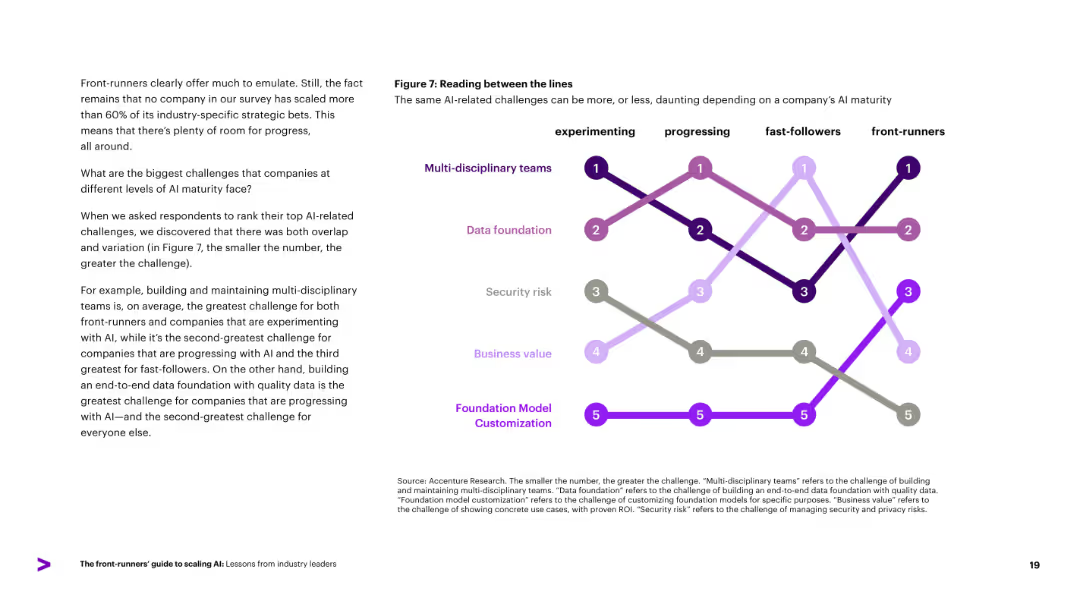
Line chart ranking AI-related challenges (e.g., multi-disciplinary teams, data foundation) across AI maturity levels. Left-aligned explanatory text.
Risk Assessment and Management
Artificial Intelligence
Identifies top AI-related challenges companies face at different maturity levels. Multi-disciplinary teams are the greatest challenge across most groups, followed by data foundation and security risk. Reinforces the idea that challenges evolve as companies mature in AI adoption.
AI challenges, maturity, data foundation, security, cross-functional
false
Risk Assessment and Management
Artificial Intelligence
Diagram
Accenture
Add to my slides
Remove from favorites
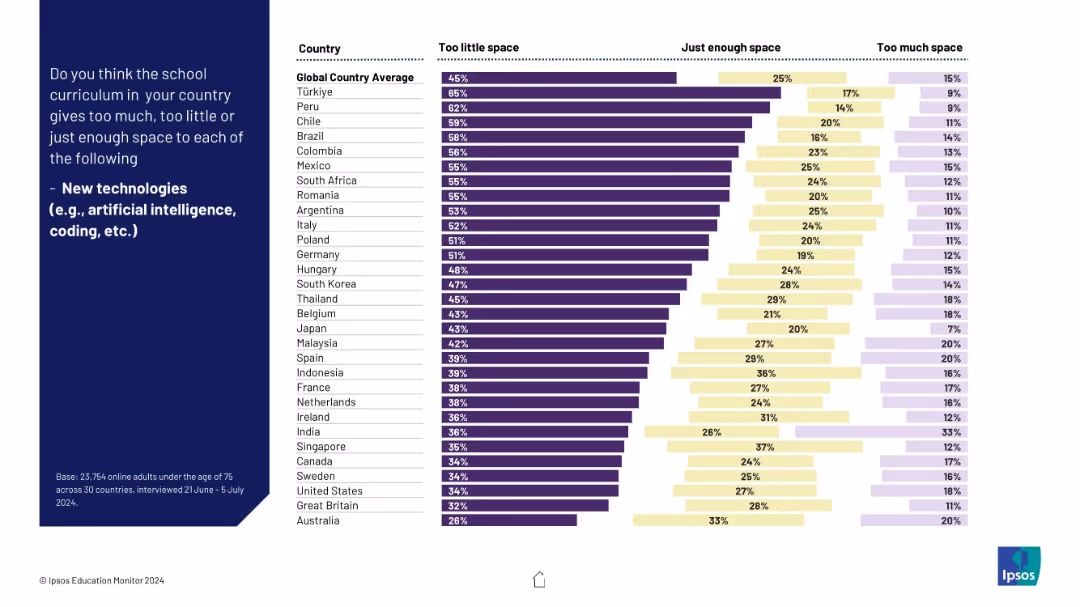
Bar chart with three horizontal sections per country; left-aligned titles; dark to light gradient color bars.
Market Analysis and Trends
Education & Training
The slide illustrates public sentiment about the inclusion of new technologies in school curricula. Many countries believe current curricula allocate too little space for topics like AI and coding, revealing a push for modernization.
AI, coding, curriculum, new tech, digital education, global education, Ipsos, education reform, country comparison, technology integration
false
Market Analysis and Trends
Education & Training
Mixed Chart
IPSOS
Add to my slides
Remove from favorites
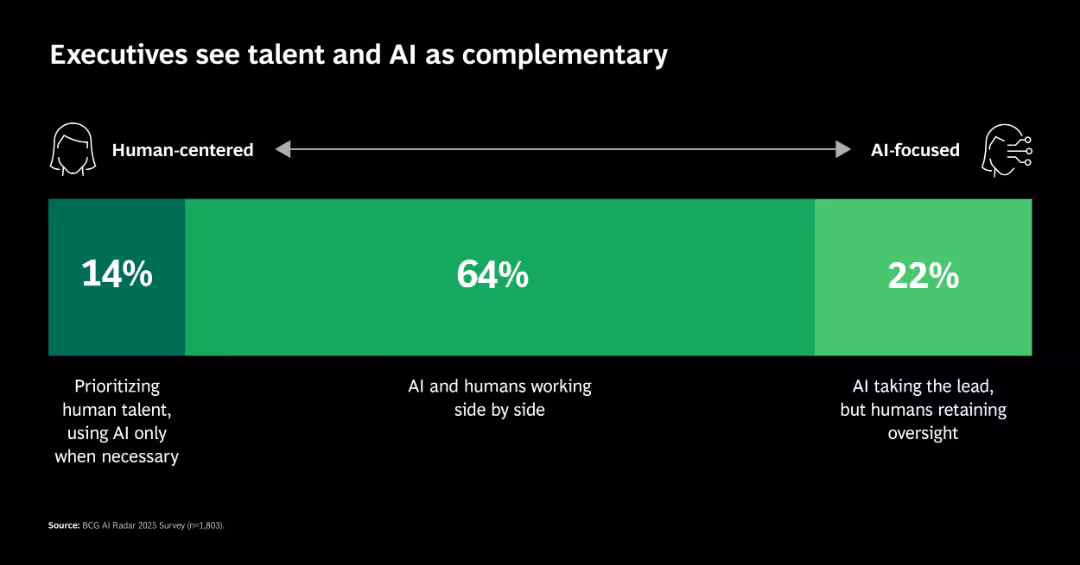
Single segmented horizontal bar showing distribution across a continuum: human-centered, hybrid, and AI-focused approaches.
Human Resources and Talent Management
Artificial Intelligence
Shows that 64% of executives prefer AI-human collaboration, with fewer choosing either extreme (AI-led or human-led). This reflects a trend toward integration rather than substitution.
AI collaboration, workforce, leadership, hybrid roles, talent strategy
false
Human Resources and Talent Management
Artificial Intelligence
Single Chart
BCG
Add to my slides
Remove from favorites
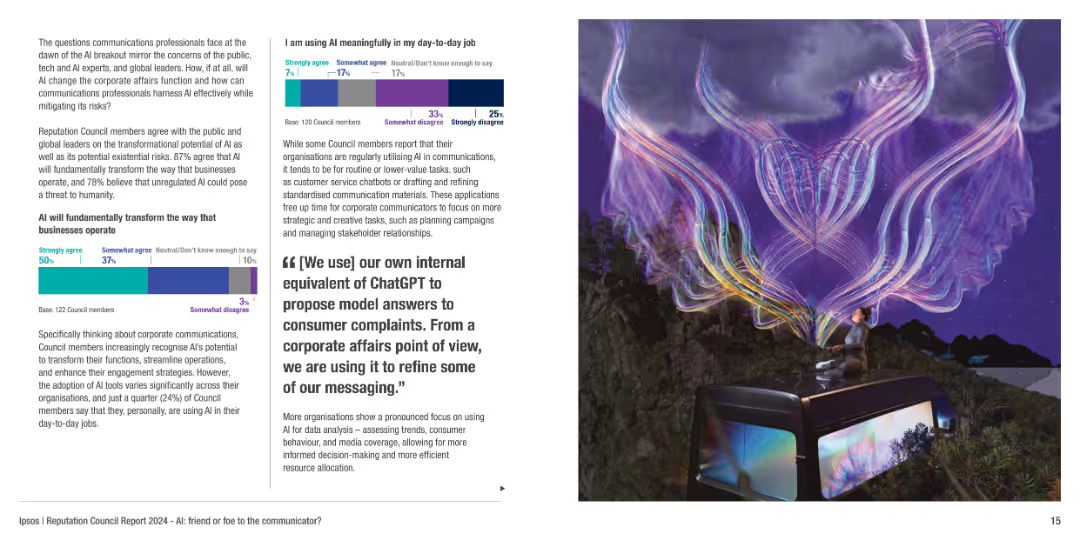
The slide includes a mixture of text, column charts, and a visually striking image depicting AI's impact on communication.
Technology and Digital Transformation
Technology & Software
Discusses the transformative potential of AI in corporate communications, its risks, and how organizations are adapting AI tools for efficiency and engagement.
AI, communication, technology impact, digital transformation, risks
false
Technology and Digital Transformation
Technology & Software
Multiple Chart
IPSOS
Add to my slides
Remove from favorites
The slide includes two pie charts showing percentages and timelines representing early mover advantage in technology. It uses a minimalistic design with a black background and white and red text.
Market Analysis and Trends
Technology & Software
This slide presents data on how AI influences competition in business, emphasizing the advantages of being an early adopter in technological advancements.
AI, competition, technology, early adoption, business models
false
Market Analysis and Trends
Technology & Software
Multiple Chart
Bain
Add to my slides
Remove from favorites
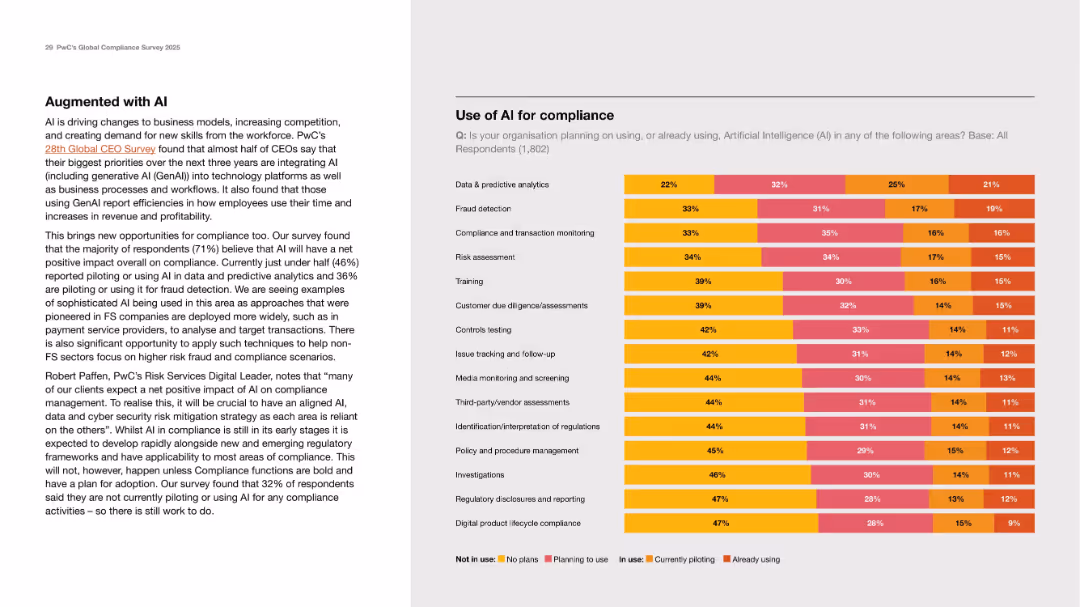
Two-column layout with descriptive text on left and multicolored horizontal stacked bar chart on right.
Technology and Digital Transformation
Artificial Intelligence
This slide explores how organizations are using or planning to use AI for compliance activities. It presents a chart showing the level of AI adoption across 15 areas such as fraud detection, training, and transaction monitoring. The text discusses how AI is expected to positively impact compliance, with 71% expecting a net benefit.
AI, compliance, predictive analytics, fraud detection, digital strategy
false
Technology and Digital Transformation
Artificial Intelligence
Mixed Chart
PwC/Strategy&
Add to my slides
Remove from favorites
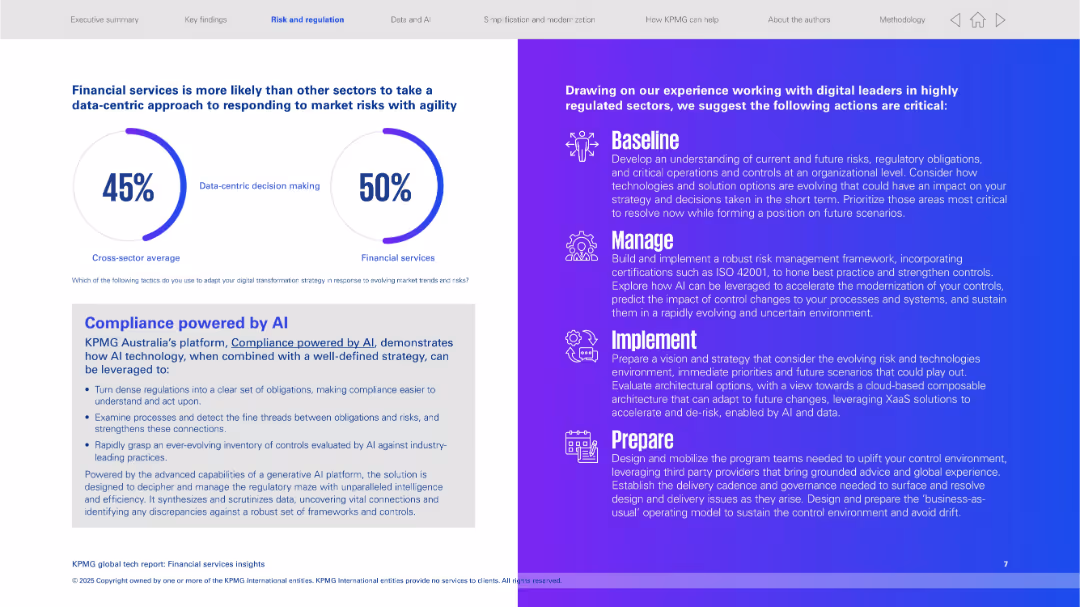
Split layout: left side uses pie-style progress indicators and a text box; right side uses a gradient purple background with white icons and bold headings for 4 steps (Baseline, Manage, Implement, Prepare).
Risk Assessment and Management
Financial Services
The slide highlights the financial services sector's tendency toward data-centric risk responses. It introduces KPMG Australia's AI compliance platform and outlines key strategies for regulated sectors to manage digital transformation, with a strong focus on AI-driven regulatory response and risk framework evolution.
AI compliance, risk management, data-centric, KPMG, regulated sectors, baseline, manage, implement, prepare
false
Risk Assessment and Management
Financial Services
Mixed Chart
KPMG
Add to my slides
Remove from favorites
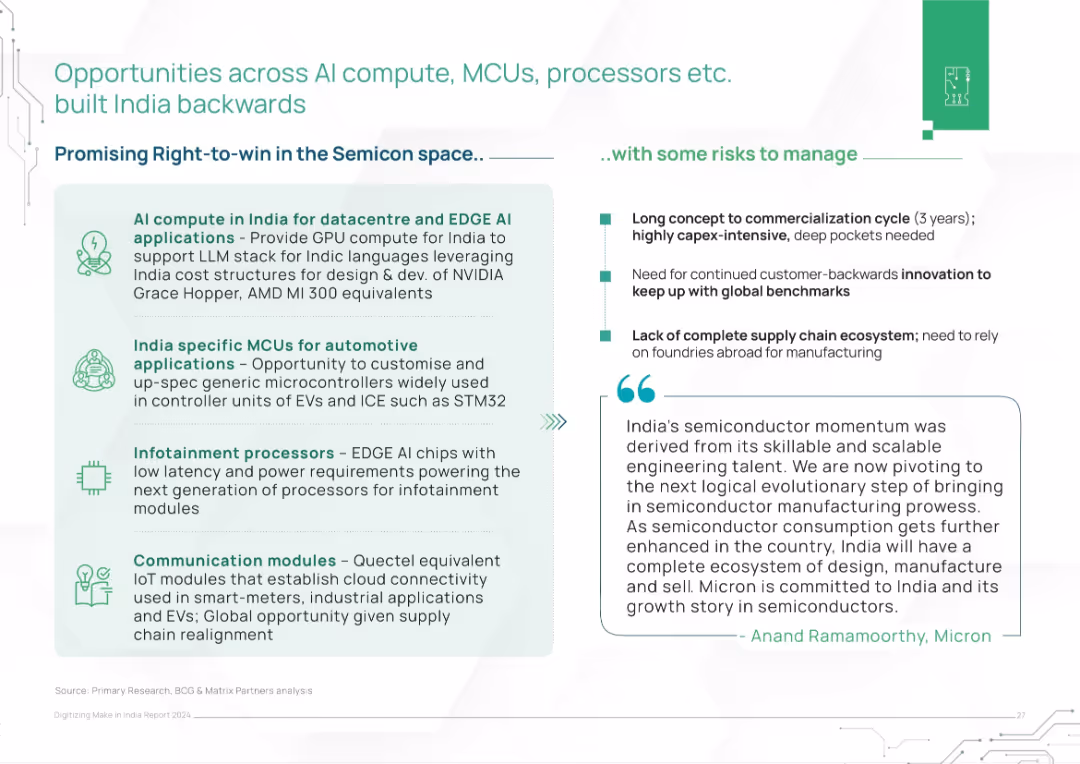
Two-column layout with opportunity areas (left) and risks (right). Includes a quote from Micron executive at the bottom.
Strategic Planning
Artificial Intelligence
The slide identifies semiconductor opportunities in AI compute, automotive MCUs, infotainment processors, and IoT modules. It balances this with risks like long commercialization cycles and supply chain gaps, stressing India's strategic positioning.
AI compute, MCUs, processors, semiconductors, India, risks, IoT, data centers, automotive, supply chain
false
Strategic Planning
Artificial Intelligence
Header Horizontal
BCG
Add to my slides
Remove from favorites
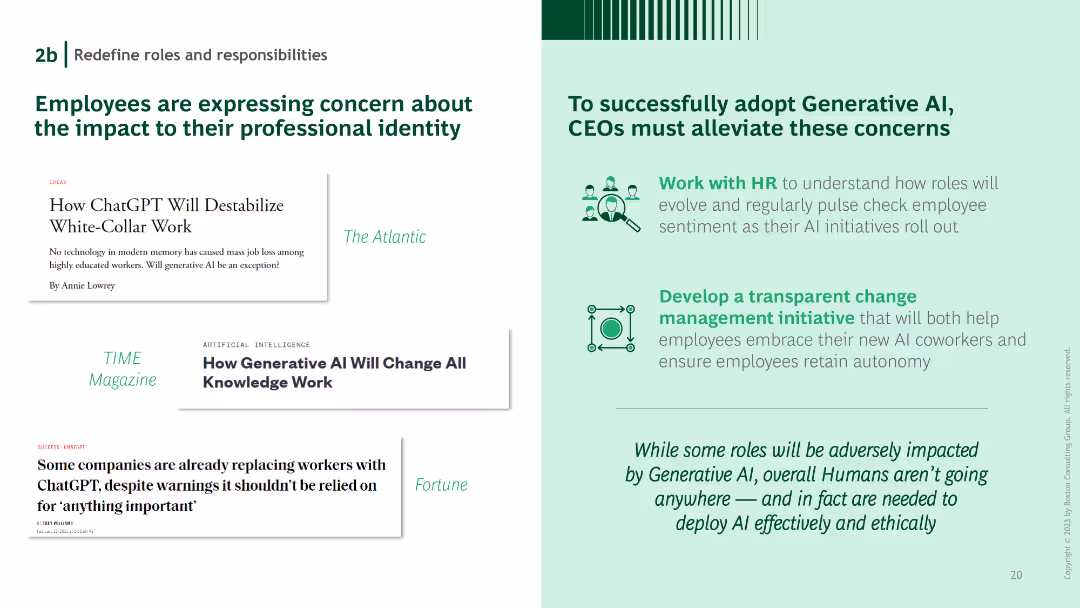
Headlines from major publications on the left, a list of CEO action items on the right. Green text and icons emphasize the points made.
Organizational Structure and Change
Technology & Software
Highlights concerns employees have about AI's impact on professional identity and suggests actions CEOs can take to address these concerns.
AI concerns, professional identity, CEO actions, employee sentiment, organizational change
false
Organizational Structure and Change
Technology & Software
Boxed
BCG
Add to my slides
Remove from favorites
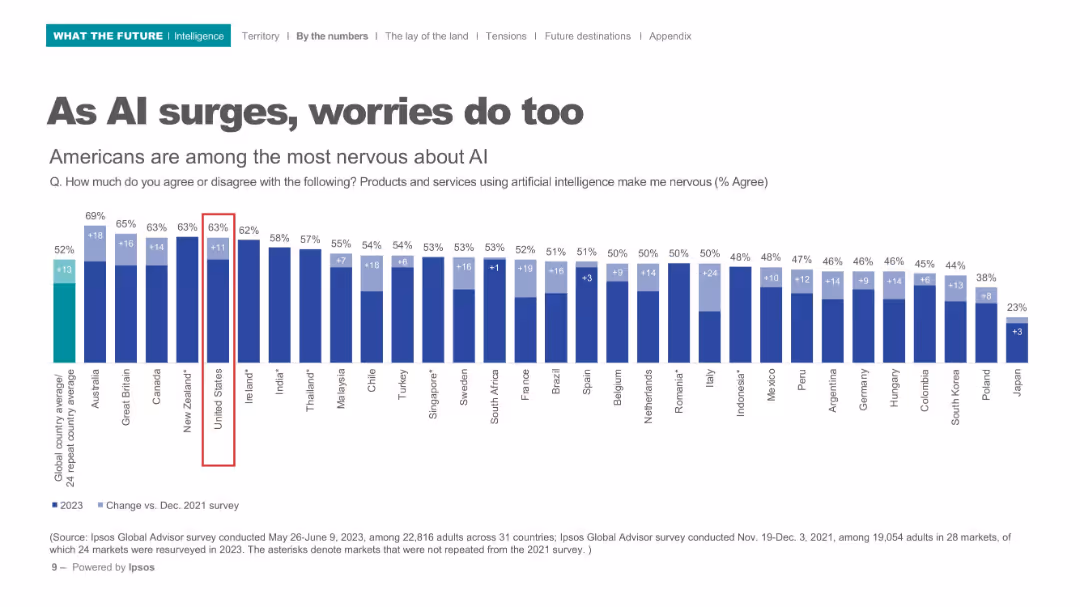
Horizontal bar chart with comparison of global nervousness about AI products/services; dark blue bars on white background.
Risk Assessment and Management
Artificial Intelligence
Depicts nervousness levels around AI across 31 countries, highlighting the U.S. as one of the most apprehensive. Bar chart includes percentage increase from 2021 to 2023.
AI concerns, public perception, international comparison, nervousness, Ipsos, technology anxiety, 2023 survey
false
Risk Assessment and Management
Artificial Intelligence
Single Chart
IPSOS
Add to my slides
Remove from favorites
Two comparative charts showing AI-enabled consumer intelligence platforms and marketing measurement and optimization solutions. One is in green shades, the other in blue.
Market Analysis and Trends
Technology & Software
This slide compares leading AI-enabled solutions in consumer intelligence and marketing measurement. It highlights strong performers and leaders in the market.
AI, Consumer Intelligence, Marketing, Optimization, Trends
false
Market Analysis and Trends
Technology & Software
Multiple Chart
IPSOS
Add to my slides
Remove from favorites
Features text and pie charts, focusing on the use of AI in consumer market trends. Blue and grey theme.
Market Analysis and Trends
Technology & Software
Discusses the trends and implications of AI in consumer markets, including how AI technologies are being integrated into various consumer business practices and their impact on market dynamics.
AI, consumer markets, trends, integration, business practices
false
Market Analysis and Trends
Technology & Software
Multiple Chart
Deloitte
Add to my slides
Remove from favorites
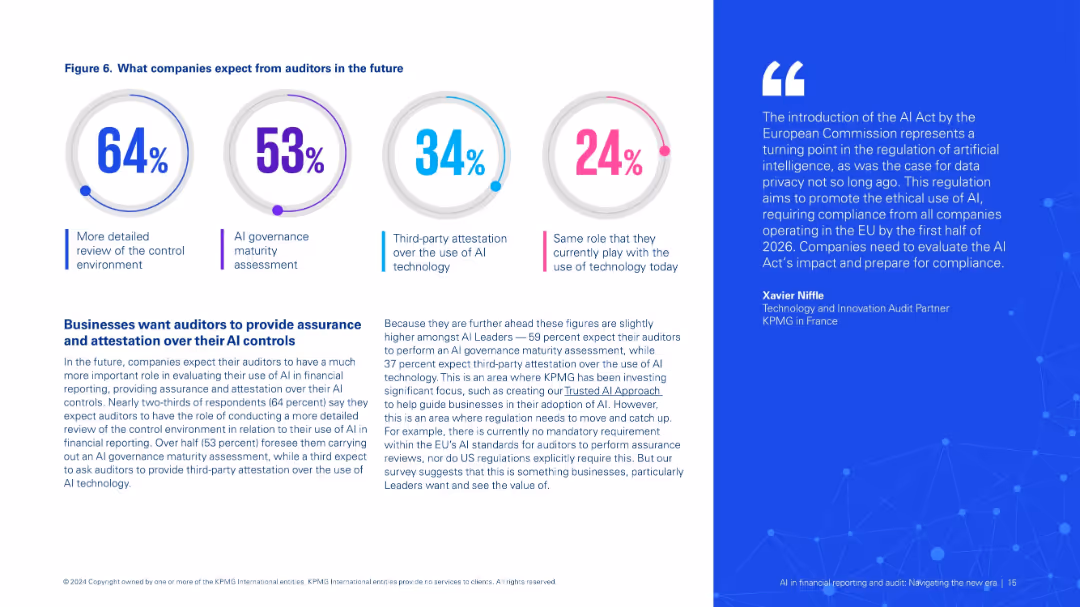
Circular infographic with four expectations, paired with detailed explanation and expert quote on AI auditing trends.
Regulatory and Compliance
Financial Services
Shows what companies expect from auditors regarding AI controls, including more thorough reviews, governance assessments, and attestation roles. Discusses gaps in current regulatory frameworks and future compliance needs.
AI controls, auditing, governance, compliance, EU AI Act, assurance, risk
false
Regulatory and Compliance
Financial Services
Mixed Chart
KPMG
Add to my slides
Remove from favorites
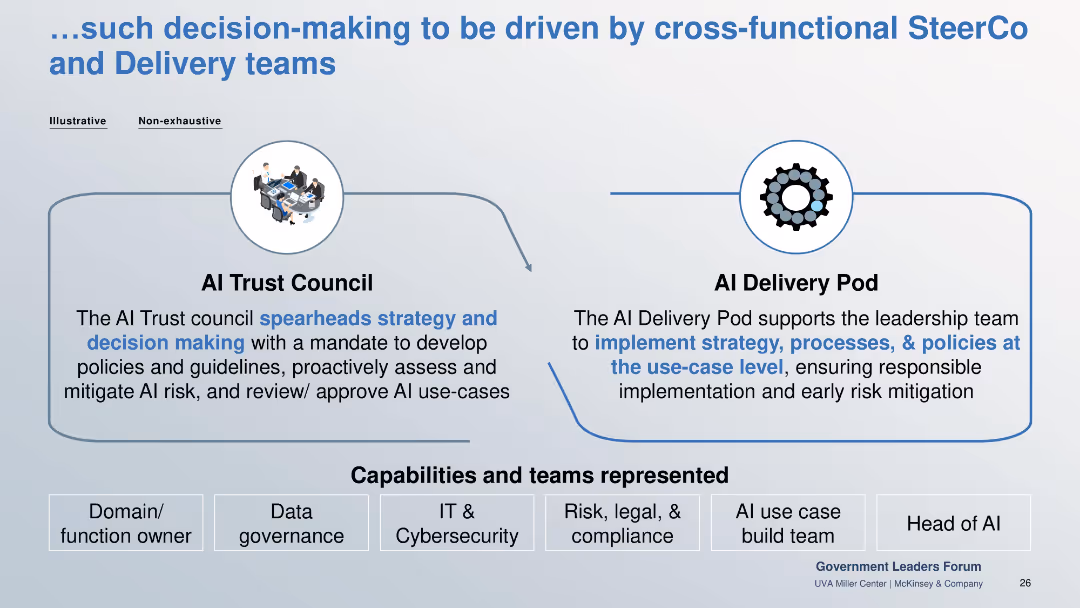
Two-box structure for AI Trust Council and AI Delivery Pod. Capabilities listed below include cybersecurity, legal, and AI use case teams.
Organizational Structure and Change
Government & Public Sector
Describes decision-making structure for responsible AI: a strategy-setting AI Trust Council and execution-focused AI Delivery Pod, backed by multidisciplinary teams.
AI council, delivery pod, cross-functional, risk mitigation, governance, compliance
false
Organizational Structure and Change
Government & Public Sector
Linear Flow
McKinsey
Add to my slides
Remove from favorites
Diagram highlighting AI's entrance into the creative industries, with examples from performing, literary, media, and visual arts.
Market Analysis and Trends
Media & Entertainment
The slide explores how AI has been successfully integrated into creative fields, providing examples of AI-generated works in music, art, literature, and media. It highlights the diverse applications of AI in the creative realm, showcasing its potential to innovate and transform traditional artistic processes.
AI, Creative Industries, Music, Art
false
Market Analysis and Trends
Media & Entertainment
Framework
Roland Berger
Add to my slides
Remove from favorites
Slide with text on the left, multiple tables on the right, showing current and projected AI usage percentages
Technology and Digital Transformation
Financial Services
Examines the impact of AI on customer service in wealth management, forecasting significant adoption in coming years.
AI, customer service, wealth management, investment, advisory, performance analysis
false
Technology and Digital Transformation
Financial Services
Table
Deloitte
Add to my slides
Remove from favorites
Bar chart showing the number of AI players by country and column charts comparing the revealed comparative advantage of leading geographic areas for various AI domains.
Technology and Digital Transformation
Technology & Software
This slide emphasizes the importance of data in optimizing artificial intelligence and presents data on the number of AI players by country. It compares the strengths of different regions in AI domains like natural language processing and machine learning, highlighting the global competition in AI development.
AI, Data Optimization, Geographic Advantage, AI Players
false
Technology and Digital Transformation
Technology & Software
Multiple Chart
Roland Berger
Add to my slides
Remove from favorites
The slide features two sections: "Automated Buying" on the left with an icon of a smart fridge and text, and "Interactive Shelves" on the right with a photo of a woman interacting with a screen. Both sections have trend assessment bars indicating "Prepare" and "Watch" with impact on industry and time of mainstream adoption.
Technology and Digital Transformation
Technology & Software
Describes the concepts of automated buying and interactive shelves in the context of AI and data era, highlighting how these technologies can improve shopping experiences and customer retention. The slide also includes trend assessments and industry impact projections.
AI, Data, Retail, Technology, Innovation
false
Technology and Digital Transformation
Technology & Software
Multiple Chart
Deloitte
Add to my slides
Remove from favorites
Features graphs showing the impact of AI debiasing algorithms on fairness and accuracy.
Technology and Digital Transformation
Technology & Software
Discusses the effectiveness of AI debiasing algorithms in improving fairness while balancing accuracy.
AI, debiasing, algorithms, fairness, accuracy
false
Technology and Digital Transformation
Technology & Software
Multiple Chart
PwC/Strategy&
Add to my slides
Remove from favorites
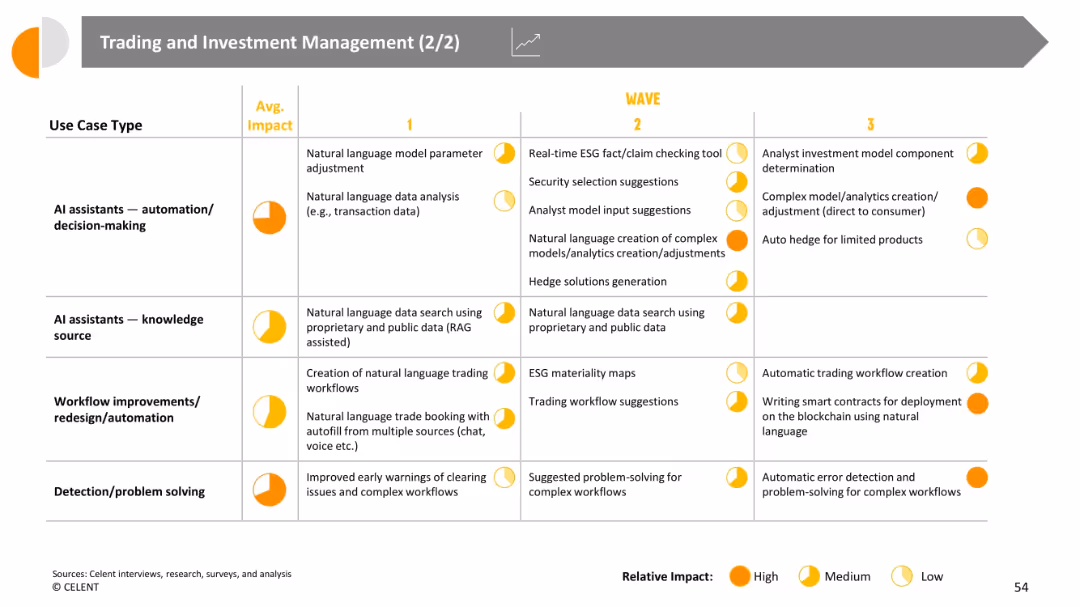
Continuation of tabular matrix; more technical/decision-making AI use types; average impact highlighted for each use case
Risk Assessment and Management
Financial Services
Shows advanced AI use cases including automation/decision-making, workflow redesign, and error/problem detection. Highlights advanced automation of trading logic, smart contracts, and risk management processes across three waves.
AI decision-making, risk models, workflow automation, smart contracts, GenAI in trading
false
Risk Assessment and Management
Financial Services
Single Chart
Oliver Wyman
Add to my slides
Remove from favorites
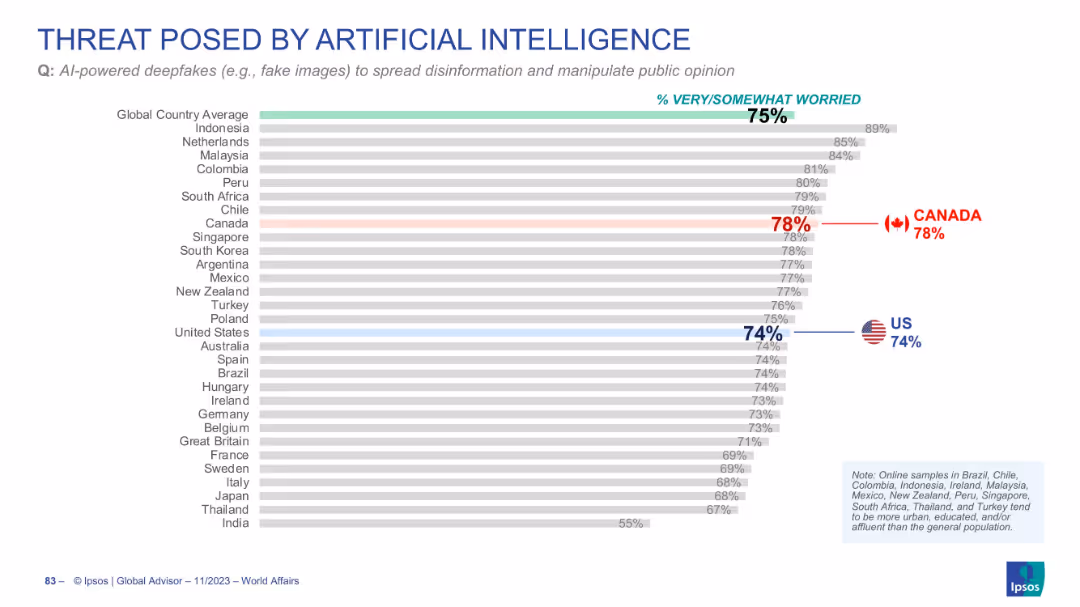
Horizontal bar chart displaying concern over AI-powered deepfakes
Risk Assessment and Management
Artificial Intelligence
Public concern about deepfakes as a tool for disinformation is high globally (75%). Canada (78%) and the US (74%) also show significant concern on this issue.
AI deepfakes, disinformation, public opinion, global perception, misinformation
false
Risk Assessment and Management
Artificial Intelligence
Single Chart
IPSOS
Add to my slides
Remove from favorites
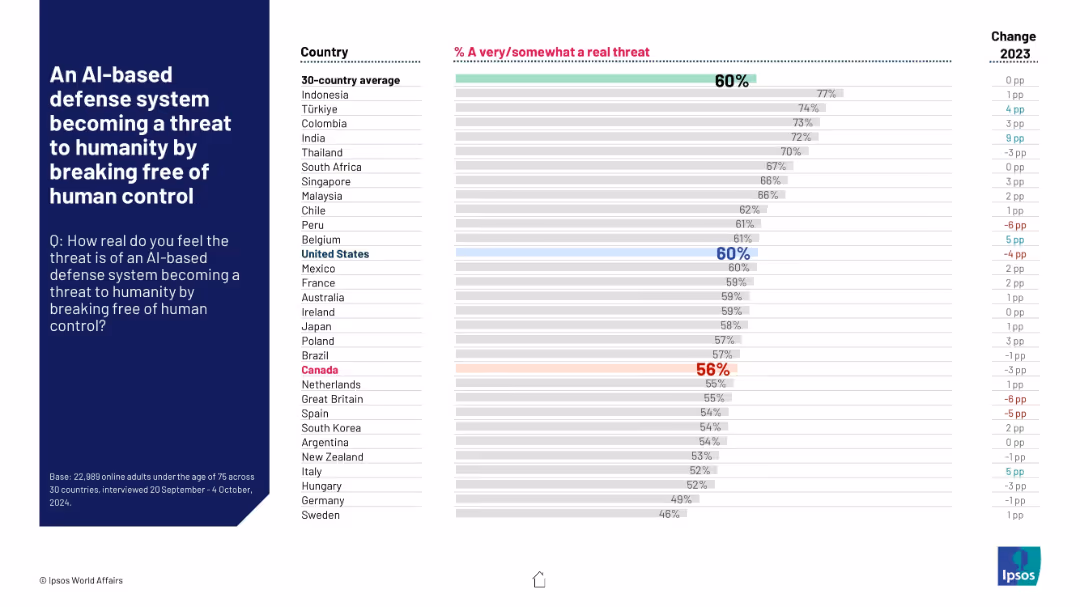
Horizontal bar graph ranking countries' fears of AI-based defense system threats; 30-country average shown.
Risk Assessment and Management
Artificial Intelligence
This slide captures international sentiment on the perceived risk of AI-driven defense systems losing human oversight. The global average concern is 60%, with the U.S. matching this rate and Canada slightly lower at 56%.
AI, defense, risk perception, public opinion, Ipsos, control, technology fears, threat, survey, 2024
false
Risk Assessment and Management
Artificial Intelligence
Mixed Chart
IPSOS
Add to my slides
Remove from favorites
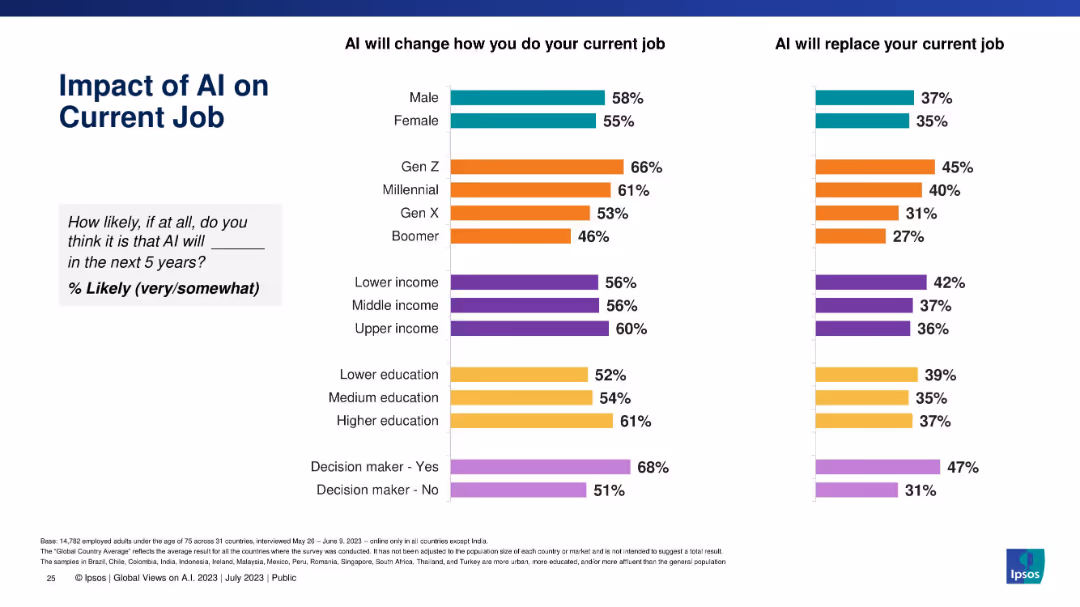
Vertical bar charts comparing likelihood of AI impact by demographics (gender, generation, income, education, decision-maker status).
Market Analysis and Trends
Artificial Intelligence
This demographic breakdown shows how different groups perceive AI’s likelihood to change or replace their current job roles. Gen Z and decision-makers show the highest belief in job changes due to AI.
AI, demographics, job impact, survey, gender, generation, education, income, decision makers
false
Market Analysis and Trends
Artificial Intelligence
Single Chart
IPSOS
Add to my slides
Remove from favorites
This slide features a large pie chart, presented in a green and white color scheme for clear differentiation of data points. The layout is clean and focuses on the main data visualization elements.
Technology and Digital Transformation
Technology & Software
Analyzes trends in AI deployment and investment, showing a significant increase in AI applications and investment plans. It is relevant for discussions on technology budgeting and strategic investment in the tech industry.
AI deployment, investment trends, technology, strategic investment, tech industry, application increase, budgeting
false
Technology and Digital Transformation
Technology & Software
Mixed Chart
Deloitte
Add to my slides
Remove from favorites
Contains four numbered sections, each describing a different strategy for overcoming AI deployment challenges, presented in a clear and structured manner. The use of icons and minimal text helps emphasize the strategies effectively.
Technology and Digital Transformation
Technology & Software
Offers strategies for optimizing AI deployment, including investing in culture and leadership, transforming operations, and orchestrating tech and talent. This slide is ideal for strategic planning sessions in technology sectors.
AI deployment, strategies, culture investment, operations transformation, tech orchestration, strategic planning
false
Technology and Digital Transformation
Technology & Software
Linear Flow
Deloitte
Add to my slides
Remove from favorites
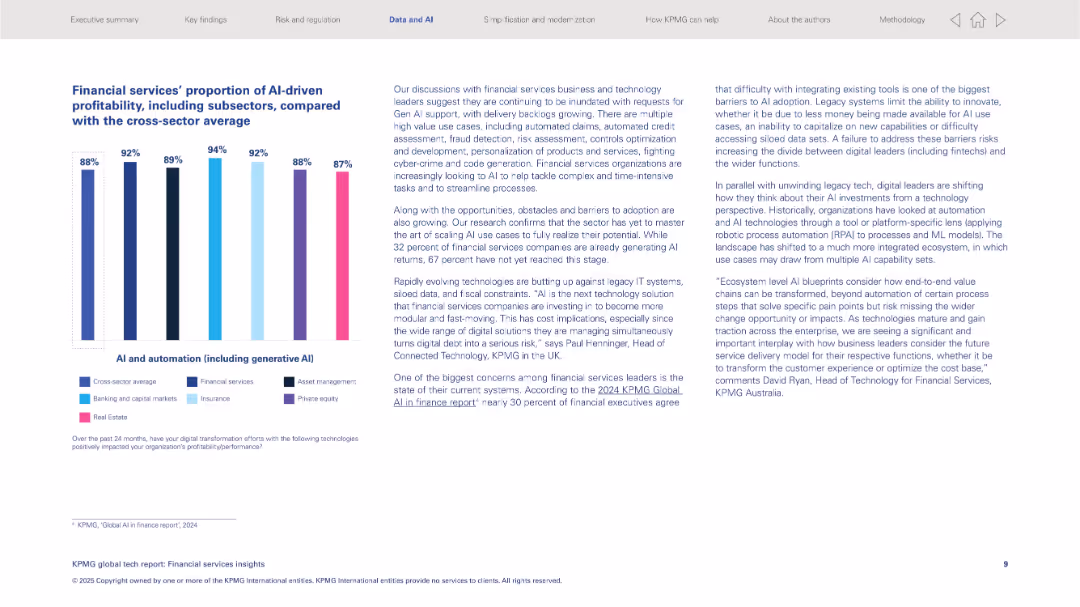
Left: vertical bar chart comparing AI-driven profitability across sectors. Right: detailed paragraph insights.
Technology and Digital Transformation
Financial Services
Presents comparative AI-driven profitability across financial subsectors, noting financial services are advanced but still face challenges with AI scaling. Emphasizes rapid tech evolution and integrated ecosystems as essential to digital leadership.
AI-driven profitability, banking, fintech, tech debt, scaling AI, digital leaders, automation
false
Technology and Digital Transformation
Financial Services
Mixed Chart
KPMG
Add to my slides
Remove from favorites
Features a line graph projecting economic growth under different AI adoption scenarios against a baseline. The graph is color-coded to distinguish between aggressive, cautious, and people-centric adoption scenarios, showing potential gains in trillions of dollars.
Strategic Planning
Technology & Software
Outlines the economic potential of adopting AI responsibly, highlighting different scenarios and their impact on economic growth.
AI, Economy, Growth, Adoption Scenarios, Potential, Trillions, Impact, Responsible, Technology
false
Strategic Planning
Technology & Software
Single Chart
Accenture
Add to my slides
Remove from favorites
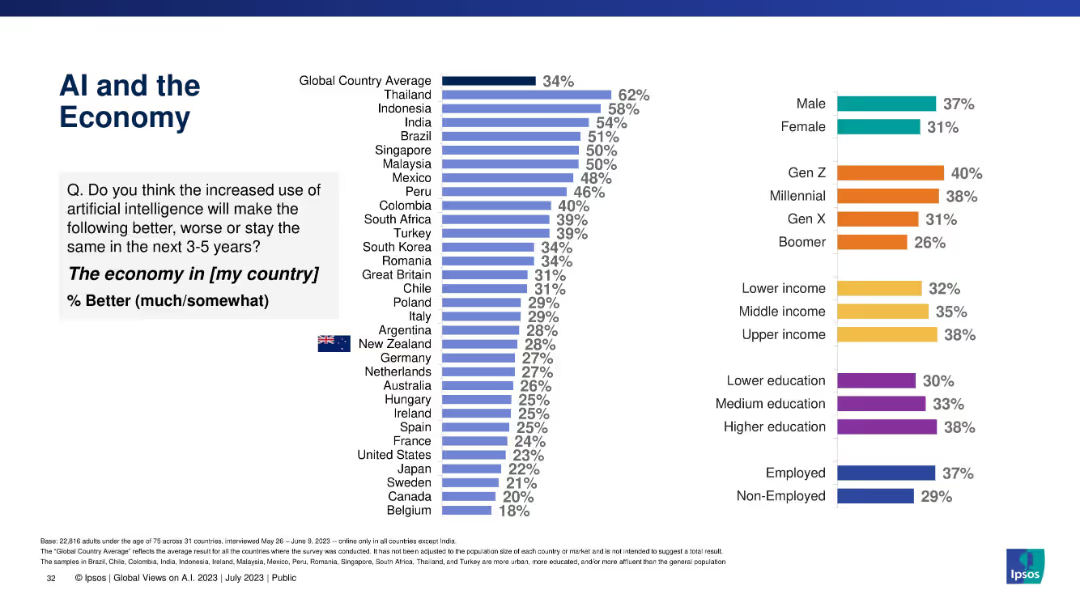
Global and demographic bar charts evaluating whether people believe AI will positively impact their national economy in 3–5 years.
Strategic Planning
Artificial Intelligence
This slide outlines beliefs about AI’s macroeconomic effects. While developing nations are more optimistic, developed countries like New Zealand show lower confidence in economic benefits from AI.
AI, economy, national outlook, public sentiment, Ipsos, perception, future, demographic split
false
Strategic Planning
Artificial Intelligence
Multiple Chart
IPSOS
Add to my slides
Remove from favorites
Contains lists, bold headers, and a central illustrative panel showing a group discussion around a table, signifying collaboration and strategy in AI implementation.
Technology and Digital Transformation
Technology & Software
Advocates for a strategic approach to AI ecosystems, emphasizing the need for collaboration, data access, and careful partner selection to optimize AI technologies and cost efficiency.
AI ecosystem, collaboration, data access, strategic planning, cost management
false
Technology and Digital Transformation
Technology & Software
Header Vertical
BCG
Add to my slides
Remove from favorites
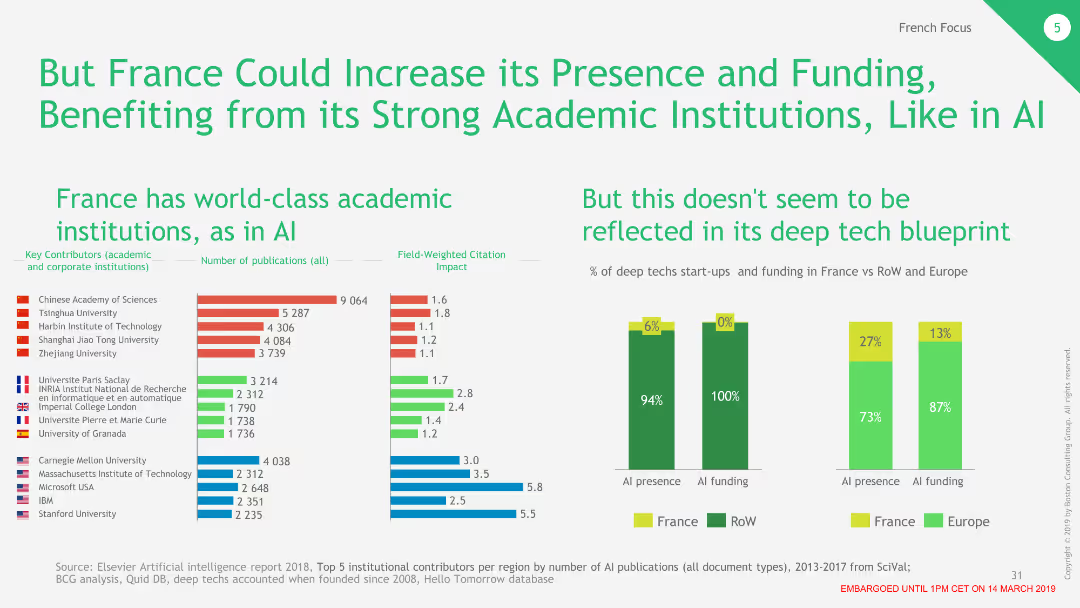
The slide contains two column charts and a list of top contributors by publications in AI, with France highlighted in green.
Market Analysis and Trends
Education & Training
Highlights the disparity between France's strong academic presence in AI and its limited deep tech funding compared to RoW and Europe.
AI, education, funding, deep tech, France
false
Market Analysis and Trends
Education & Training
Multiple Chart
BCG
Add to my slides
Remove from favorites
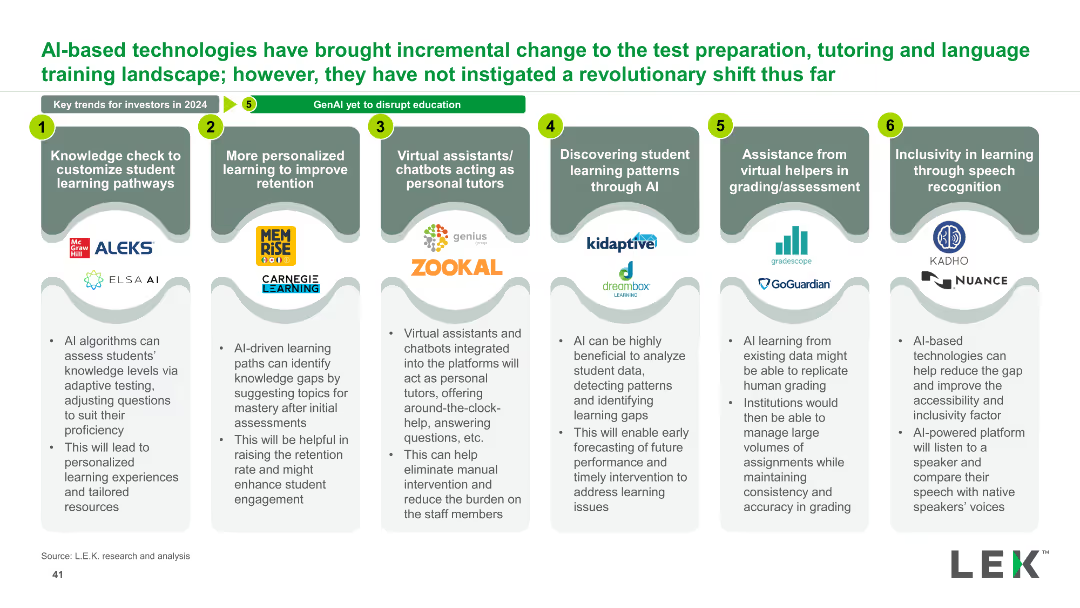
The slide has six sections, each with a heading, a description, and logos. Sections are aligned horizontally with numbers 1 to 6. Visuals include icons and logos.
Market Analysis and Trends
Education & Training
Discusses incremental changes brought by AI-based technologies in education, including personalized learning, virtual tutors, AI learning patterns, and inclusivity through speech recognition.
AI, education, personalized learning, virtual tutors, speech recognition, incremental change
false
Market Analysis and Trends
Education & Training
Pillar
LEK
Add to my slides
Remove from favorites
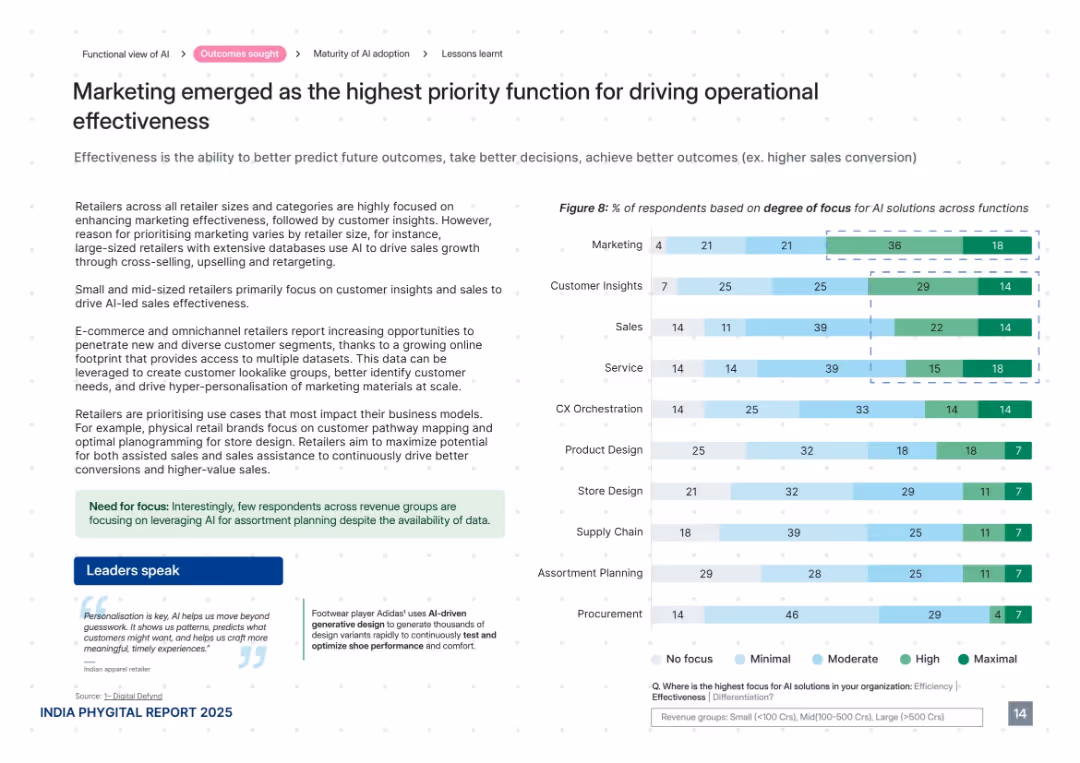
Clear, structured layout with explanatory text, bar graph on right, and quotes below. Uses light greens and blues with white space.
Performance Metrics and KPIs
Retail & E-commerce
This slide shows that marketing is the most focused AI function for driving effectiveness in retail. It outlines how AI is used to predict outcomes and enable data-driven decision-making, with small and mid-sized retailers focused on customer insights and sales. It also mentions the rise of omnichannel approaches and use of customer lookalike models.
AI effectiveness, marketing, customer insights, personalization, retail analytics, targeting, KPIs, sales conversion
false
Performance Metrics and KPIs
Retail & E-commerce
Mixed Chart
PwC/Strategy&
Add to my slides
Remove from favorites
A column chart displays percentages of respondents' views on AI's impact on job numbers in their companies in France, indicating a predominant expectation of minor or no impact.
Market Analysis and Trends
Technology & Software
Analyzes expectations regarding AI's impact on employment within American companies in France, suggesting a limited effect on job numbers despite the technology's growing influence.
AI, employment impact, France, technology, expectations
false
Market Analysis and Trends
Technology & Software
Single Chart
Bain
Add to my slides
Remove from favorites
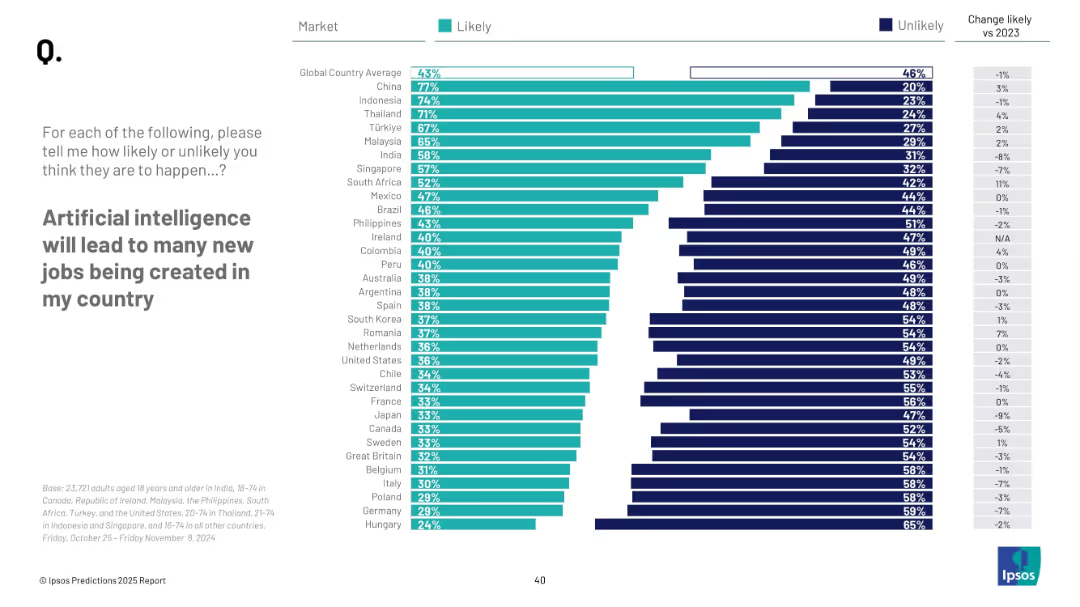
Horizontal bar chart; teal for "Likely", navy for "Unlikely"; countries listed with % values; right column shows change vs 2023
Market Analysis and Trends
Artificial Intelligence
This slide presents public opinion data from 29 countries on whether AI will create new jobs domestically. It ranks countries by perceived likelihood, with a global average of 43% likely.
AI, employment, public perception, survey, Ipsos, job creation, 2025 prediction, workforce, innovation, optimism
false
Market Analysis and Trends
Artificial Intelligence
Mixed Chart
IPSOS
Add to my slides
Remove from favorites
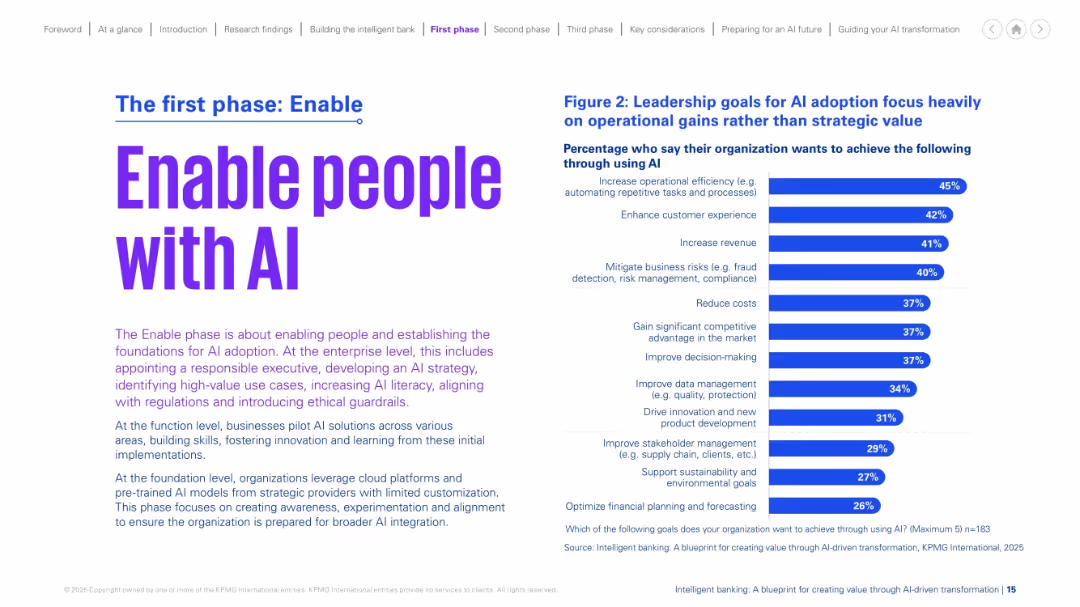
Left-aligned title and explanatory paragraph. On the right, a bar chart showing leadership goals for AI. Purple accents on a white background with clean layout.
Strategic Planning
Financial Services
The slide focuses on the "Enable" phase of AI adoption, emphasizing the need to prepare people and foundational systems. It outlines top leadership goals, such as improving efficiency, customer experience, and mitigating risks. It underscores the importance of AI literacy, ethical alignment, and building a strong initial base for scaling AI.
AI enablement, goals, leadership, preparation, ethics, literacy, transformation
false
Strategic Planning
Financial Services
Mixed Chart
KPMG
Add to my slides
Remove from favorites
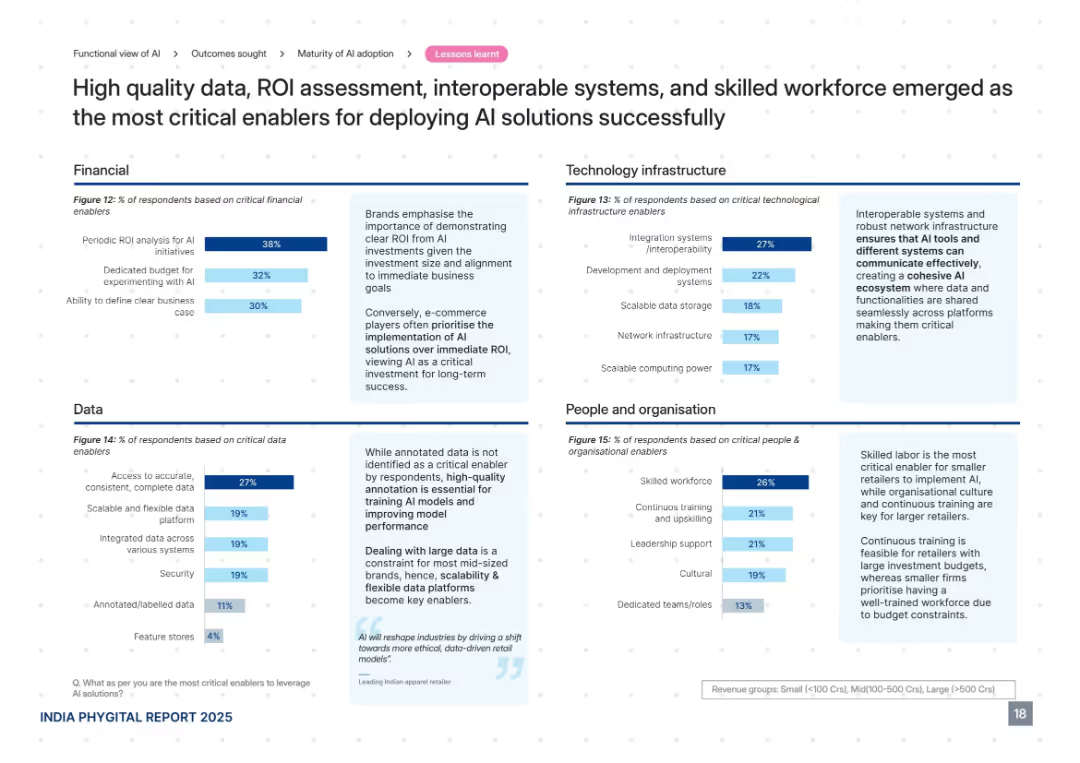
Four quadrant layout divided by themes: Financial, Data, Technology Infrastructure, and People. Each quadrant includes a bar chart with accompanying textual insights. Dark blue accent color.
Technology and Digital Transformation
Retail & E-commerce
The slide identifies key enablers for successful AI deployment, such as ROI evaluation, data accuracy, interoperable systems, and skilled workforce. It highlights that e-commerce players prioritize AI investment more than ROI and stresses the importance of annotated data and skilled teams for long-term AI integration success.
AI enablers, data quality, ROI, interoperability, workforce, budget, infrastructure
false
Technology and Digital Transformation
Retail & E-commerce
Mixed Chart
PwC/Strategy&
Add to my slides
Remove from favorites
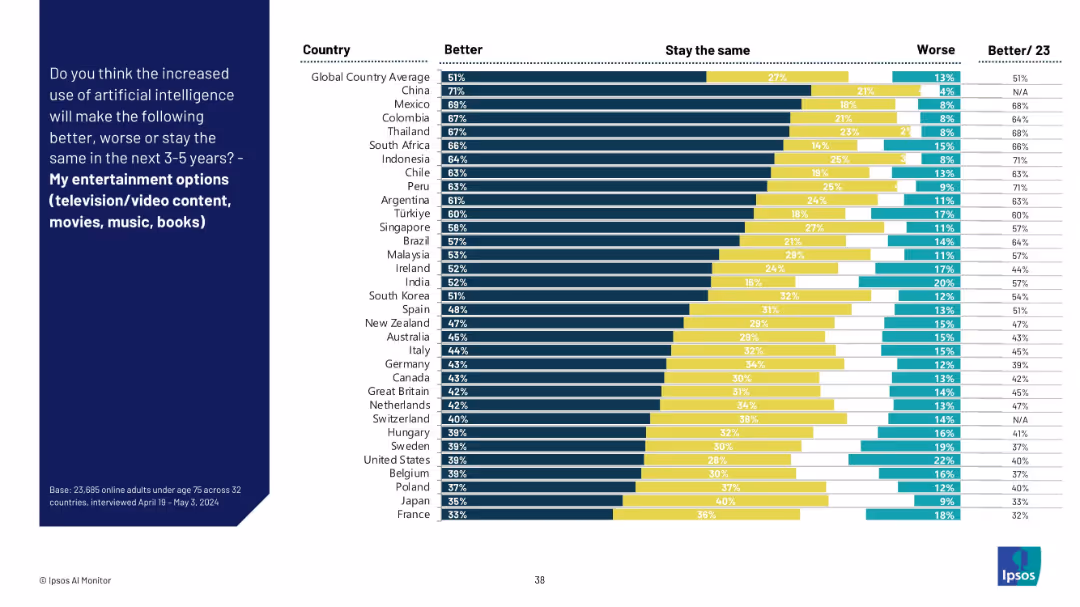
Similar format to previous slide with a left-aligned question panel and right-side bar chart comparing countries.
Market Analysis and Trends
Media & Entertainment
This slide shows how people across different countries believe AI will influence their entertainment options such as TV, music, movies, and books. The data shows generally high optimism, especially in China and Latin America.
AI entertainment, public perception, global survey, future trends, digital media, Ipsos, country opinions, optimism, movies, music
false
Market Analysis and Trends
Media & Entertainment
Mixed Chart
IPSOS
Add to my slides
Remove from favorites
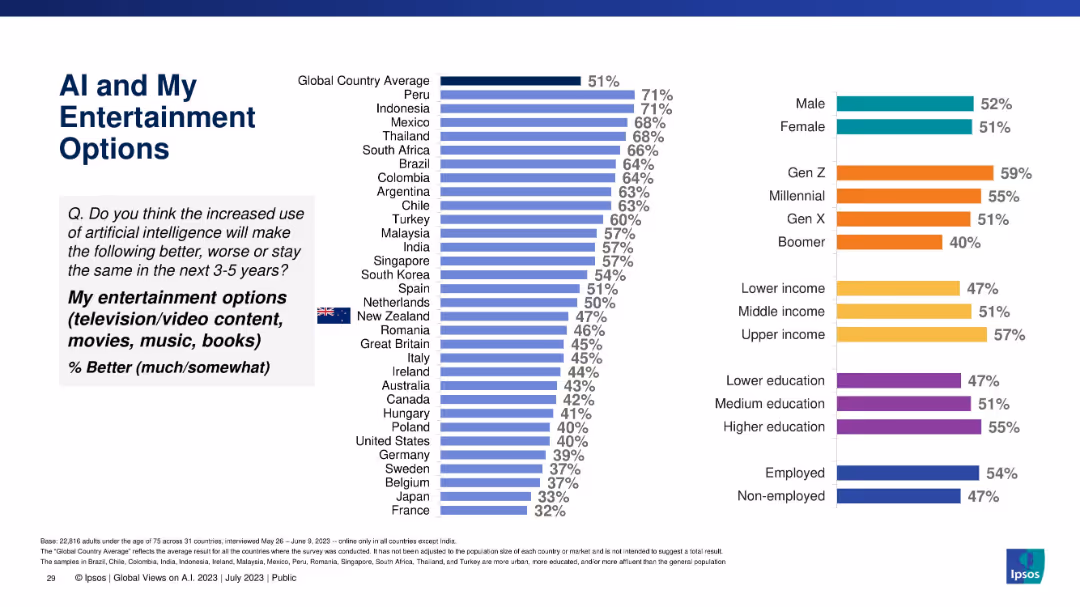
Vertical bar chart ranking countries and demographics by expected AI improvement in entertainment options, such as video and books.
Market Analysis and Trends
Artificial Intelligence
The slide illustrates public opinion on AI's positive influence on entertainment. Peru and Indonesia lead optimism, while Gen Z is most hopeful among demographic groups.
AI, entertainment, TV, movies, music, optimism, perception, demographic comparison, Ipsos
false
Market Analysis and Trends
Artificial Intelligence
Multiple Chart
IPSOS
Add to my slides
Remove from favorites
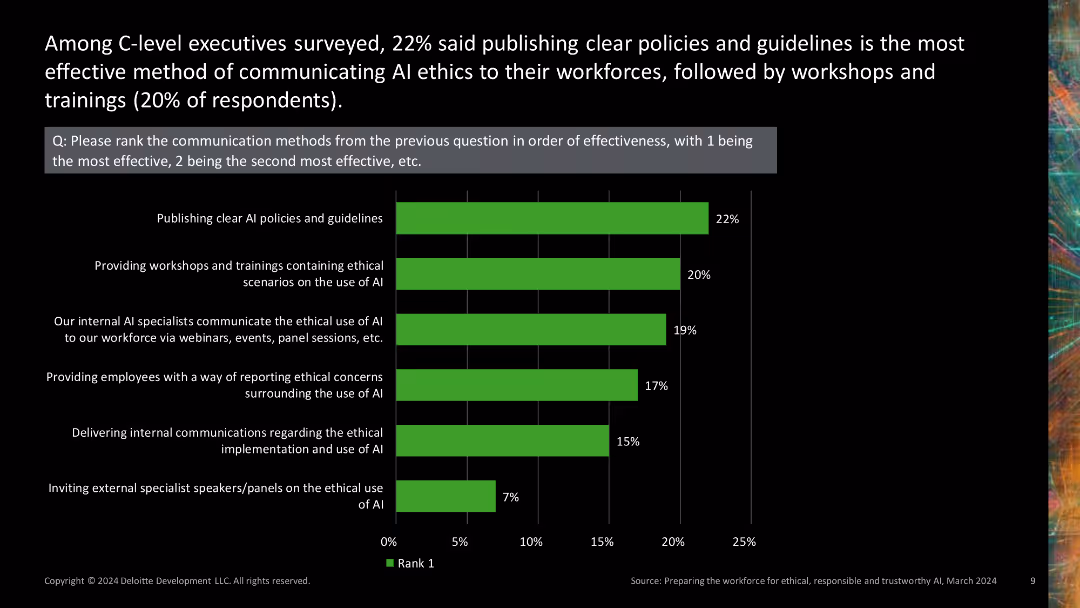
Column chart ranking the effectiveness of different AI ethics communication methods.
Regulatory and Compliance
Technology & Software
Ranks various methods of communicating AI ethics to the workforce, highlighting which methods are perceived as most effective by C-level executives.
AI ethics, communication effectiveness, ranking, workshops, guidelines
false
Regulatory and Compliance
Technology & Software
Single Chart
Deloitte
Add to my slides
Remove from favorites
Stacked bar chart showing methods of communicating AI ethics to workforce.
Regulatory and Compliance
Technology & Software
Discusses how companies communicate AI ethics to their employees, including workshops, internal specialists, and ethical reporting methods.
AI ethics, communication, workshops, internal specialists, ethical reporting
false
Regulatory and Compliance
Technology & Software
Mixed Chart
Deloitte
Add to my slides
Remove from favorites
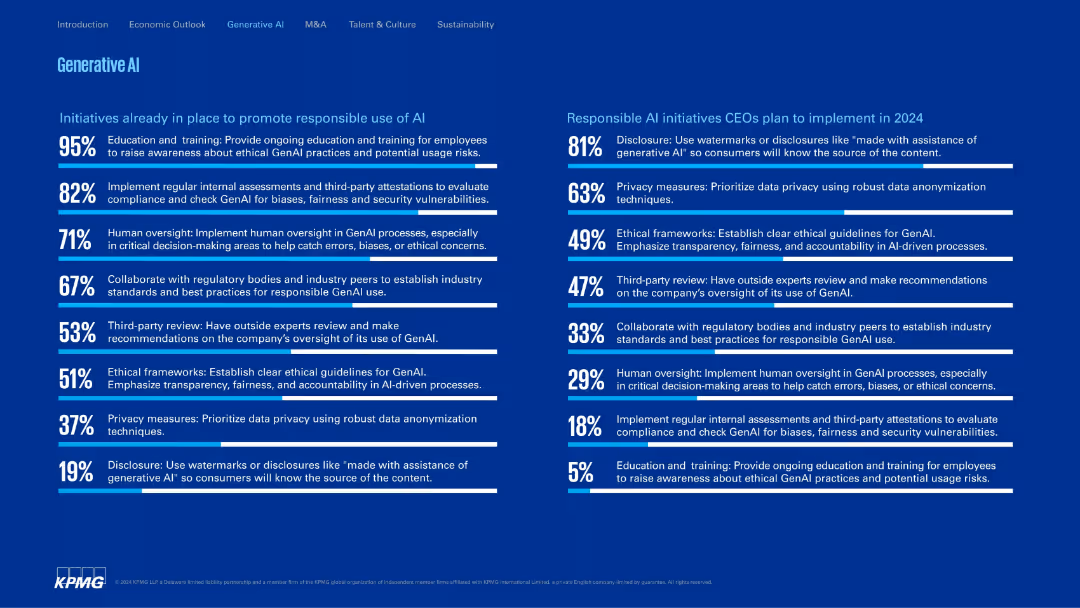
Dual-column layout with bar-style bullet points; symmetrical and text-rich; white and blue typography.
Regulatory and Compliance
Artificial Intelligence
Lists current and planned initiatives for responsible AI use. These include employee education, third-party reviews, ethical frameworks, and disclosures. Distinguishes between what’s already in place and what CEOs aim to implement in 2024.
AI ethics, compliance, oversight, privacy, transparency, training
false
Regulatory and Compliance
Artificial Intelligence
Single Chart
KPMG
Add to my slides
Remove from favorites
This slide features a horizontal bar chart indicating the percentage of respondents hiring for various ethical positions in AI and technology. The chart is predominantly green and black, with bars labeled for clarity.
Human Resources and Talent Management
Technology & Software
The slide highlights the percentage of organizations hiring or planning to hire for various ethical positions in AI and technology, such as AI ethics researchers, compliance specialists, and policy analysts.
AI ethics, compliance, policy, hiring, chart
false
Human Resources and Talent Management
Technology & Software
Mixed Chart
Deloitte
Add to my slides
Remove from favorites
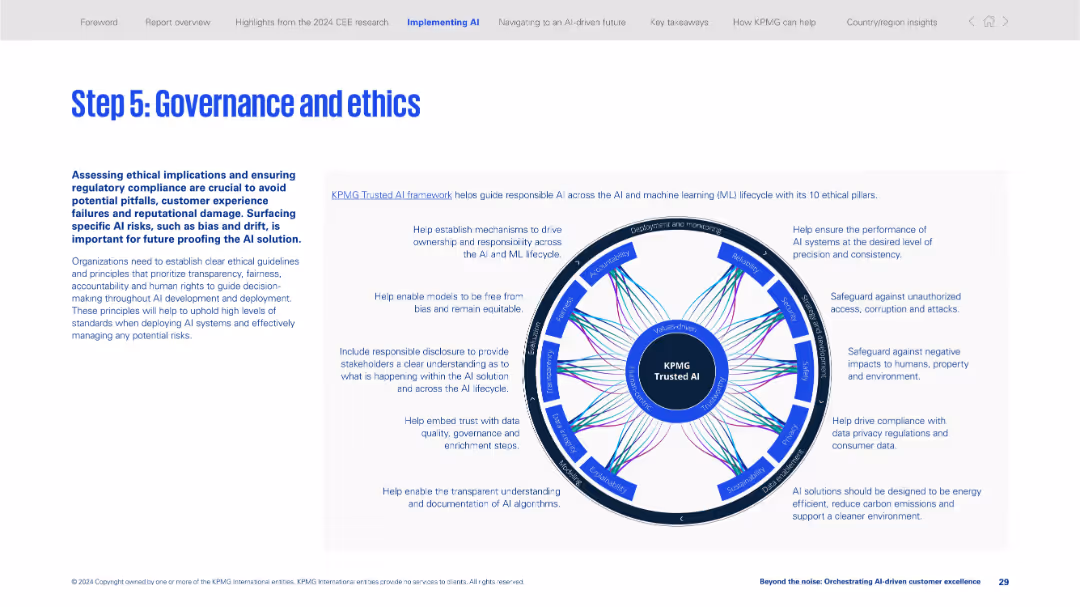
Two-section layout with explanatory text on left and a circular infographic on the right visualizing KPMG Trusted AI ethical pillars.
Regulatory and Compliance
Artificial Intelligence
Emphasizes the importance of ethics and governance in AI deployment. Introduces the KPMG Trusted AI framework and its 10 ethical pillars to ensure responsible, transparent, and compliant AI implementation.
AI ethics, governance, compliance, trusted AI, responsible AI, fairness, transparency, data security, bias, regulations
false
Regulatory and Compliance
Artificial Intelligence
Framework
KPMG
Add to my slides
Remove from favorites
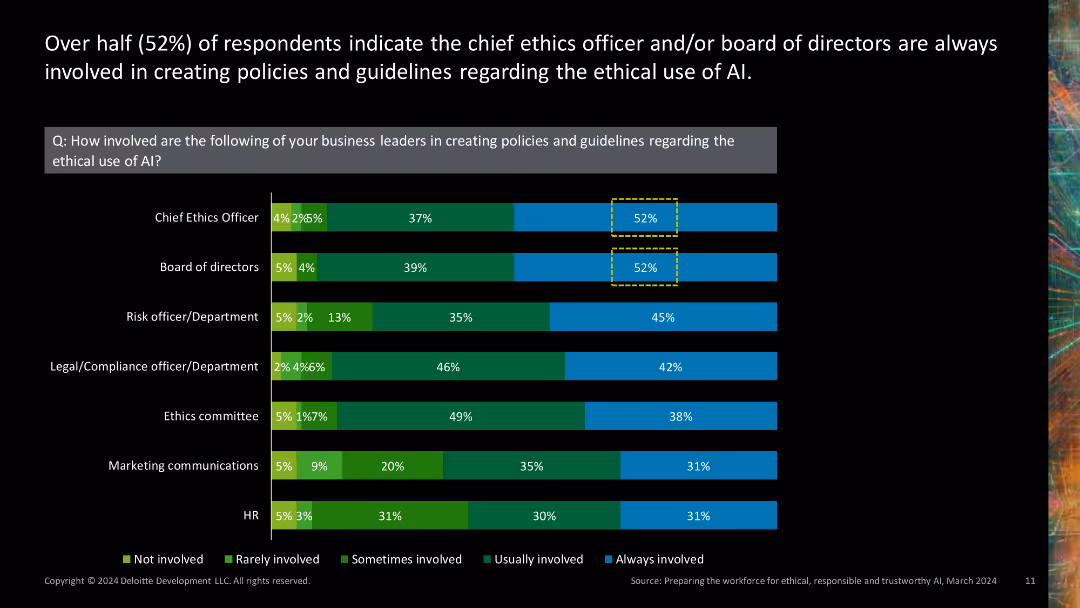
Stacked bar chart showing involvement of various business leaders in creating AI ethics policies.
Regulatory and Compliance
Technology & Software
Highlights the involvement of different business leaders, such as chief ethics officers and boards of directors, in developing AI ethics policies.
AI ethics policies, business leaders, chief ethics officer, board of directors, policy development
false
Regulatory and Compliance
Technology & Software
Single Chart
Deloitte
Add to my slides
Remove from favorites
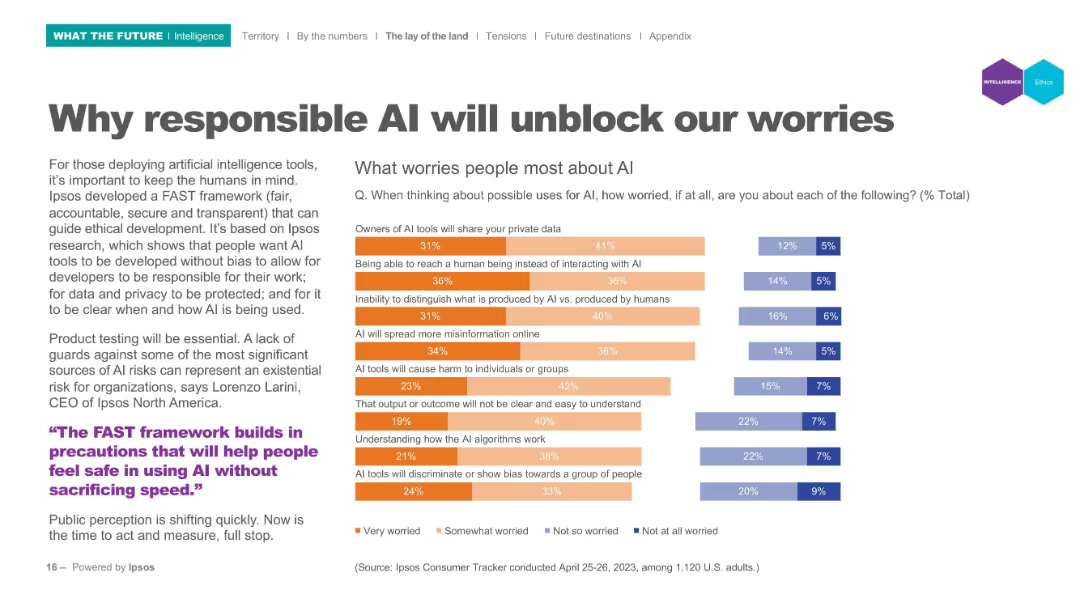
Left panel text; right panel horizontal bar chart indicating worry levels; categories use color-coded segments.
Risk Assessment and Management
Artificial Intelligence
Lists top public concerns regarding AI (e.g., privacy, bias, misinformation). Visual data shows levels of worry using segmented bar charts to represent varying degrees of concern from "Very worried" to "Not worried". Tied to Ipsos' FAST (fair, accountable, secure, transparent) framework.
AI ethics, public concerns, privacy, misinformation, bias, accountability, FAST framework
false
Risk Assessment and Management
Artificial Intelligence
Mixed Chart
IPSOS
Add to my slides
Remove from favorites
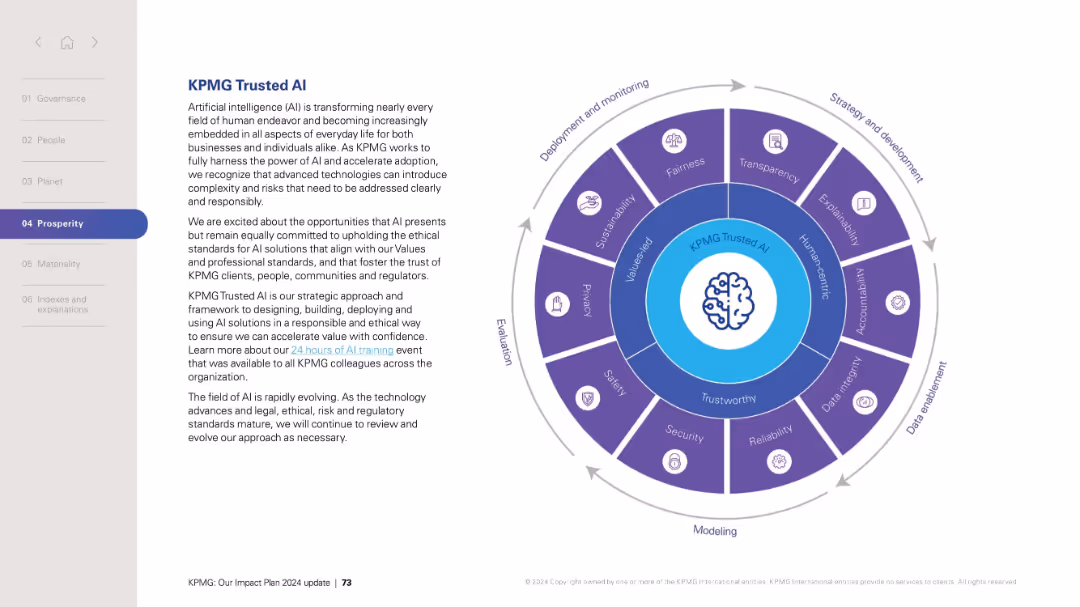
Left-aligned text with circular infographic on the right displaying AI ethics dimensions and stages of AI lifecycle.
Technology and Digital Transformation
Artificial Intelligence
Describes KPMG’s strategic approach to developing and deploying trustworthy AI systems. Emphasizes ethical AI, fairness, transparency, safety, and sustainability. The circular diagram segments AI development into phases and principles. This slide outlines a framework for responsible AI implementation aligned with corporate values and governance.
AI, ethics, responsible AI, trust, governance, deployment, fairness, transparency, safety, KPMG
false
Technology and Digital Transformation
Artificial Intelligence
Vertical Flow
KPMG
Add to my slides
Remove from favorites
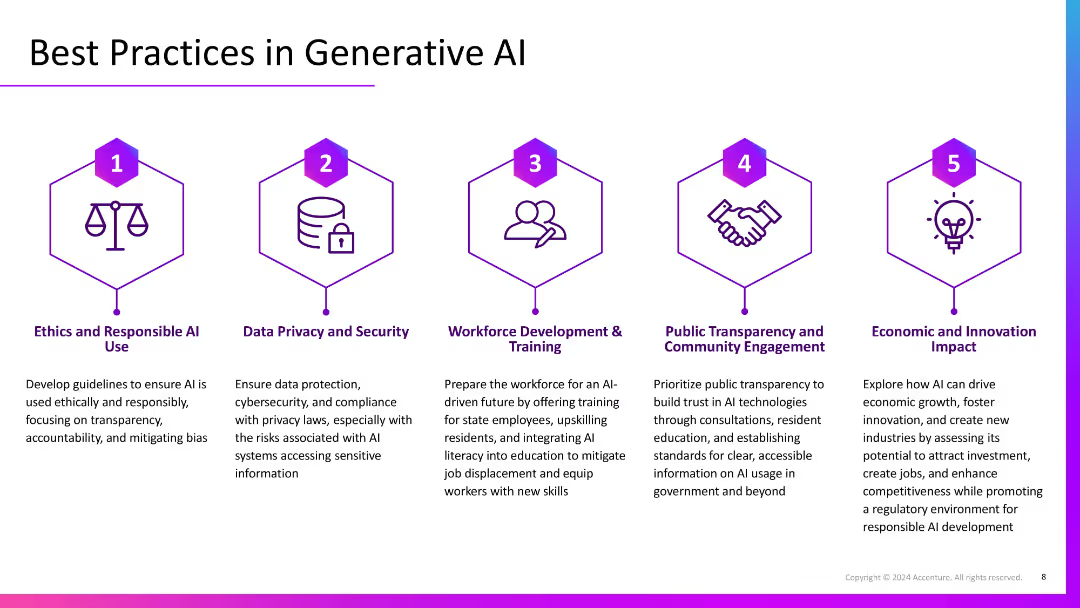
Five-column layout with numbered icons and headers, each describing a best practice. Uses visual symmetry and hexagonal icons with consistent purple theme.
Regulatory and Compliance
Artificial Intelligence
Lists five best practices for generative AI: ethical use, privacy/security, workforce training, public transparency, and fostering economic impact. Each section outlines strategic and regulatory considerations.
AI ethics, security, workforce training, transparency, innovation, best practices
false
Regulatory and Compliance
Artificial Intelligence
Pillar
Accenture
Add to my slides
Remove from favorites
Features several graphs and icons depicting ethical concerns in AI, with global data presented to show variations in public perception.
Technology and Digital Transformation
Technology & Software
Addresses the ethical challenges AI faces, such as decision-making transparency and bias. It provides statistical insights into public perceptions and concerns across different countries.
AI ethics, transparency, public perception, bias, global insights
false
Technology and Digital Transformation
Technology & Software
Multiple Chart
BCG
Add to my slides
Remove from favorites
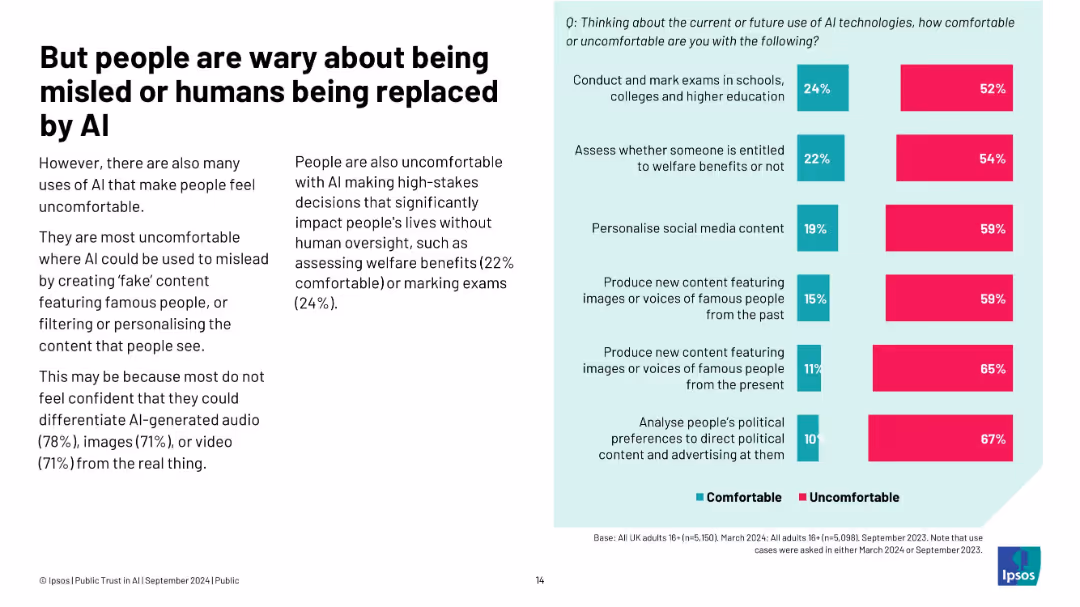
Left: concerns about fake content and high-stakes use; right: chart on comfort with certain use cases
Risk Assessment and Management
Artificial Intelligence
This slide highlights that people feel most uncomfortable with AI-generated fake content (images, voices) and high-stakes decisions like welfare assessment. The discomfort stems from lack of trust in AI's ability to act responsibly without human oversight.
AI ethics, trust, fake content, Ipsos, discomfort, replacement, manipulation, oversight
false
Risk Assessment and Management
Artificial Intelligence
Mixed Chart
IPSOS
Add to my slides
Remove from favorites
The slide presents a dark background with text and icons. Four numbered points highlight key debate topics with accompanying icons representing trustworthiness, explainability, application prioritization, and other risks related to AI.
Risk Assessment and Management
Technology & Software
This slide discusses crucial debate topics surrounding AI trends, such as the importance of trustworthiness, the necessity of explainability, the benefits of application prioritization, and the spectrum of other relevant risks, including cybersecurity, regulatory compliance, privacy, and fairness issues.
AI Ethics, Trustworthiness, Explainability, Risk Assessment
false
Risk Assessment and Management
Technology & Software
Header Vertical
McKinsey
Add to my slides
Remove from favorites
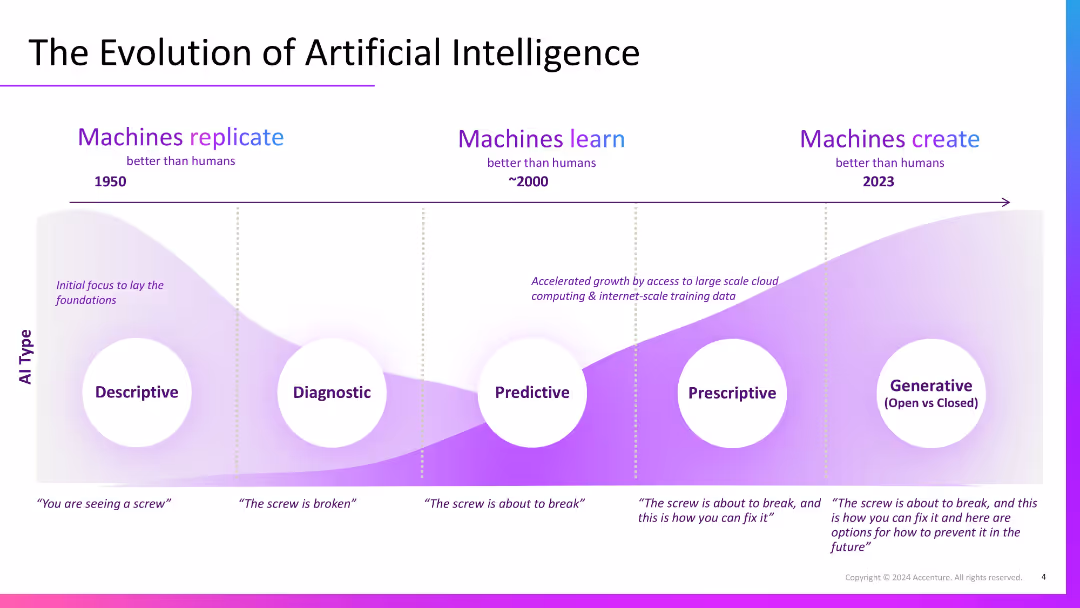
Stylized timeline graph with a curved gradient background showing AI progression from Descriptive to Generative across decades. Includes annotations under each AI type.
Industry Overview
Artificial Intelligence
Outlines AI evolution from descriptive to generative stages. Shows how AI capabilities have grown over time, with modern AI capable of generating solutions and foresight, building on foundational descriptive and diagnostic insights.
AI evolution, generative AI, descriptive, predictive, timeline, machine learning
false
Industry Overview
Artificial Intelligence
Single Chart
Accenture
Add to my slides
Remove from favorites
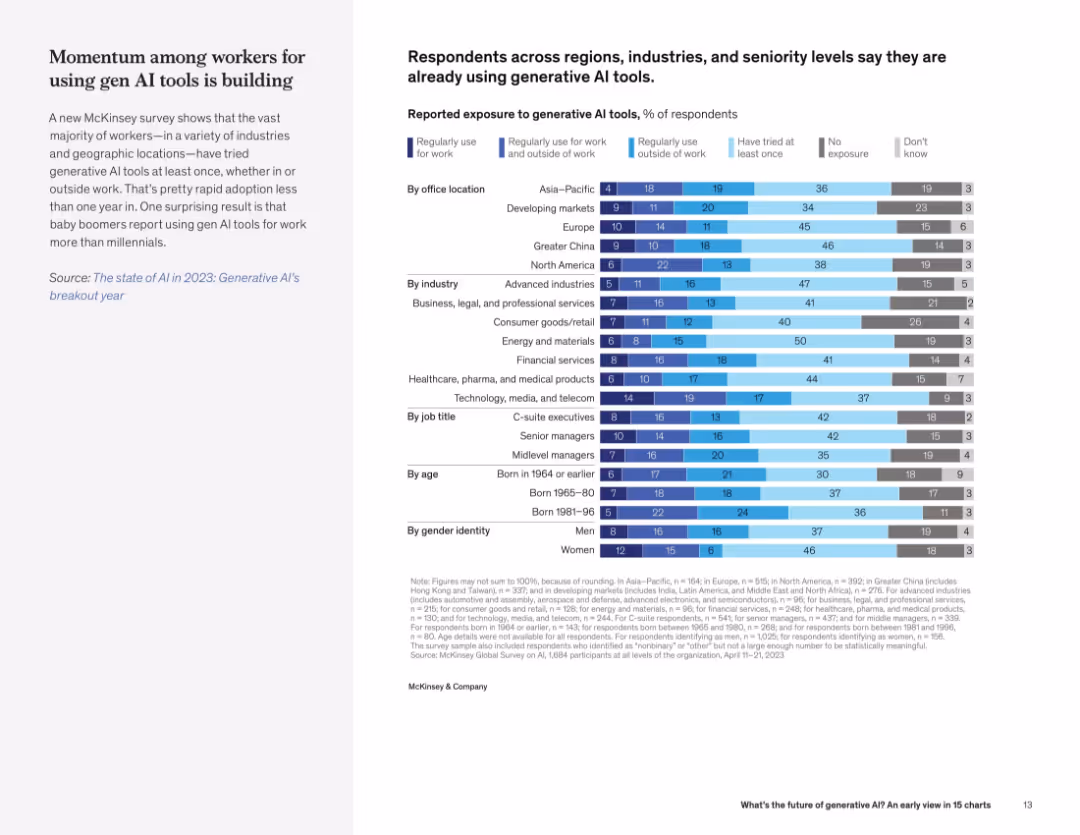
Text on left, with a detailed segmented bar chart on right showing AI exposure levels by region, industry, role, age, and gender.
Market Analysis and Trends
Artificial Intelligence
The slide details generative AI adoption across demographics and geographies, indicating widespread early use and notable surprises (e.g., boomers using it more than millennials).
AI exposure, workforce adoption, demographics, region, industry, generational use, workplace tools
false
Market Analysis and Trends
Artificial Intelligence
Mixed Chart
McKinsey
Add to my slides
Remove from favorites
Comparative column charts show differing levels of optimism and concern about AI based on user frequency, accompanied by concise textual analysis.
Technology and Digital Transformation
Technology & Software
Analyzes how familiarity with AI influences perceptions, important for understanding market readiness and potential resistance or advocacy for AI initiatives.
AI familiarity, market readiness, user perception, technology advocacy, optimism
false
Technology and Digital Transformation
Technology & Software
Multiple Chart
BCG
Add to my slides
Remove from favorites
Consists of dense texts and pie charts in blue and green, summarizing AI's impact on various financial processes.
Operational Efficiency
Financial Services
Reviews the application of AI in financial services, emphasizing its role in improving customer experience and optimizing operational and financial processes, particularly highlighting trends in automation and data privacy.
AI, financial services, customer experience, operations, optimization
false
Operational Efficiency
Financial Services
Multiple Chart
Deloitte
Add to my slides
Remove from favorites
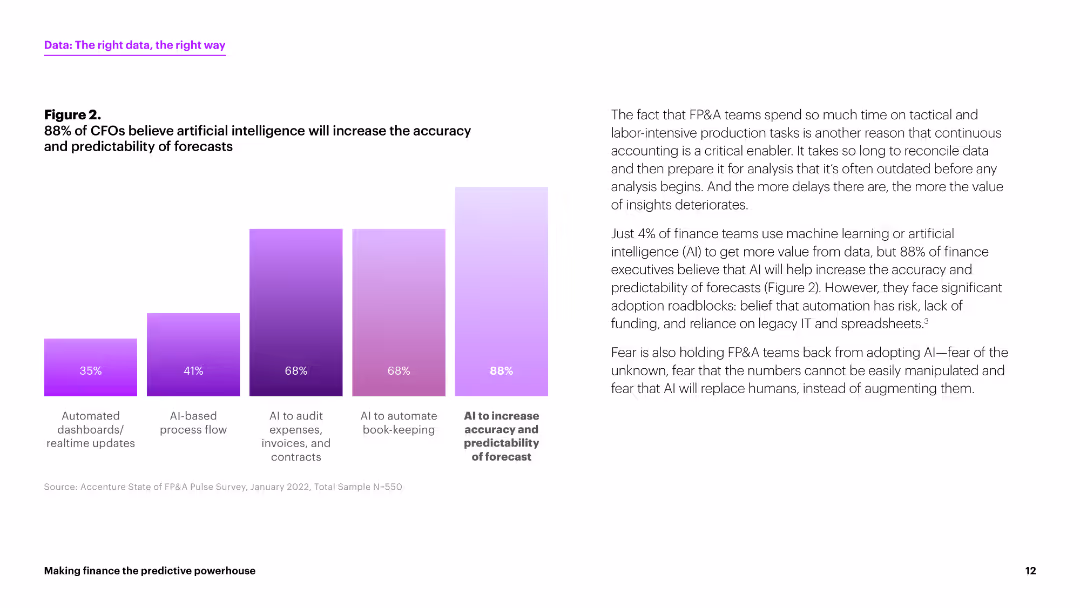
This slide features a column chart displaying the percentages of CFOs who believe AI will increase the accuracy and predictability of forecasts. The chart is presented in various shades of purple. The layout includes a paragraph of text explaining the implications of the chart.
Strategic Planning
Financial Services
The slide indicates that 88% of CFOs believe AI will improve forecast accuracy and predictability. It highlights the adoption roadblocks for AI in finance, such as risk and reliance on legacy systems.
AI, forecasts, CFOs, predictability, accuracy
false
Strategic Planning
Financial Services
Mixed Chart
Accenture
Add to my slides
Remove from favorites
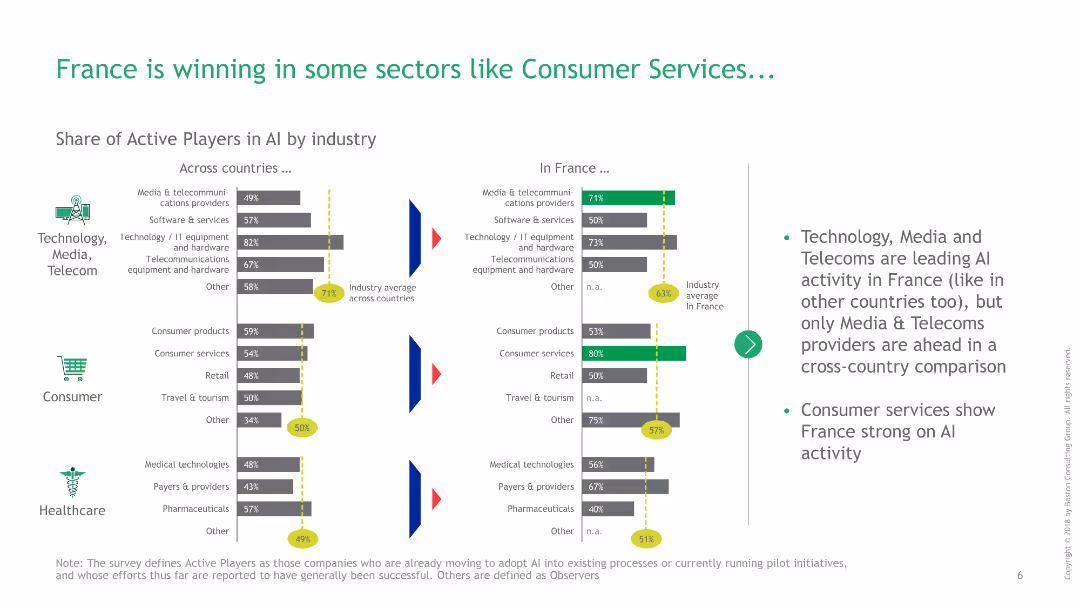
Bar charts comparing the share of active AI players across different industries between France and other countries, with detailed annotations.
Market Analysis and Trends
Technology & Software
This slide compares the share of active AI players in various sectors between France and other countries, highlighting France's strengths in AI.
AI, France, consumer services, technology, comparison, active players, sectors, bar charts, annotations, industry average
false
Market Analysis and Trends
Technology & Software
Multiple Chart
BCG
Add to my slides
Remove from favorites
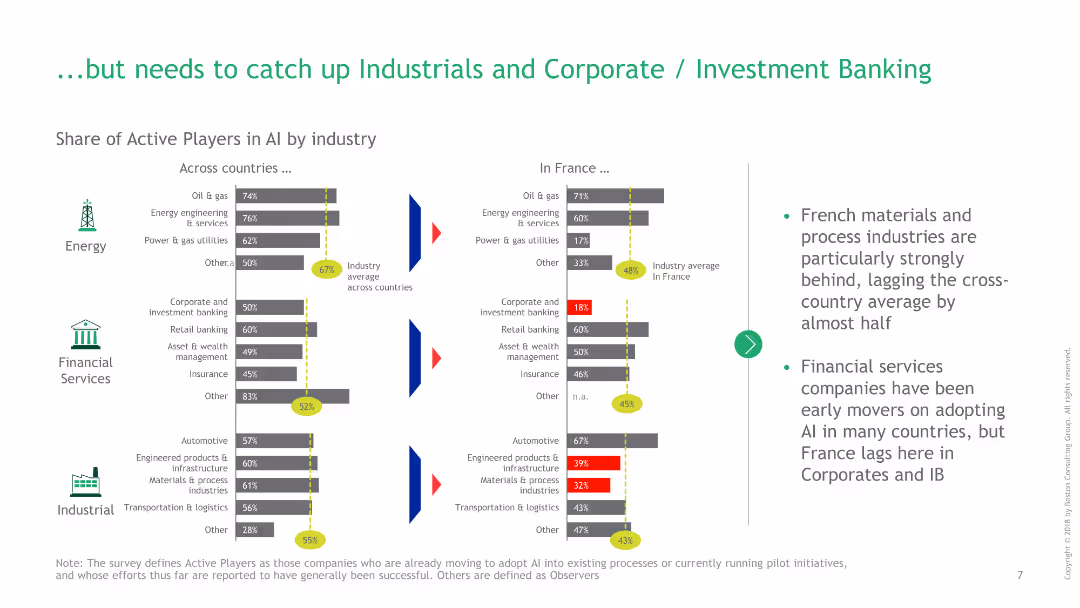
Bar charts showing the share of active AI players in energy, financial services, and industrial sectors between France and other countries.
Competitive Landscape
Financial Services
This slide highlights areas where France lags in AI adoption, particularly in industrial and corporate banking sectors, compared to other countries.
AI, France, financial services, industrial, investment banking, energy, comparison, active players, bar charts, industry average
false
Competitive Landscape
Financial Services
Multiple Chart
BCG
Add to my slides
Remove from favorites
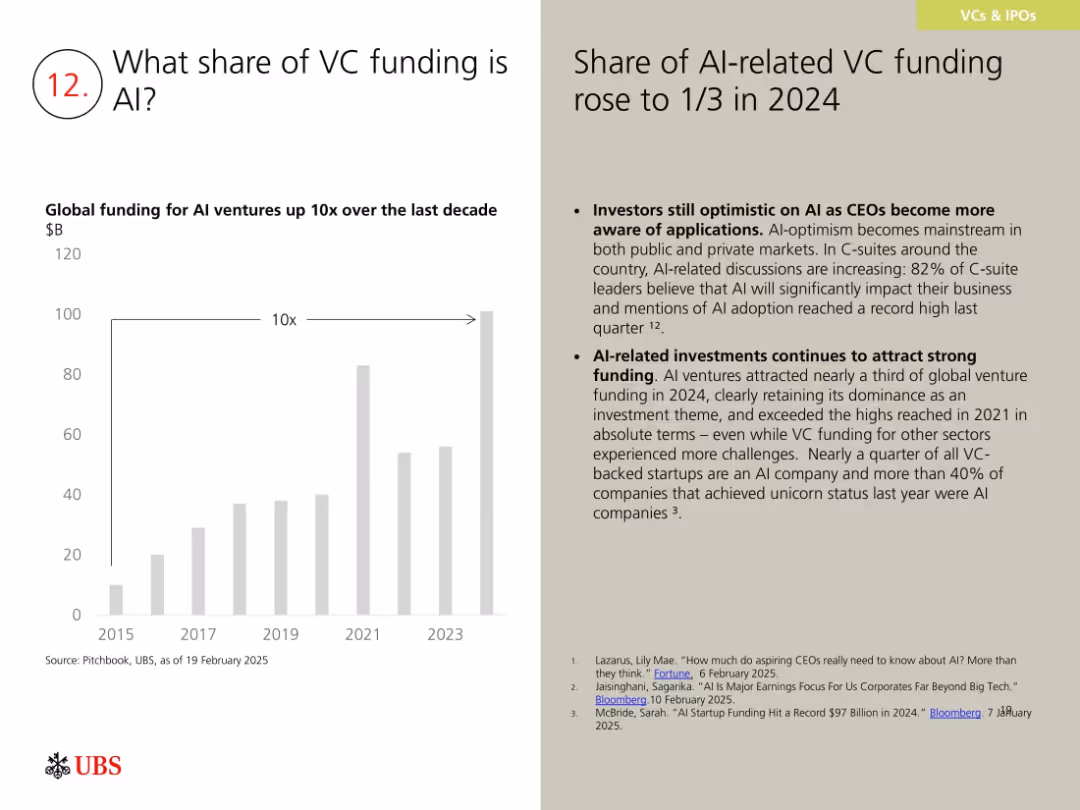
Bar chart showing 10x growth in AI VC funding since 2015; right side gives context and supporting data.
Investment Analysis
Artificial Intelligence
The slide shows that AI companies received one-third of global VC funding in 2024, with strong CEO support for AI adoption. AI dominates VC portfolios, particularly in unicorns and early-stage ventures, maintaining its position as a leading investment theme despite broader sectoral challenges.
AI funding, venture capital, startups, unicorns, tech investment
false
Investment Analysis
Artificial Intelligence
Mixed Chart
UBS
Add to my slides
Remove from favorites
Four-column layout describing possible future applications of AI by 2030, 2035, 2040, and 2050 in areas like healthcare, trust and governance, sustainable business, and service innovation.
Technology and Digital Transformation
Technology & Software
The slide explores the transformative potential of AI across various sectors, outlining future applications from 2030 to 2050. It discusses the impact of AI on healthcare, trust and governance, sustainable business practices, and service innovation, emphasizing how AI could fundamentally change these areas.
AI, Future Applications, Healthcare, Governance
false
Technology and Digital Transformation
Technology & Software
Linear Flow
Roland Berger
Add to my slides
Remove from favorites
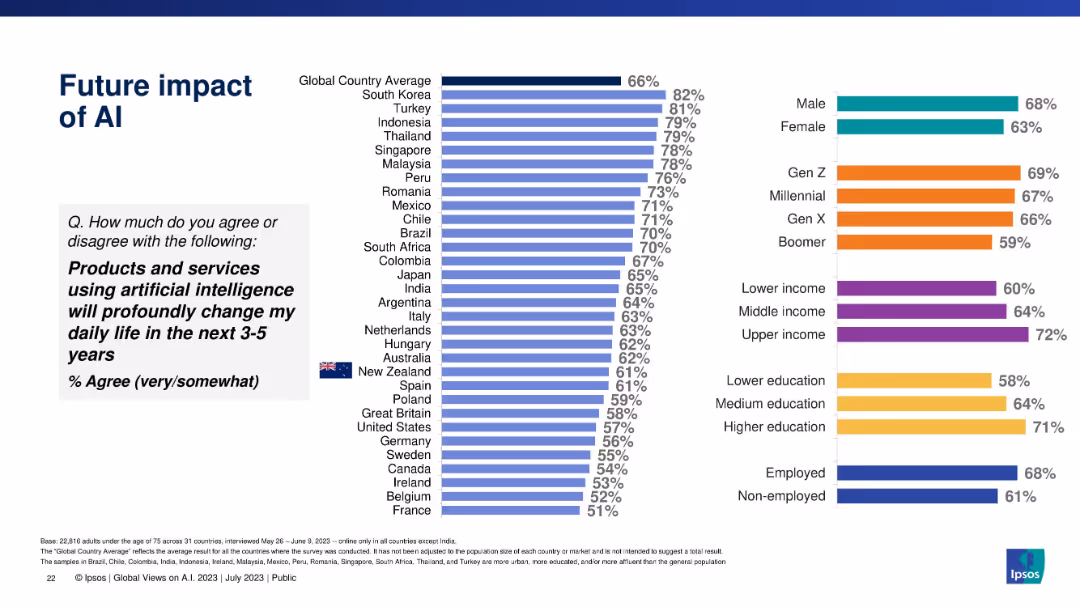
Similar bar chart format measuring expected AI impact in the next 3–5 years, globally and demographically.
Technology and Digital Transformation
Artificial Intelligence
Predicts anticipated future change in daily life due to AI technologies. High agreement levels in Asia-Pacific regions and younger, wealthier, and more educated groups.
AI future impact, digital forecasting, expectations, innovation, demographic trends, Ipsos, AI adoption
false
Technology and Digital Transformation
Artificial Intelligence
Multiple Chart
IPSOS
Add to my slides
Remove from favorites
Vertical bar chart with agreement and disagreement metrics by country. Countries listed on the left; bars on the right reflect opinion breakdown.
Market Analysis and Trends
Artificial Intelligence
This slide highlights expected future impact of AI, showing global anticipation that AI will significantly shape lives in the coming 3–5 years. Agreement is generally higher than in the retrospective view (Slide 19082), with strongest expectations from China, Indonesia, and South Korea.
AI future, impact prediction, global views, digital transformation, AI products, 3–5 year outlook, survey, anticipation, emerging markets
false
Market Analysis and Trends
Artificial Intelligence
Mixed Chart
IPSOS
Add to my slides
Remove from favorites
Presents a flow chart linking current job roles with future roles in an AI-driven scenario. Uses a gradient of purple to indicate shifts and capacity changes.
Organizational Structure and Change
Technology & Software
Demonstrates potential changes in job roles and work distribution with the integration of AI, aiming at operational optimization and enhanced efficiency.
AI future, job roles, workforce transformation, operational efficiency, role reallocation, capacity increase, technology integration, AI impact, work evolution
false
Organizational Structure and Change
Technology & Software
Diagram
Accenture
Add to my slides
Remove from favorites
Key statistics related to AI/Gen-AI impacts in the banking sector, including CAGR, adoption rates, and revenue generation. Simple layout with text and icons.
Technology and Digital Transformation
Financial Services
Summarizes key figures on AI and Gen-AI in banking, highlighting adoption rates, revenue impact, and productivity improvements.
AI, Gen-AI, banking, adoption, revenue
false
Technology and Digital Transformation
Financial Services
Header Horizontal
Kearney
Add to my slides
Remove from favorites
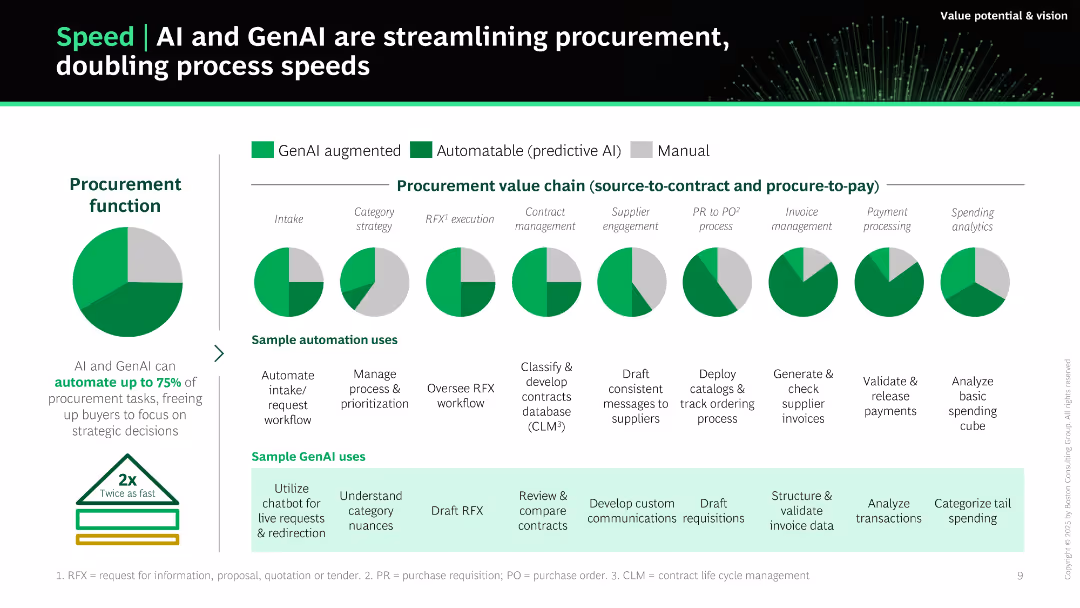
Bar chart-style layout with pie charts under each procurement function. Color-coded segments show GenAI, predictive AI, and manual tasks. Green tones dominate.
Operational Efficiency
Technology & Software
Shows how AI and GenAI accelerate procurement by automating 75% of tasks. Highlights AI applications across the procurement value chain (e.g., intake, contract management, payments). Each step is broken down with sample automation and GenAI use cases.
AI, GenAI, procurement, automation, efficiency, speed, process, sourcing
false
Operational Efficiency
Technology & Software
Mixed Chart
BCG
Add to my slides
Remove from favorites
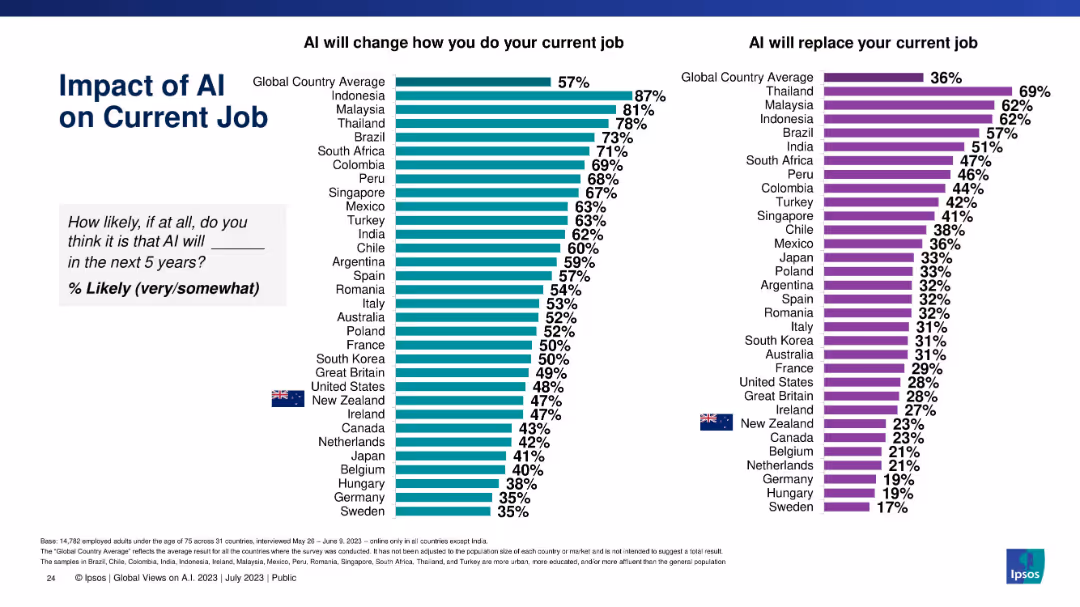
Horizontal bar charts comparing 30+ countries' likelihood perception on AI changing or replacing jobs, with country flags and percentage values.
Market Analysis and Trends
Artificial Intelligence
This slide presents global comparisons of opinions on whether AI will change or replace jobs in the next five years. It ranks countries based on perceived likelihood, highlighting global disparities.
AI, global comparison, job change, job replacement, perception, countries, survey data, Ipsos, horizontal bars
false
Market Analysis and Trends
Artificial Intelligence
Multiple Chart
IPSOS
Add to my slides
Remove from favorites
Dual-column layout with bar charts showing agreement levels by country and demographic segments.
Market Analysis and Trends
Artificial Intelligence
This slide presents survey data on global and demographic attitudes toward AI products and services, focusing on whether people think AI brings more benefits than drawbacks.
AI, global opinion, benefits, demographics, Ipsos, perception, countries, gender, generation, income
false
Market Analysis and Trends
Artificial Intelligence
Multiple Chart
IPSOS
Add to my slides
Remove from favorites
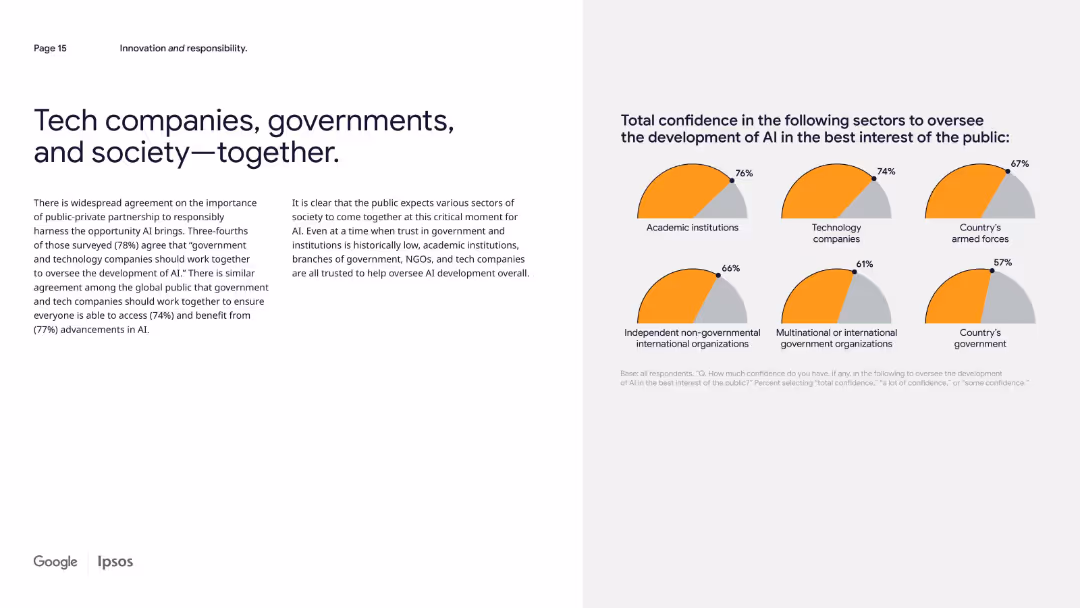
Two-column layout; left side contains text paragraphs, right side shows a pie chart grid with sector confidence levels.
Regulatory and Compliance
Artificial Intelligence
This slide emphasizes the importance of collaboration between governments, tech companies, and the public in the development of AI. It shows that trust is highest in academic institutions and tech companies, despite generally low institutional trust globally.
AI governance, public-private, confidence, oversight, technology, trust, partnership, regulation, sectors, Ipsos
false
Regulatory and Compliance
Artificial Intelligence
Mixed Chart
IPSOS
Add to my slides
Remove from favorites
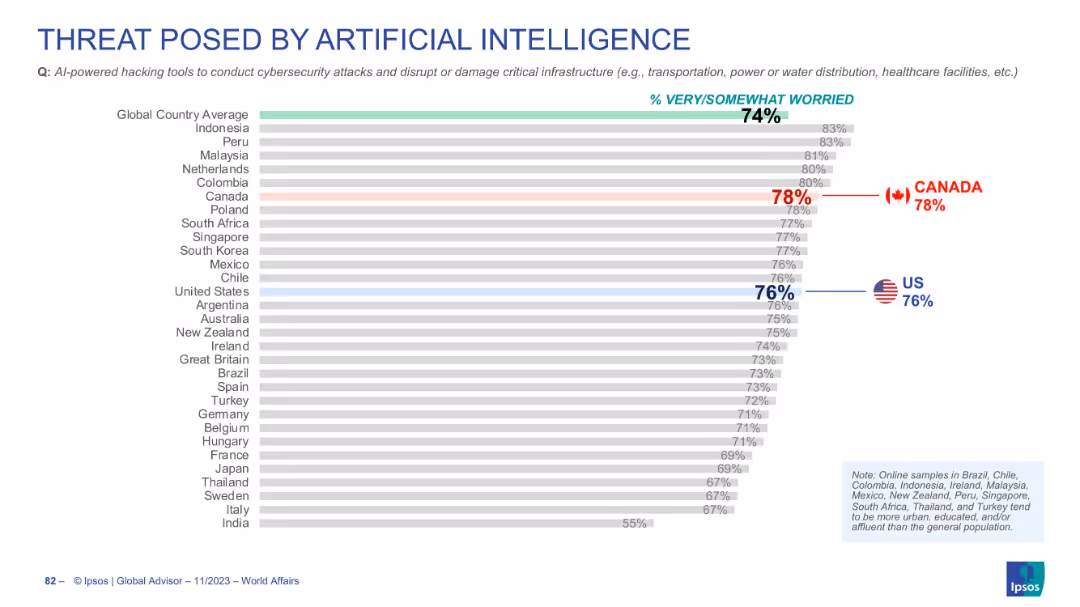
Horizontal bar chart ranking countries' concerns over AI-powered hacking tools
Risk Assessment and Management
Artificial Intelligence
Survey data highlighting global concern (74%) about AI-driven cybersecurity threats. Canada and the US show above-average levels of concern at 78% and 76% respectively.
AI hacking, cybersecurity, critical infrastructure, global survey, public worry
false
Risk Assessment and Management
Artificial Intelligence
Single Chart
IPSOS
Add to my slides
Remove from favorites
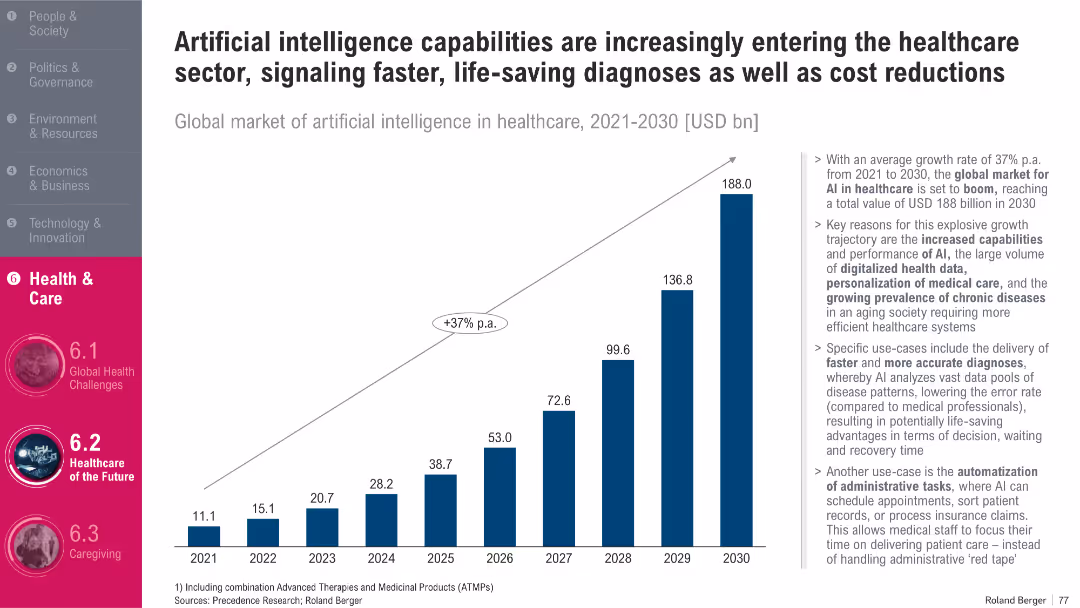
Vertical bar graph with year-by-year projections; upward growth trend; side bullet list on impact and use-cases
Technology and Digital Transformation
Artificial Intelligence
The slide presents forecasts for the AI healthcare market, expected to grow at 37% annually until 2030. It outlines how AI enhances diagnosis speed, reduces administrative workload, and supports chronic disease management. Emphasis is placed on the expanding role of AI in transforming healthcare delivery.
AI, Healthcare, Forecast, Digital Health, Diagnosis, Automation
false
Technology and Digital Transformation
Artificial Intelligence
Mixed Chart
Roland Berger
Add to my slides
Remove from favorites
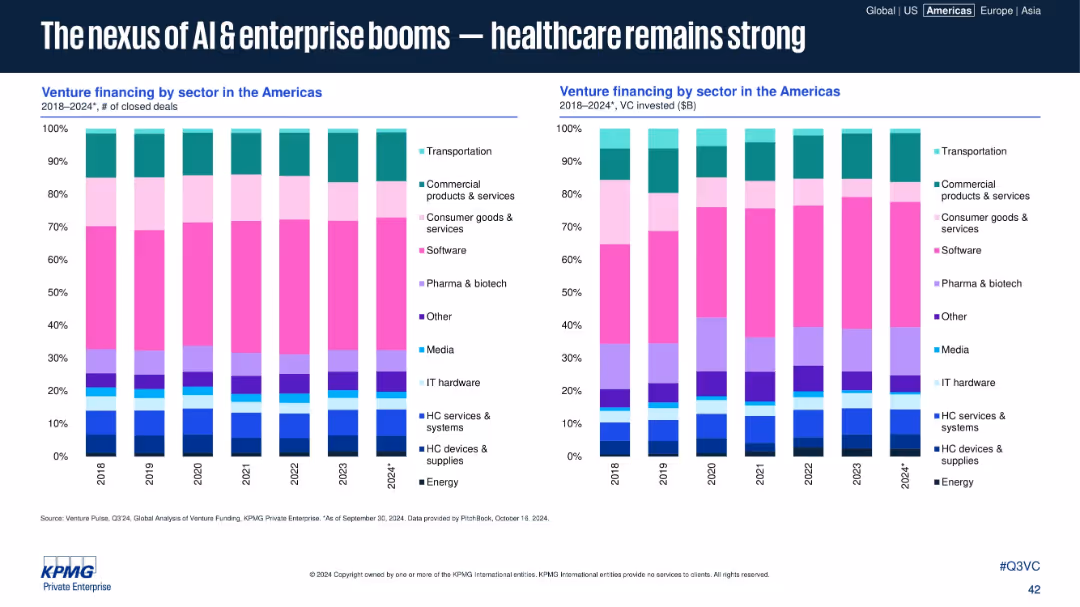
Side-by-side stacked bar charts showing venture financing by sector (deal count and value).
Industry Overview
Artificial Intelligence
Sector analysis from 2018–2024 shows growing investment in AI, enterprise software, and healthcare (especially pharma & biotech). Despite fluctuations, these sectors consistently attract high funding and deal activity across the Americas.
AI, healthcare, pharma, biotech, enterprise, VC sectors, funding trends, Americas, software, sector analysis
false
Industry Overview
Artificial Intelligence
Multiple Chart
KPMG
Add to my slides
Remove from favorites
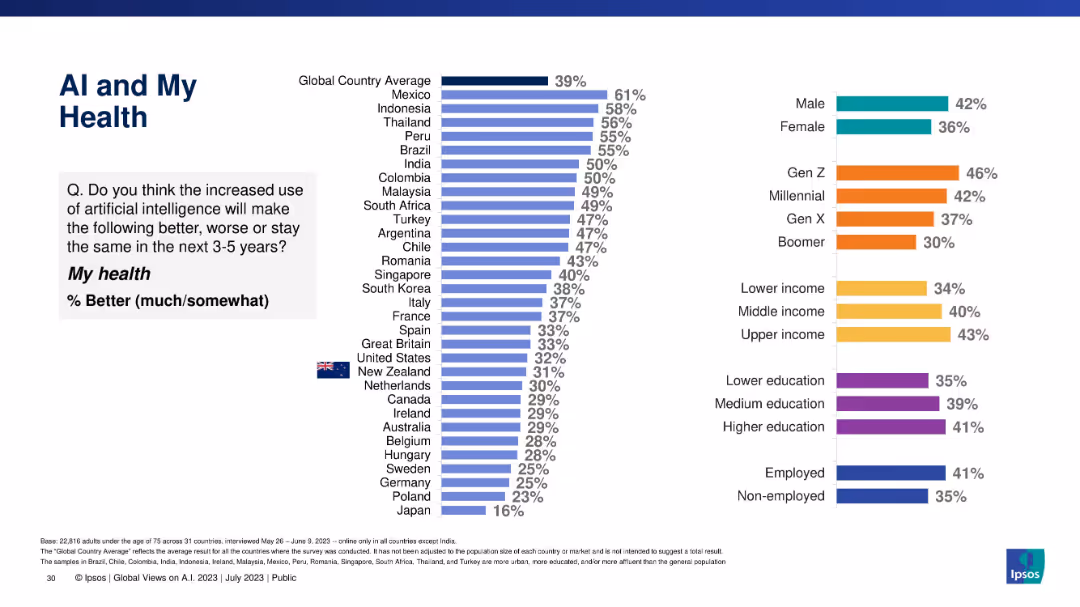
Country and demographic comparison bar chart showing perceived improvements AI could bring to personal health within 3–5 years.
Technology and Digital Transformation
Artificial Intelligence
This slide highlights perceptions of AI’s role in improving personal health. While optimism is low in many developed countries, younger generations and higher earners are more hopeful.
AI, healthcare, public perception, demographic trends, global ranking, Ipsos, survey, Gen Z, optimism
false
Technology and Digital Transformation
Artificial Intelligence
Multiple Chart
IPSOS
Add to my slides
Remove from favorites
Four column charts presenting results from a global survey about the use of AI in 2019, with selected views of entrepreneurs and scientists on AI.
Technology and Digital Transformation
Technology & Software
The slide discusses the mixed reactions to the growing power of AI, presenting survey results that show both enthusiasm and concern about its use. It emphasizes the importance of maintaining human values in AI development and includes perspectives from prominent figures in the technology industry.
AI, Human Values, Survey, Perspectives
false
Technology and Digital Transformation
Technology & Software
Mixed Chart
Roland Berger
Add to my slides
Remove from favorites
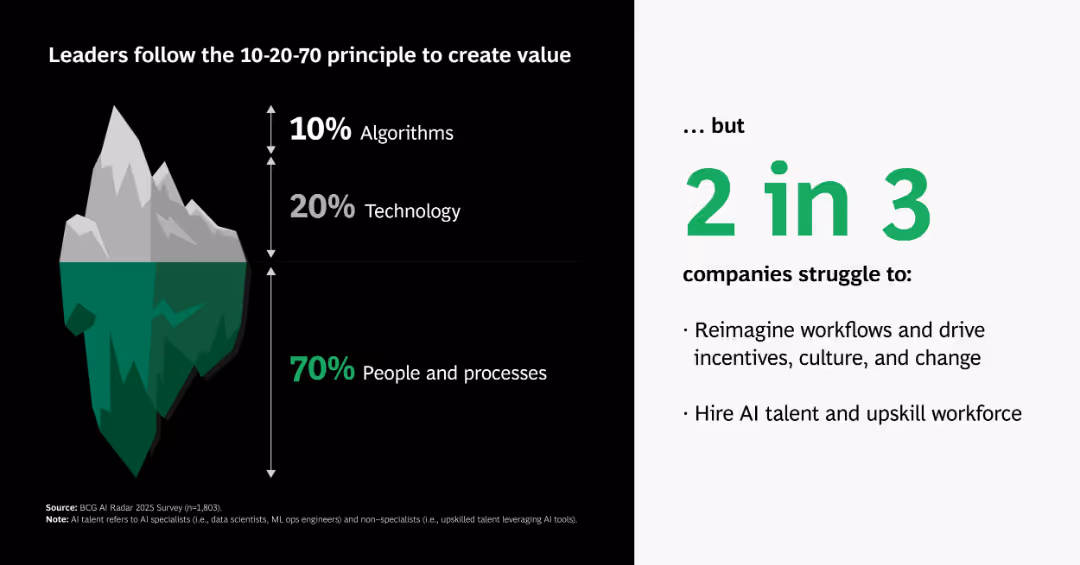
Iceberg visual metaphor breaking down AI value sources into algorithms, tech, and people/processes; supporting text on right.
Organizational Structure and Change
Artificial Intelligence
Explains that true AI value comes 70% from people and processes, 20% from technology, and only 10% from algorithms—contrasting perception with operational reality.
AI iceberg, 10-20-70, people, processes, tech, algorithms, value creation, organizational change
false
Organizational Structure and Change
Artificial Intelligence
Boxed
BCG
Add to my slides
Remove from favorites
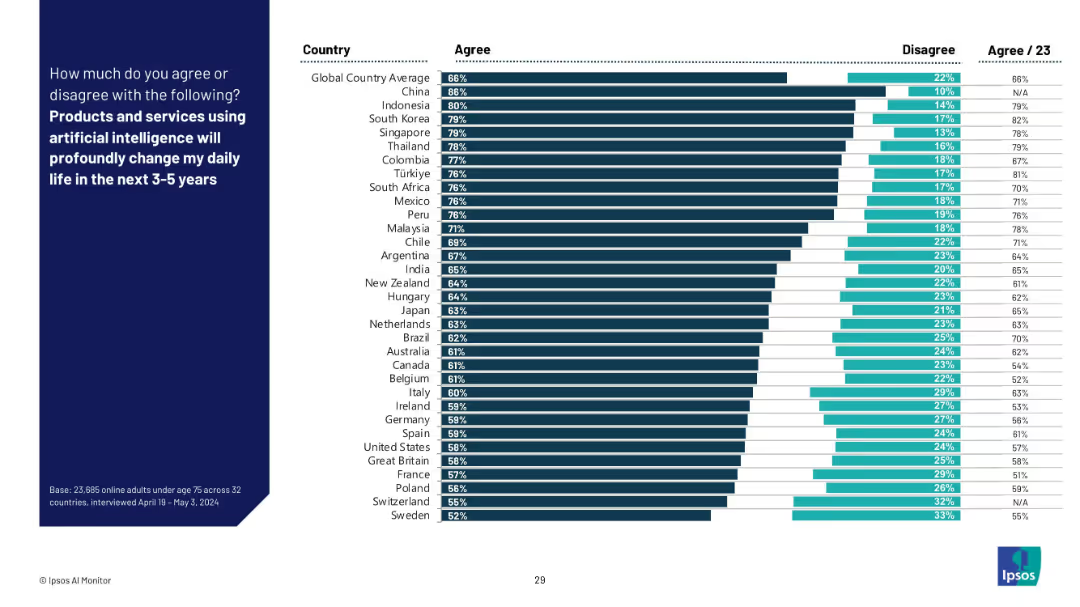
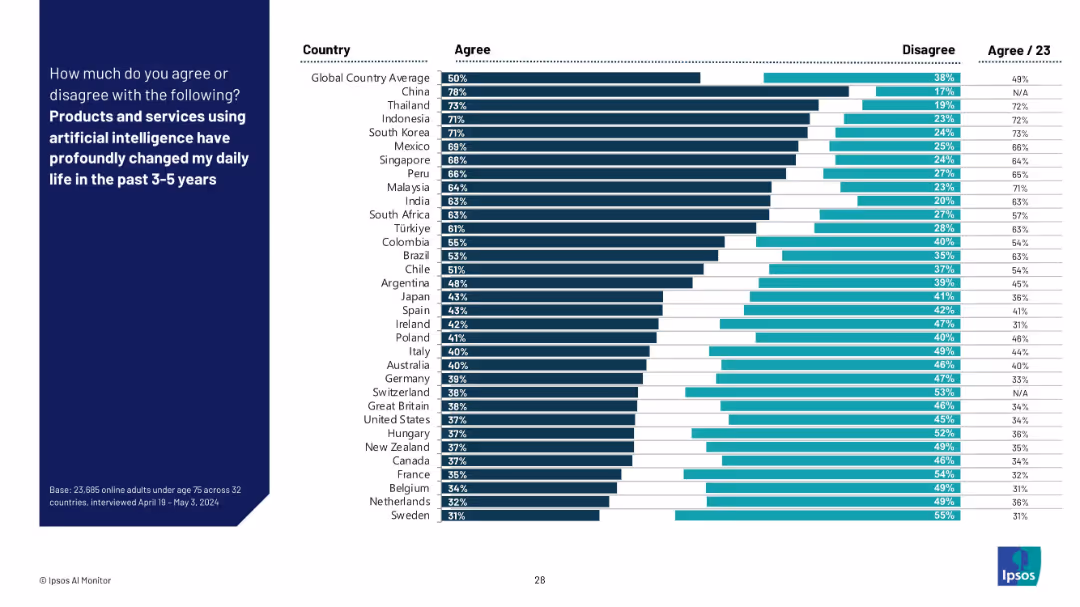
Vertical bar chart ranking agreement by country. Dark bars show agreement; adjacent lighter bars show disagreement. Country names listed left, percentages right.
Market Analysis and Trends
Artificial Intelligence
This slide shows country-by-country agreement on whether AI products and services have significantly impacted daily life in the past 3–5 years. Agreement is highest in China, Southeast Asia, and South Korea, while Western countries show lower agreement.
AI impact, country comparison, user experience, global sentiment, lifestyle change, technology adoption, daily life, survey results, Ipsos
false
Market Analysis and Trends
Artificial Intelligence
Mixed Chart
IPSOS
Add to my slides
Remove from favorites
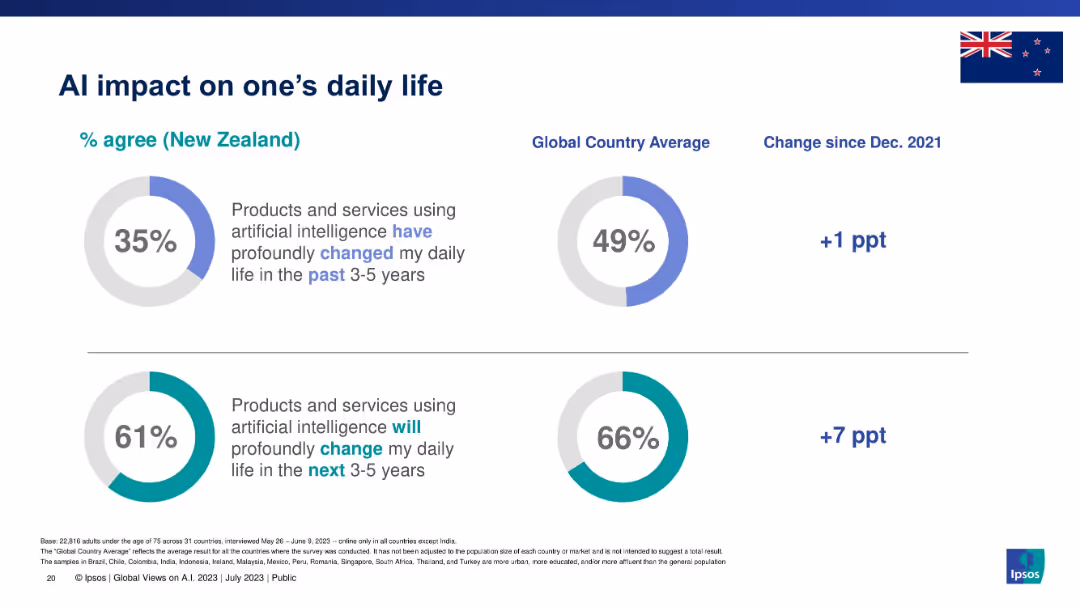
Two donut charts with New Zealand percentages vs. global averages for past and future AI impact.
Technology and Digital Transformation
Artificial Intelligence
Evaluates how people in New Zealand perceive the current and future impact of AI on their daily lives. Forecast shows higher expectations for the future than past experiences.
AI impact, daily life, digital change, New Zealand, Ipsos, future trends, consumer sentiment
false
Technology and Digital Transformation
Artificial Intelligence
Single Chart
IPSOS
Add to my slides
Remove from favorites
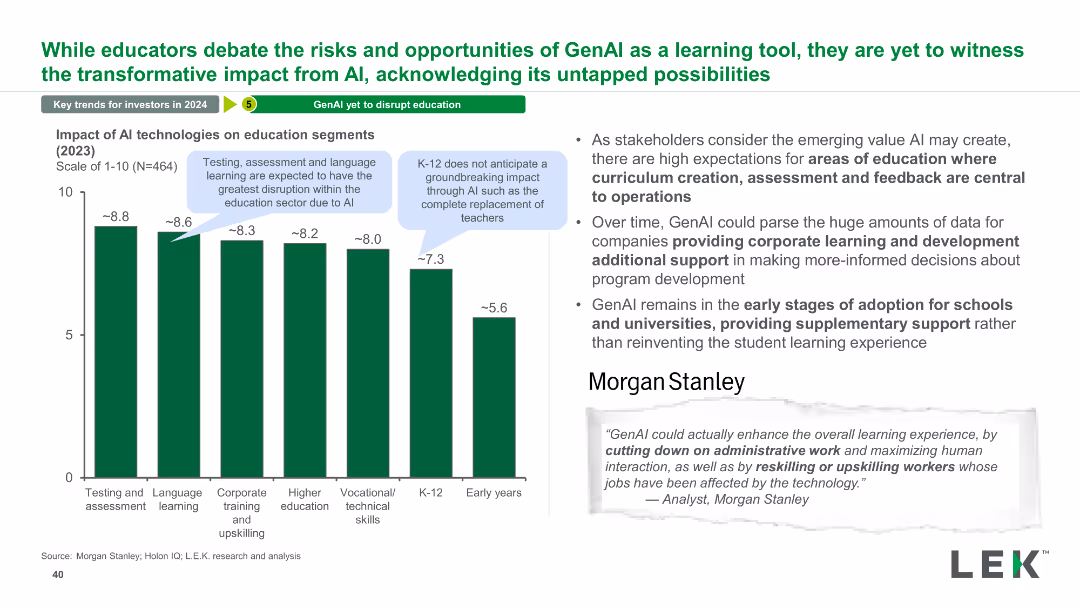
The slide has a column chart showing the impact of AI technologies on various education segments, with a narrative section explaining potential benefits and stakeholder expectations.
Technology and Digital Transformation
Education & Training
This slide explores the potential impact of AI on different segments of the education sector, highlighting areas like testing, assessment, and corporate training.
AI, Impact, Education, Segments, Technology, Testing, Assessment, Training, Benefits, Expectations
false
Technology and Digital Transformation
Education & Training
Mixed Chart
LEK
Add to my slides
Remove from favorites
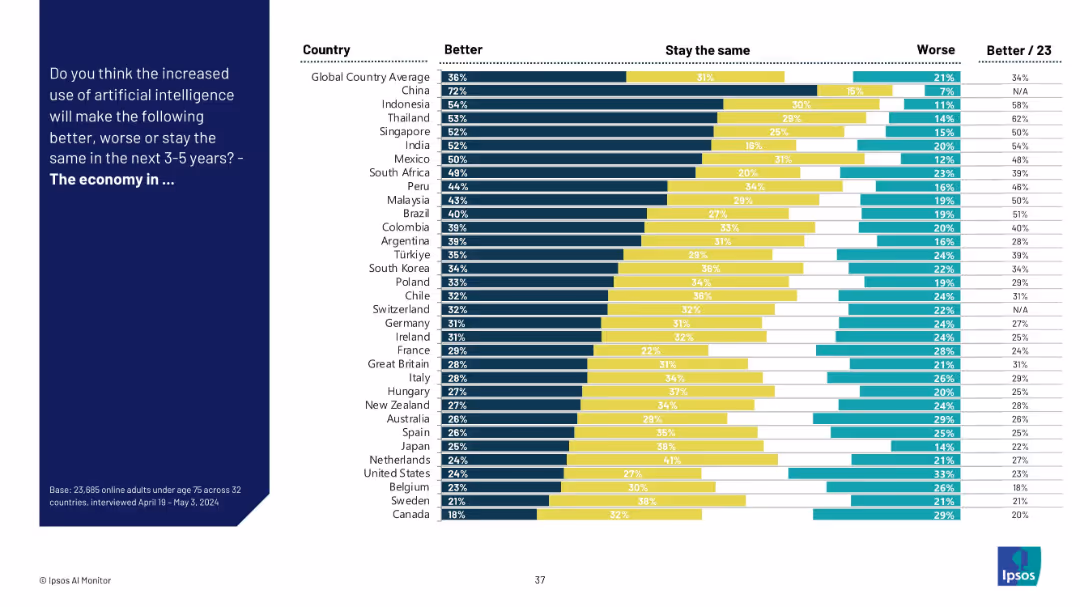
Split-panel layout with a dark blue sidebar containing the question text and a bar chart on the right showing responses across countries.
Market Analysis and Trends
Artificial Intelligence
The slide presents a global comparison of public opinion on whether AI will improve, worsen, or not affect the economy in the next 3–5 years. Results are shown for multiple countries, highlighting optimism in places like China and Indonesia.
AI impact, global economy, country comparison, public opinion, Ipsos, survey, optimism, AI perception, economic outlook, trends
false
Market Analysis and Trends
Artificial Intelligence
Mixed Chart
IPSOS
Add to my slides
Remove from favorites
Combines text with symbolic imagery of collaborative and technological themes.
Industry Overview
Professional Services
Offers an overview of AI's potential impact on industries, emphasizing the need for holistic approaches and ecosystem collaboration in leveraging AI.
AI Impact, Industry Transformation, Ecosystem Collaboration, Technological Advancement, Professional Insights, Business Strategy
false
Industry Overview
Professional Services
Framework
BCG
Add to my slides
Remove from favorites
A color-coded horizontal bar graph contrasted against a black background, assessing CEO beliefs about the impact of AI compared to the internet.
Market Analysis and Trends
Technology & Software
Evaluates CEO perspectives on AI's potential impact versus the internet revolution, highlighting significant regional insights.
AI impact, internet revolution, CEO survey, global regions, data comparison, technology adoption, business insights, future outlook, market research
false
Market Analysis and Trends
Technology & Software
Mixed Chart
PwC/Strategy&
Add to my slides
Remove from favorites
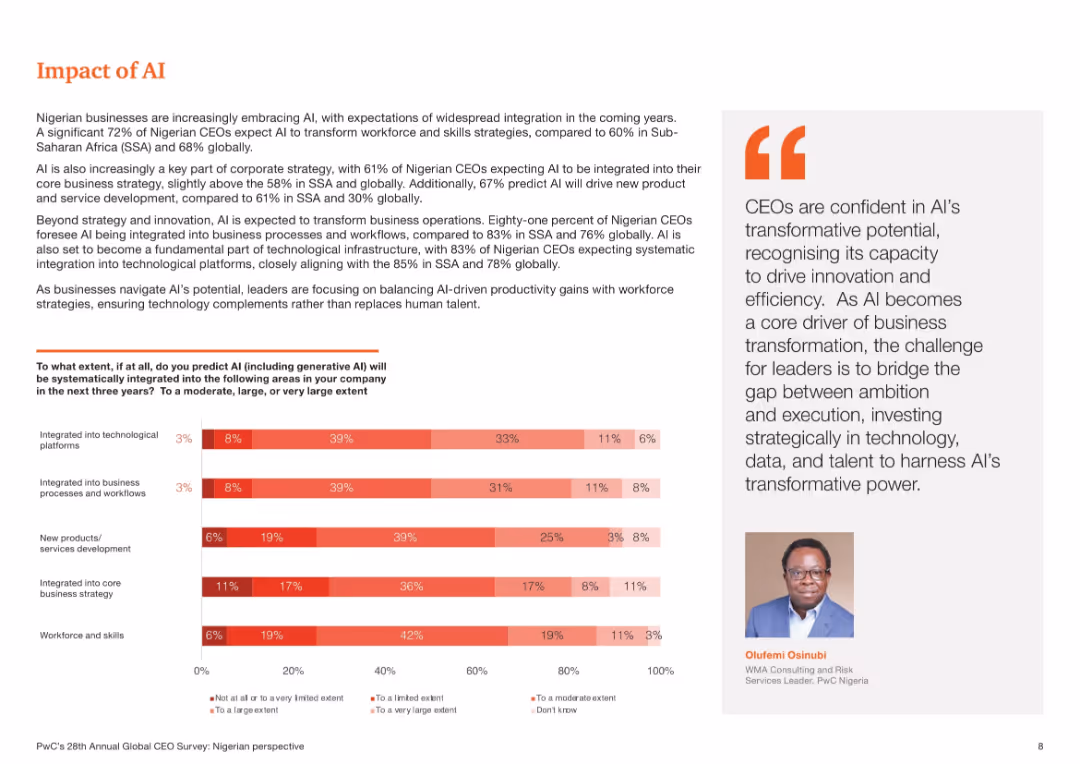
Bar chart showing predicted AI integration in five business areas. Right side contains explanatory paragraph and an executive quote. Red gradient color palette.
Technology and Digital Transformation
Professional Services
This slide illustrates Nigerian CEOs’ expectations of AI becoming a core part of business strategy, workforce transformation, and product development. It emphasizes high integration in business processes and technology platforms, underlining the growing relevance of AI in long-term planning and operations.
AI impact, Nigeria, integration, business strategy, workflows, generative AI
false
Technology and Digital Transformation
Professional Services
Mixed Chart
PwC/Strategy&
Add to my slides
Remove from favorites
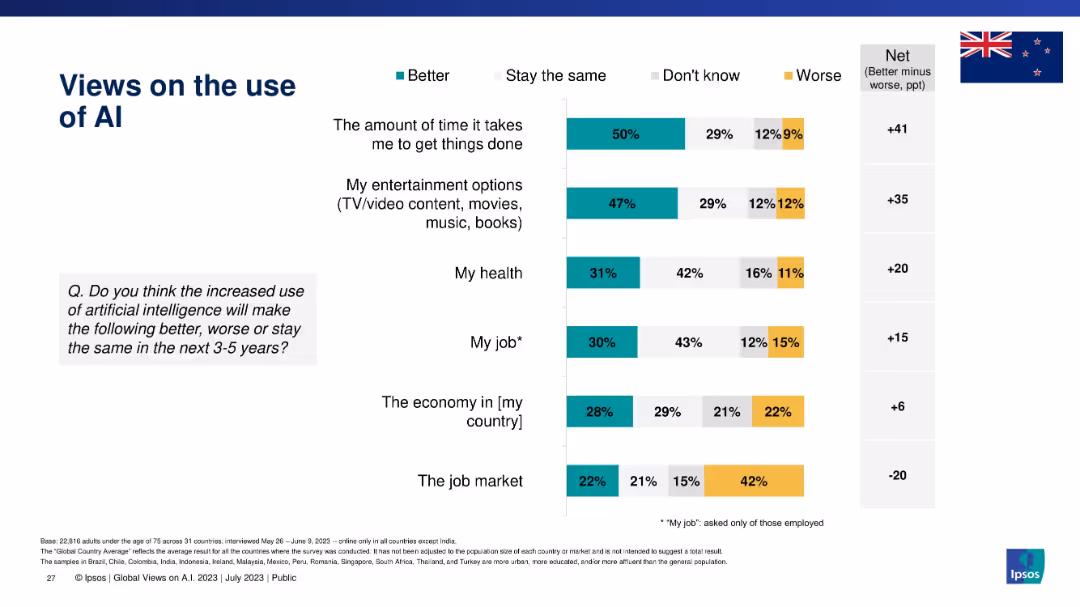
Stacked bar chart with multiple dimensions (better, worse, same, don’t know) and a net benefit score for different societal areas.
Strategic Planning
Artificial Intelligence
This slide displays New Zealanders' perspectives on AI’s future effects across domains such as productivity, entertainment, health, and employment. Results show mixed optimism, especially for job markets.
AI, impact, productivity, job market, society, entertainment, perceptions, future outlook, survey, New Zealand
false
Strategic Planning
Artificial Intelligence
Mixed Chart
IPSOS
Add to my slides
Remove from favorites
Previous
Next
You don't have any favorites yet.
Please wait loading your favorites slides...
Create a FREE account to continue browsing
Receive Instant Access to 1,000+ slides from companies like McKinsey, Google, and Goldman Sachs
First Name
Last Name
Email
Password
I agree to all
Terms & Privacy Policy
Thank you! Your submission has been received!
Oops! Something went wrong while submitting the form.
Have an account?
Sign in
Upgrade to PRO to Save slides
Advanced Search and Filters
Access to 15,000+ slides
Access to Category Pages
Save/Bookmark Slides
PowerPoint Template Library
Pick a Plan
MONTHLY
$12/month
Billed every month, Cancel anytime.
YEARLY
$9/year
Billed $108 annually, Cancel anytime.
Checkout for $12/month
Checkout for $108/yr
Secured by Stripe | AES-256 bit encryption