My Account
My Slides
Search by Category
Templates
Leave Feedback
Login
Logout
Get Started
Browse all Slides
Browse all Slides
Create a FREE Account
Instant access to 1,000+ real slides from top companies like McKinsey, BCG, Goldman Sachs, Google and many more!
First Name
Last Name
Email
Password
I agree to all
Terms & Privacy Policy
Thank you! Your submission has been received!
Oops! Something went wrong while submitting the form.
Have an account?
Sign in
Saved Slides
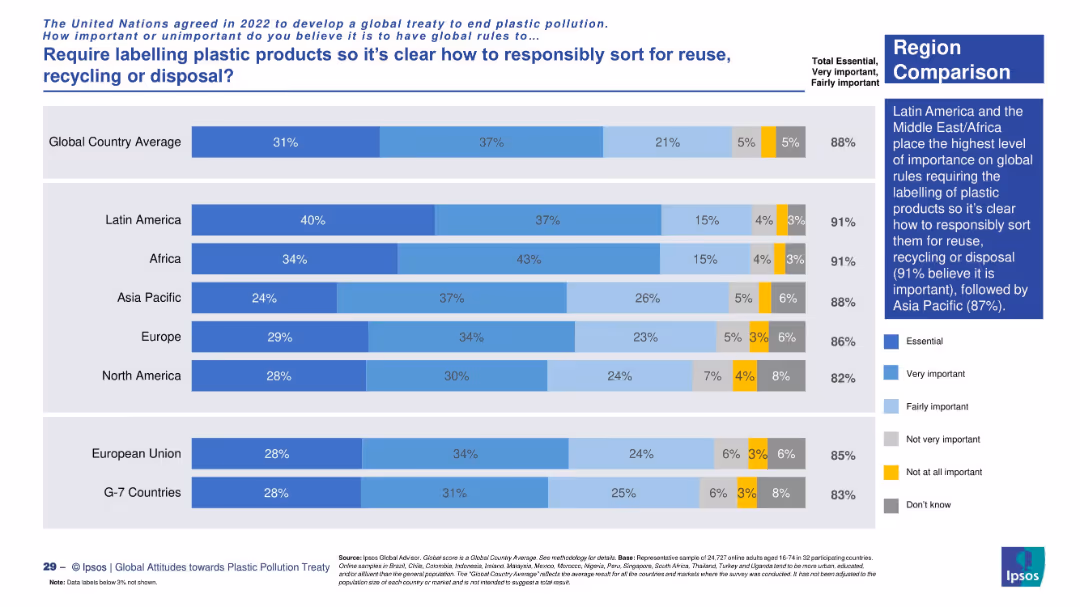
Regional comparison using a horizontal stacked bar chart. Blue gradients reflect levels of agreement, yellow and gray for disagreement and uncertainty. Right-side text block summarizes key findings.
Regulatory and Compliance
Environmental Services & Sustainability
This slide compares regions on support for labeling plastic products. Latin America and Africa lead in agreement (91%). The visual structure emphasizes the consistency of global concern over labeling for recycling and reuse.
labeling, plastic recycling, sustainability, consumer opinion, regional comparison, reuse, environmental policy, Ipsos data
Mixed Chart
IPSOS
Saved
Contains multiple pie charts comparing average time efforts across different speaker programs. The slide uses a clean design with color distinctions for different industry responses, facilitating an easy comparison of data across medical device and pharmaceutical sectors.
Regulatory and Compliance
Healthcare & Pharmaceuticals
Examines the effort and time investment required by speakers in various healthcare programs, including in-office and virtual settings. It aims to highlight differences in time commitments across sectors, providing a basis for understanding resource allocation in healthcare professional training.
speaker programs, effort analysis, healthcare, time investment, industry comparison
Multiple Chart
Deloitte
Saved
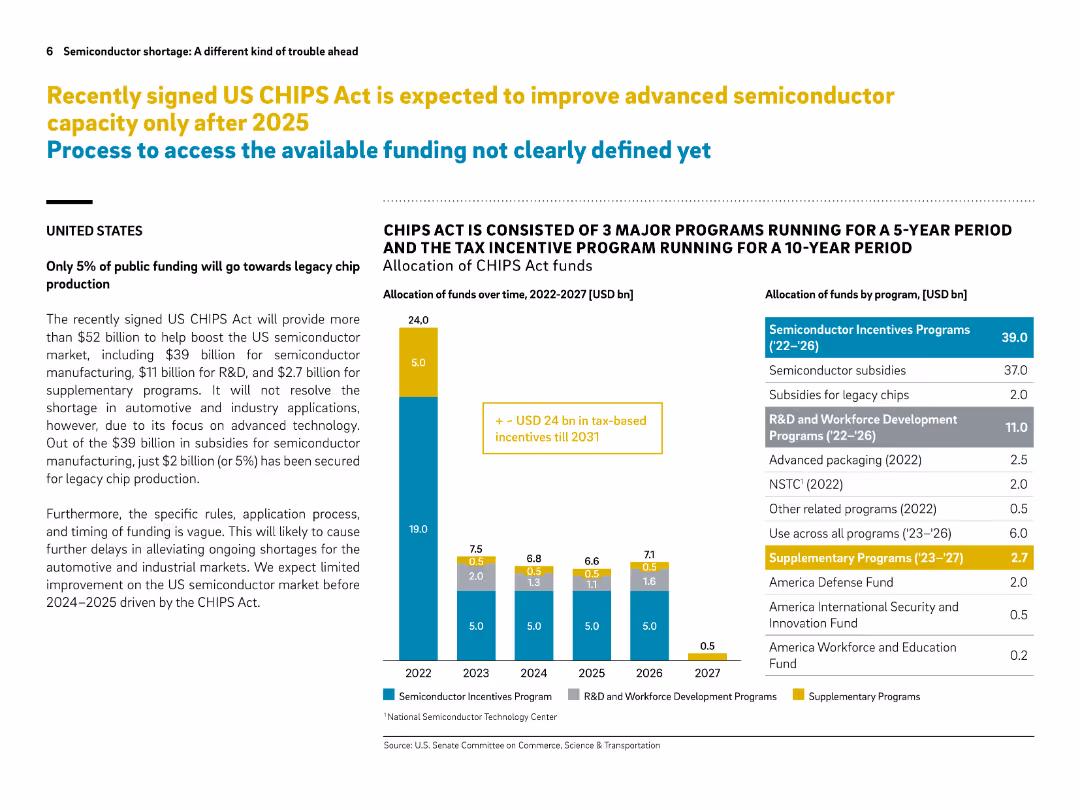
Split layout with left-aligned explanation text and bar chart on the right. Colored segments categorize different fund types.
Regulatory and Compliance
Government & Public Sector
This slide explains the funding allocation under the US CHIPS Act, emphasizing that only 5% is directed to legacy chip production. It breaks down how over $52B will be spent, highlighting delays in impact and lack of support for industrial/automotive applications.
CHIPS Act, funding, semiconductor, legacy chips, US policy, advanced technology, subsidies, R&D, timeline, market support
Mixed Chart
Roland Berger
Saved
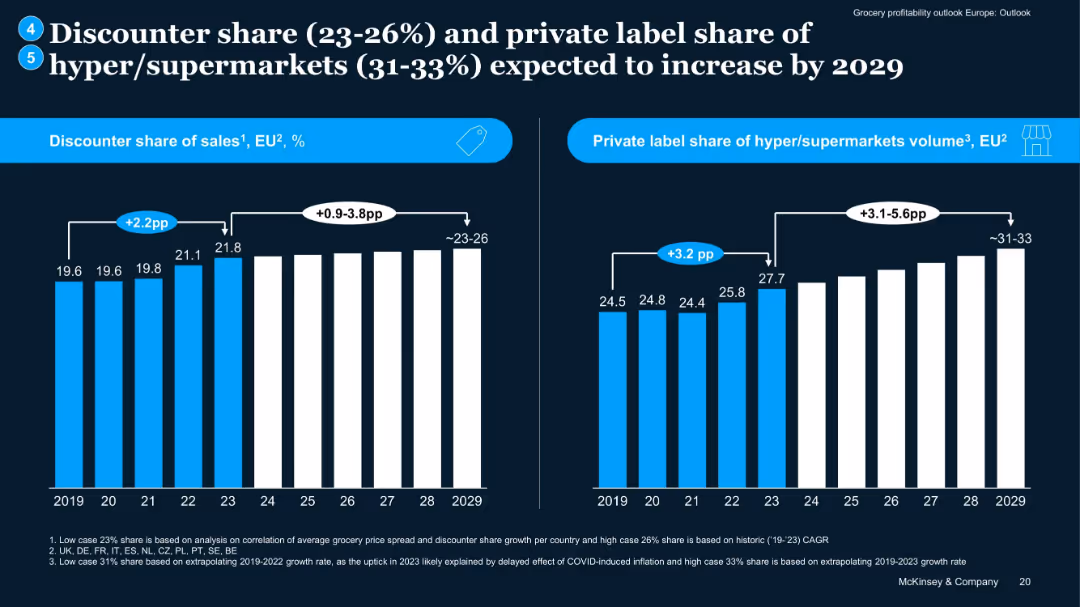
Two bar charts: left for discounter sales share, right for private label volume share, covering 2019–2029.
Market Analysis and Trends
Retail & E-commerce
Projects continued growth in discounter market share and private label volume among hypermarkets. Notes impact of COVID inflation on trend upticks, with forward projections extending to 2029, suggesting increased margin pressure and competition.
discounter growth, private label, projections, grocery trends, EU
Multiple Chart
McKinsey
Saved
The slide features an elegant design with a bar chart and professional imagery of a business setting. It compares satisfaction levels within an organization concerning various risk management activities, highlighting differences between more capable and less capable groups.
Strategic Planning
Professional Services
This slide explores the effectiveness of risk management practices across different organizational levels. It contrasts the satisfaction rates between groups with varying capabilities, underscoring the strategic benefits of comprehensive risk management training and integration within business processes. This comparison serves to motivate improvements in company-wide risk awareness and proactive management strategies.
risk management, empowerment, organizational levels, satisfaction rates, training, strategic benefits
Mixed Chart
Accenture
Saved
A pie chart shows 2020 revenue by customer, detailing the percentage of revenue from various automotive manufacturers. It is accompanied by text explaining customer diversity. Color-coding is used to distinguish different customers.
Customer and Market Segmentation
Industrial & Manufacturing
The slide presents the diversified customer base of TI Fluid Systems in 2020, emphasizing the strategic advantage of not relying excessively on any single customer, which helps in maintaining revenue consistency.
automotive, customer diversity, revenue, 2020, pie chart
Mixed Chart
Deutsche Bank
Saved
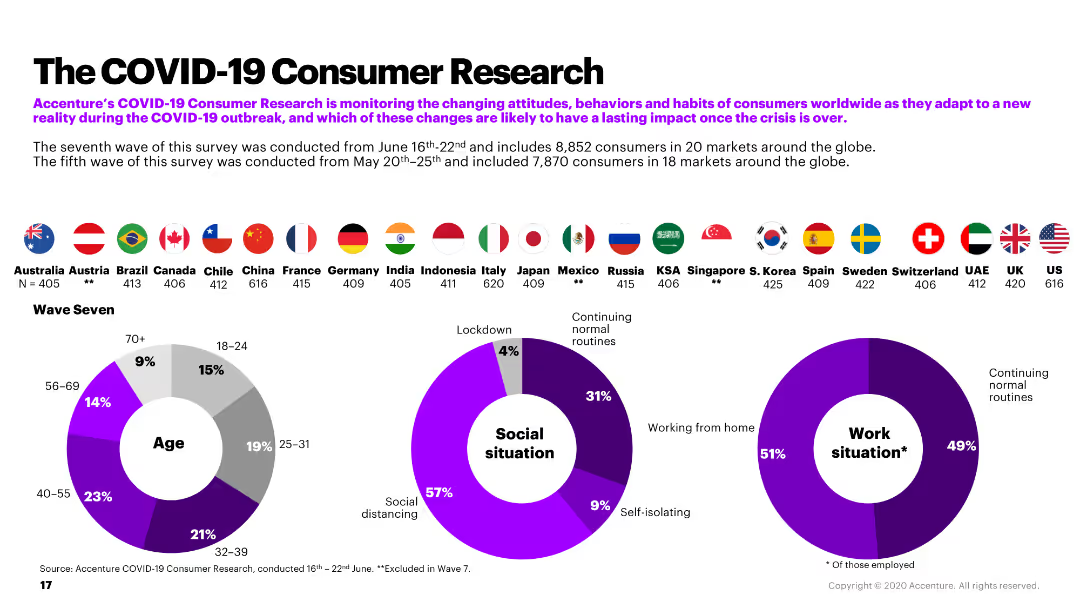
The slide includes a combination of pie charts and country flags, summarizing the demographic and situational data from Accenture's COVID-19 consumer research.
Market Analysis and Trends
Retail & E-commerce
The slide provides an overview of Accenture's COVID-19 consumer research, detailing demographics, social situations, and work situations during the pandemic.
COVID-19, consumer research, demographics, social situation, work situation
Multiple Chart
Accenture
Saved
The slide includes a large column chart and textual annotations explaining the potential expansion of the total addressable market (TAM) by Equifax in various segments, particularly in Brazil and other international markets.
Market Analysis and Trends
Technology & Software
Discusses Equifax's strategy to increase its market base and revenue through geographic and product expansion, with a focus on non-mortgage sectors to drive growth in a challenging market environment.
TAM, market expansion, revenue growth, Equifax
Mixed Chart
Barclays
Saved
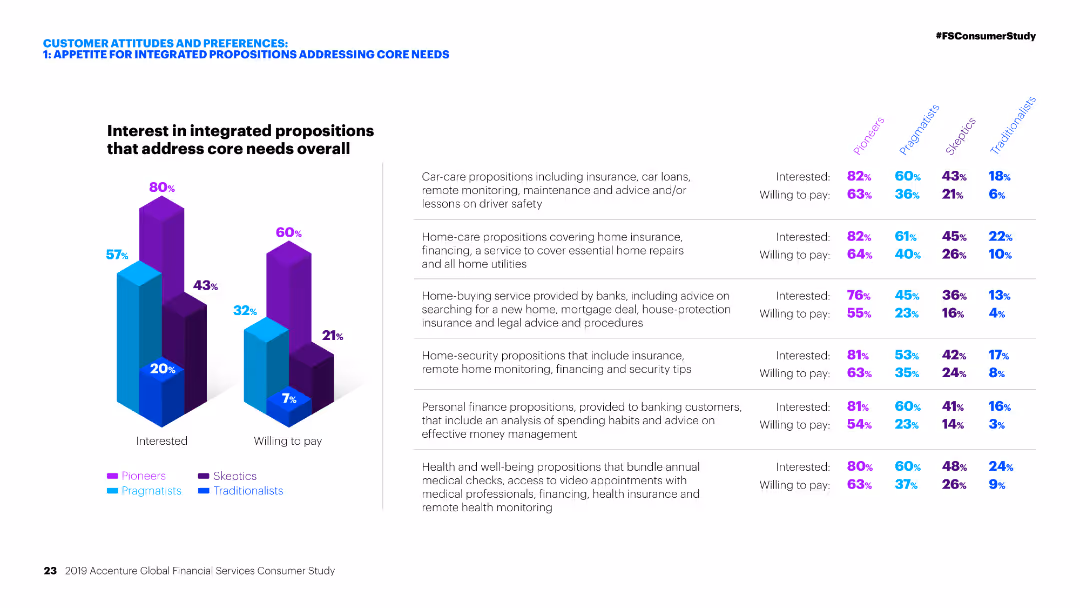
Column charts showing interest and willingness to pay for integrated propositions addressing core needs.
Market Analysis and Trends
Financial Services
Analysis of customer interest in integrated financial propositions, including car-care, home-care, home-buying, home-security, and personal finance.
Integrated propositions, financial services, customer interest, willingness to pay, core needs, market analysis, segmentation, personas, financial products
Multiple Chart
Accenture
Saved
A horizontal bar chart listing factors negatively affecting HR function, highlighting the top three factors.
Strategic Planning
Professional Services
Slide illustrates major barriers in HR function performance, useful in HR management discussions for identifying critical areas of focus.
HR, barriers, management, performance, top three
Single Chart
PwC/Strategy&
Saved
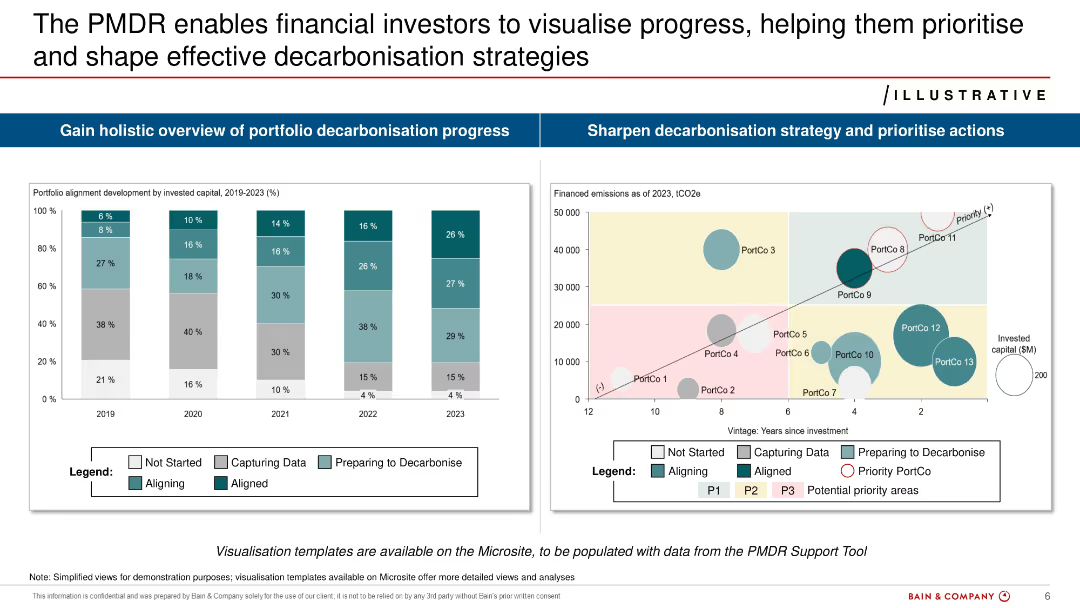
Split layout with two main graphs: bar chart of portfolio alignment (2019–2023) and bubble chart of financed emissions vs. investment age.
Risk Assessment and Management
Financial Services
Demonstrates how financial investors can use PMDR to assess decarbonization progress. Provides alignment metrics over time and visualizes emissions by portfolio company. Aims to guide prioritization and strategy.
PMDR, investors, decarbonization, emissions, portfolio, alignment, risks
Multiple Chart
Bain
Saved
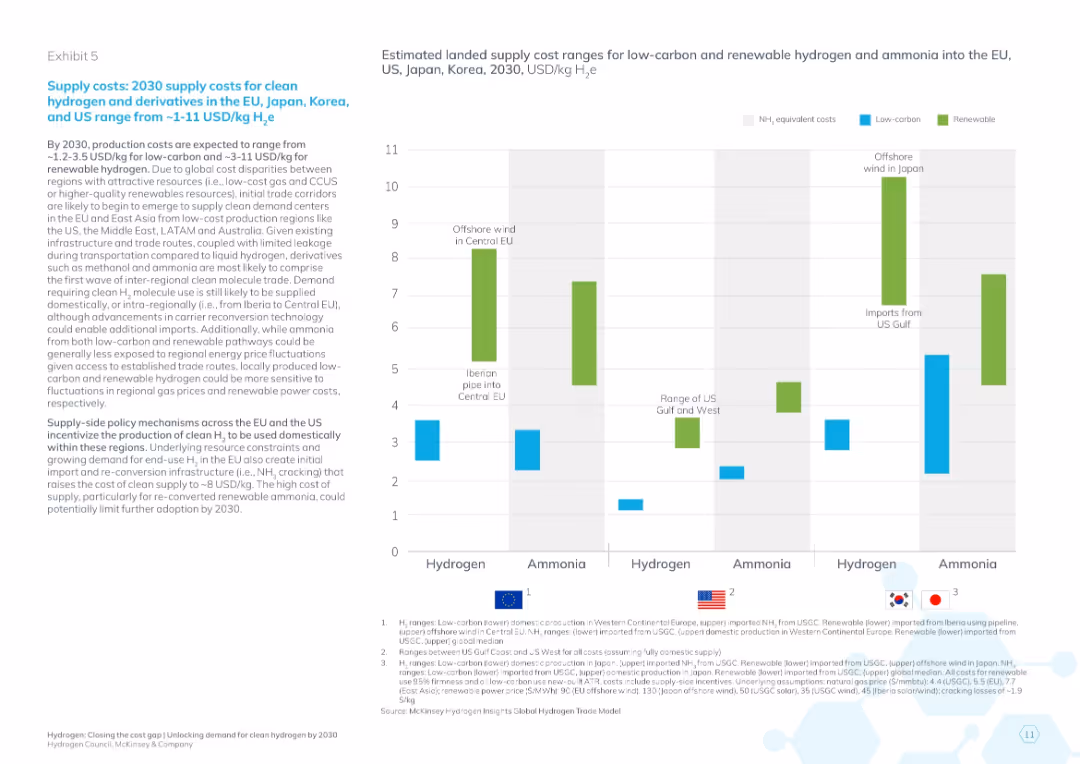
Text on the left discusses 2030 supply cost ranges; right side has a bar graph comparing hydrogen and ammonia cost ranges by source and geography.
Pricing Strategies
Energy & Utilities
Analyzes expected 2030 supply costs of clean hydrogen and derivatives across regions. Visualizes cost differences between low-carbon and renewable sources, emphasizing cost competitiveness by region.
hydrogen cost, renewable supply, EU energy, pricing strategy, ammonia, 2030 projections, energy policy, regional comparison, low-carbon fuels
Mixed Chart
McKinsey
Saved
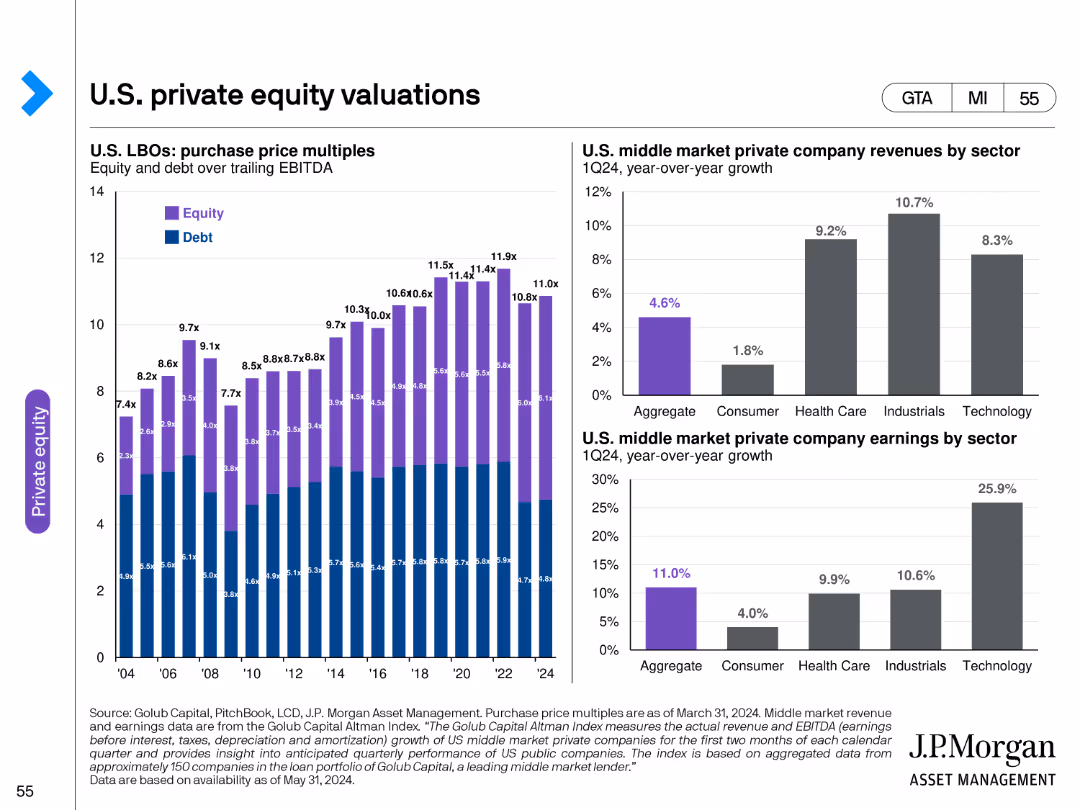
This slide includes a combination of column charts and bar charts, showing U.S. LBOs purchase price multiples and middle market private company financial metrics.
Market Analysis and Trends
Financial Services
It provides an analysis of U.S. private equity valuations, highlighting purchase price multiples for LBOs and financial performance of middle market private companies.
private equity, U.S., valuations, LBOs, multiples, financial performance, middle market, metrics
Multiple Chart
JP Morgan
Saved
The slide is divided into two sections: one with text bullet points and the other with a graphical representation of metrics, using a cohesive blue and white theme.
Financial Performance
Financial Services
Provides an analysis of the investment banking sector, with metrics such as wallet share, client footprint, and market rankings. It measures the company's progress and success in investment banking.
investment banking, wallet share, client footprint, market ranking, metrics
Text Only
Goldman Sachs
Saved
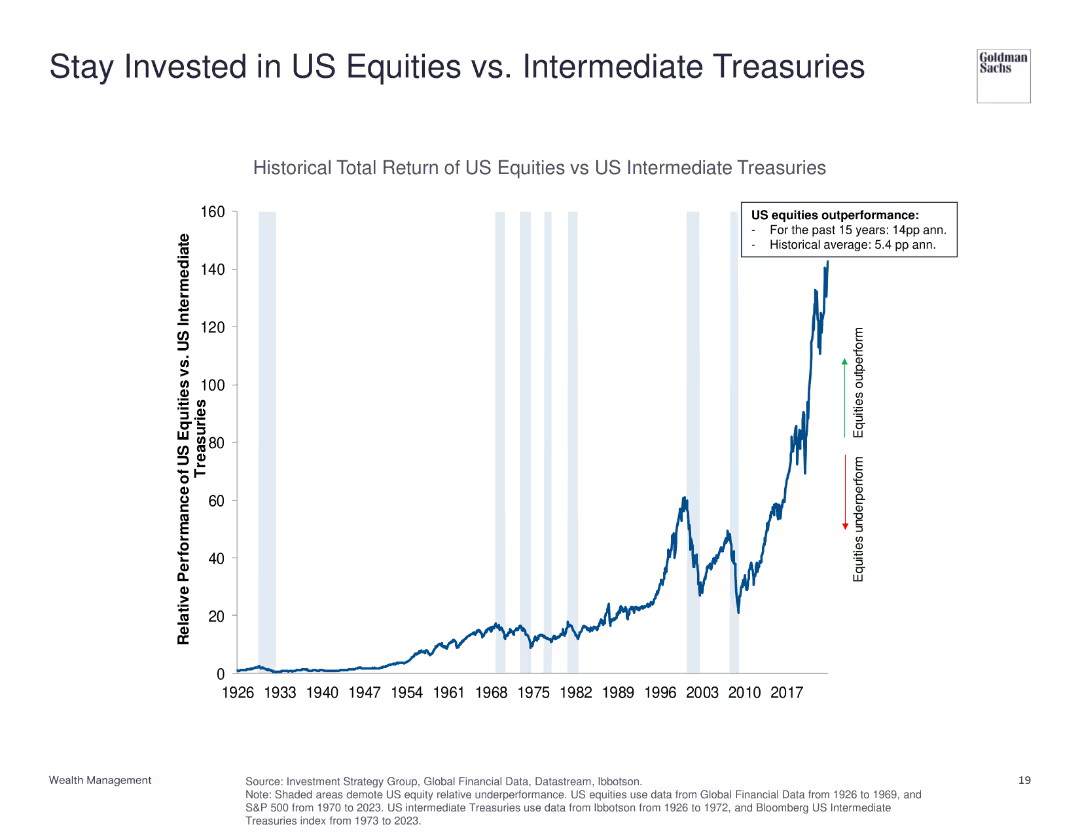
The slide displays a line chart showing the historical total return of US equities versus US intermediate treasuries from 1926 to 2023. Annotations highlight periods of outperformance and underperformance.
Investment Analysis
Financial Services
This slide compares the total return of US equities to US intermediate treasuries, indicating the significant outperformance of equities over the long term.
US equities, intermediate treasuries, historical return, investment, performance comparison
Single Chart
Goldman Sachs
Saved
Contains bar graphs, and detailed text analysis comparing China, the US, and EU in terms of battery production capabilities. The slide uses a combination of purple, blue, and grey colors.
Competitive Landscape
Energy & Utilities
This slide details the strategic industrial policies of the world's largest economies in the battery sector, focusing on manufacturing capacities and government incentives.
battery industry, China, US, EU, industrial policy, manufacturing capacity, government incentives
Mixed Chart
Accenture
Saved
Utilizes column charts to depict consumer awareness and preference statistics across different generations and nationalities.
Competitive Landscape
Retail & E-commerce
Analyzes consumer awareness of luxury brand collaborations, emphasizing the influence of younger generations and Chinese consumers.
Luxury brands, collaborations, consumer awareness, generations, Millennials, Gen Z, Chinese, market influence
Multiple Chart
BCG
Saved
Presents multiple line charts tracking spending trends across various income and spending categories over several months.
Financial Performance
Financial Services
Analyzes spending patterns in the U.S. during 2020, noting differences in recovery rates among income levels and spending categories, revealing slower discretionary spending recovery among high-income groups.
Spending, COVID-19, Income Levels, Recovery, U.S. Economy
Multiple Chart
McKinsey
Saved
Contains pie and column charts detailing liquidity coverage and net stable funding ratios, with qualitative key highlights.
Financial Performance
Financial Services
Reviews the bank's liquidity and funding status, highlighting improvements and strategies to maintain robust financial health.
liquidity, funding, finance, LCR, NSFR, stability
Multiple Chart
Deutsche Bank
Saved
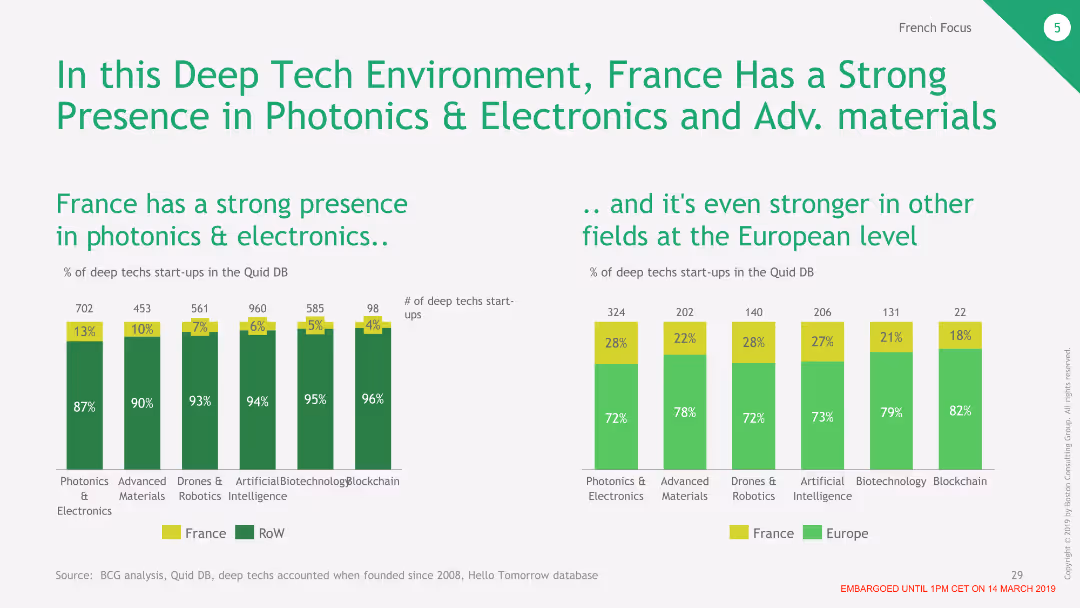
The slide features two column charts. The left chart shows the percentage of deep tech startups in France by category, and the right chart compares the percentage of startups in France versus Europe.
Market Analysis and Trends
Technology & Software
This slide illustrates France's strong presence in photonics and electronics, highlighting its competitive position in various deep tech fields compared to the rest of Europe.
France, Deep Tech, Photonics, Electronics, Comparison
Multiple Chart
BCG
Saved
Title at the top, three-column format with text and checkmarks. The first column lists monetary targets, the second lists client propositions with checkmarks, and the third outlines progress with investment platforms.
Investment Analysis
Financial Services
Highlights the 5-year opportunity and strong client value propositions in third-party alternative investments, including capital reduction, franchise development, and capital efficiency optimization.
Investments, Capital, Alternatives, Efficiency, Multi-Asset Class
Table
Goldman Sachs
Saved
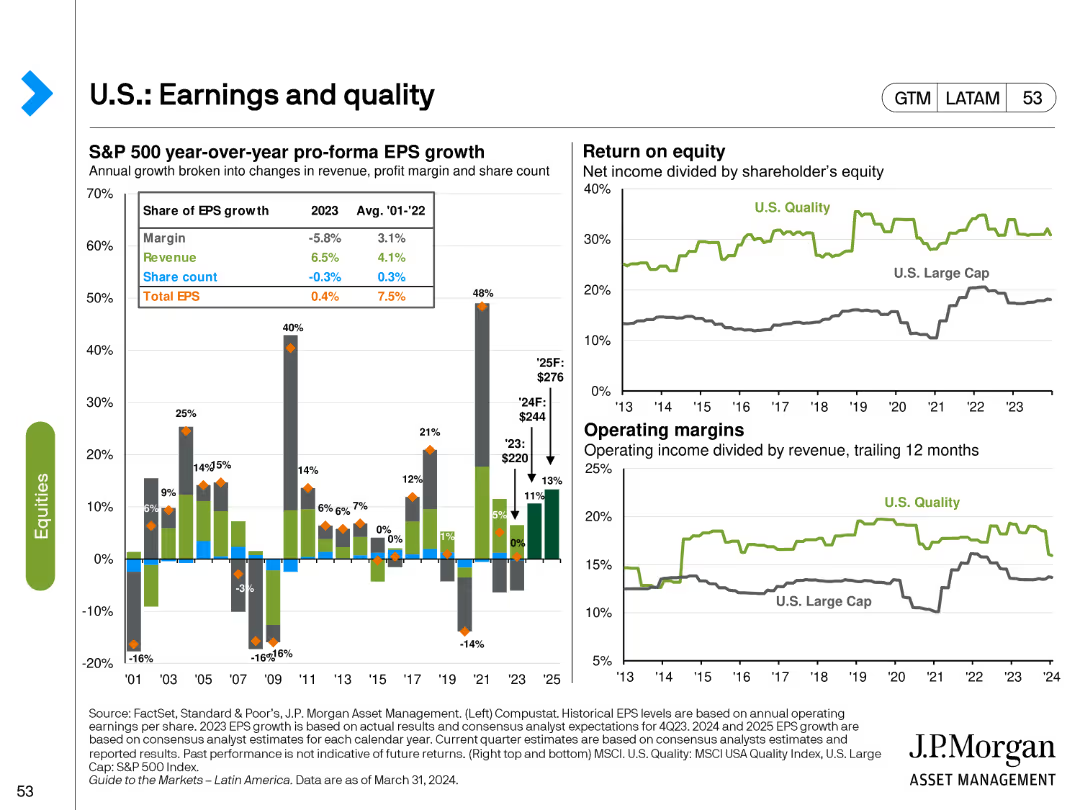
The slide features a bar chart for S&P 500 EPS growth components and line charts for return on equity and operating margins. Different colors and markers highlight various aspects of earnings growth and quality.
Financial Performance
Financial Services
It analyzes the components of EPS growth, return on equity, and operating margins for U.S. equities, providing insights into the quality and sustainability of earnings in the S&P 500 index.
EPS growth, return on equity, operating margins, S&P 500, financial quality
Multiple Chart
JP Morgan
Saved
Consisting of column charts, this slide provides an analysis of private banking and lending revenues, with growth metrics.
Operational Efficiency
Financial Services
Meant for stakeholders interested in the private banking and lending sector, showing revenue growth and providing insights into market expansion strategies, excluding specific product lines for focused analysis.
private banking, lending, revenue growth, strategy, market expansion
Single Chart
Goldman Sachs
Saved
The slide displays column charts in varying shades of blue, showcasing asset growth over time with annotations. Arrows are used to indicate trends and future projections.
Financial Performance
Financial Services
This slide presents asset growth data and projections for future growth, illustrating traditional and alternative net inflows, with the ultimate goal of reaching a projected AUS of approximately $2.2 trillion.
Asset, Growth, Inflows, Projections, Financial
Single Chart
Goldman Sachs
Saved
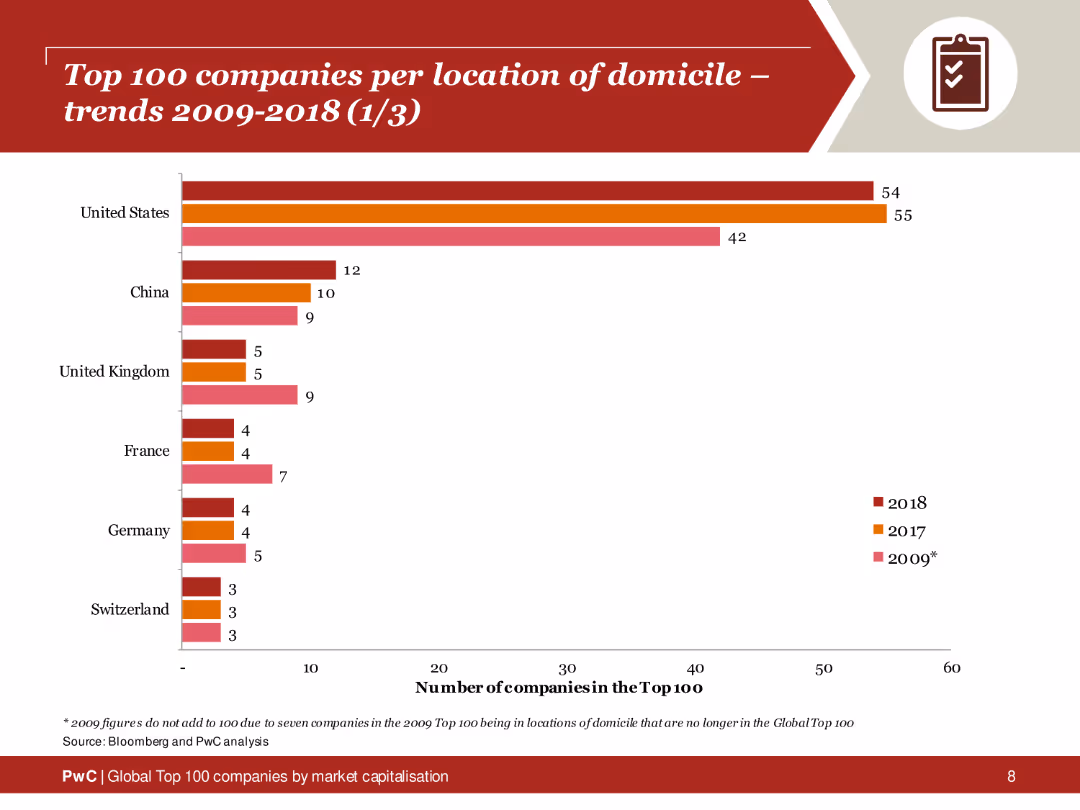
The slide shows a column chart comparing the number of top 100 companies from various countries (US, China, UK, France, Germany, Switzerland) across 2009, 2017, and 2018.
Competitive Landscape
Financial Services
Trends in the number of top 100 companies by location from 2009 to 2018, highlighting changes in the US, China, UK, and other countries.
top 100 companies, domicile, trends, US, China, UK
Single Chart
PwC/Strategy&
Saved
Next
If nothing, comes up, please save your slides first
Create a FREE account to continue browsing
Receive Instant Access to 1,000+ slides from companies like McKinsey, Google, and Goldman Sachs
First Name
Last Name
Email
Password
I agree to all
Terms & Privacy Policy
Thank you! Your submission has been received!
Oops! Something went wrong while submitting the form.
Have an account?
Sign in
Column Chart
Heatmap
Chevron
Org Chart
Infographic
Callouts
Timeline
List
Graphic
Picture
Process Flow
Diagram
Paragraph
Map
Table
Framework
Subtitle
Takeaway Box
Icon
Other Chart
Radar Chart
Waterfall Chart
Mekko Chart
Pie Chart
Scatter Plot
Line Chart
Bar chart
Bullet points