My Account
My Slides
Search by Category
Templates
Leave Feedback
Login
Logout
Get Started
Browse all Slides
Browse all Slides
Create a FREE Account
Instant access to 1,000+ real slides from top companies like McKinsey, BCG, Goldman Sachs, Google and many more!
First Name
Last Name
Email
Password
I agree to all
Terms & Privacy Policy
Thank you! Your submission has been received!
Oops! Something went wrong while submitting the form.
Have an account?
Sign in
Saved Slides
A bar graph with a percentage breakout showing the prioritization of personalized product offerings by executives.
Market Analysis and Trends
Professional Services
Evaluates the importance placed on personalized products in business strategy, as seen by different company sizes and executive roles.
Personalization, Executive Priorities, Bar Graph, Product Strategy
Single Chart
Kearney
Saved
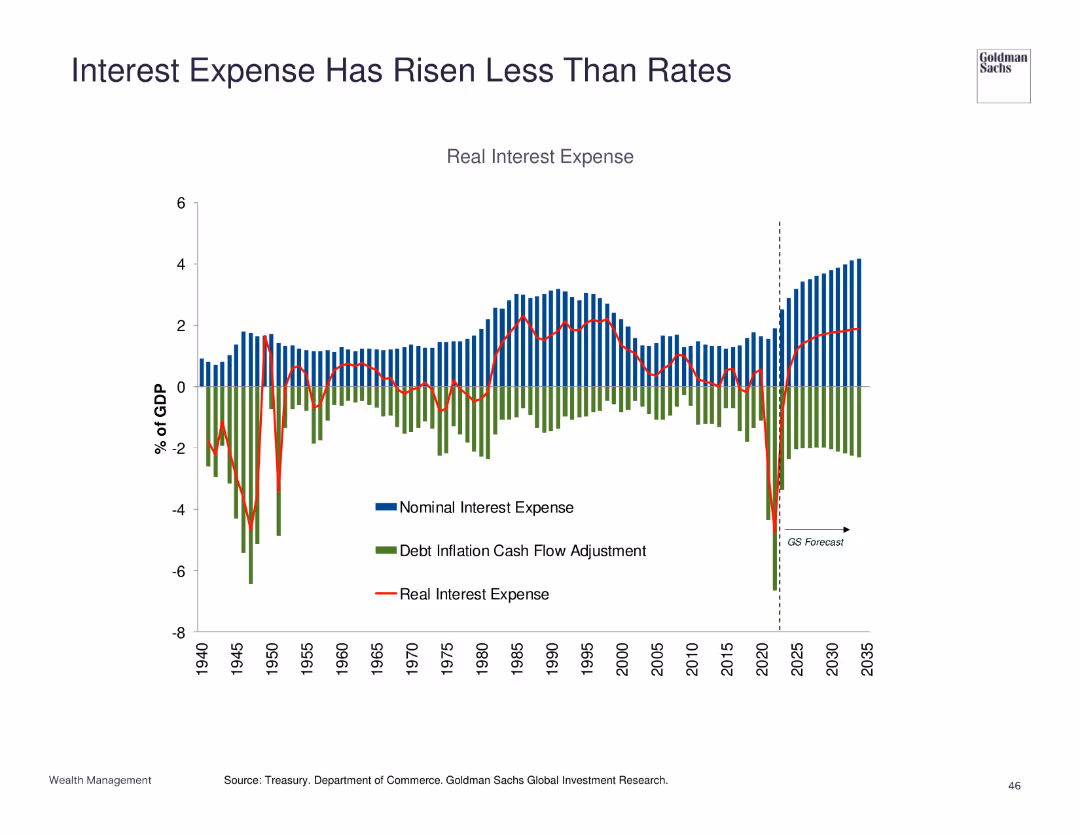
Stacked bar chart showing nominal interest expense, debt inflation cash flow adjustment, and real interest expense as a percentage of GDP.
Financial Performance
Financial Services
Reviews the trend of interest expenses relative to rates, suggesting that expenses have risen less rapidly than rates.
interest expense, rates, GDP, financial performance
Single Chart
Goldman Sachs
Saved
Includes various column charts, textual analysis, and quantitative data showcasing business diversity.
Risk Assessment and Management
Financial Services
Discusses the benefits of diversification across businesses and client geographies in challenging environments.
Diversification, mortgage trading, client geographies, business resilience, economic challenges
Multiple Chart
JP Morgan
Saved
The slide contains two column charts showing capital development and ratios at different stages, with notes on funding cost saves and capital ratio requirements.
Financial Performance
Financial Services
This slide discusses the group's strong capital position and outlines the expected development of capital ratios from 2023 to 2026, emphasizing funding cost savings.
capital position, ratios, funding cost, development, 2026
Multiple Chart
UBS
Saved
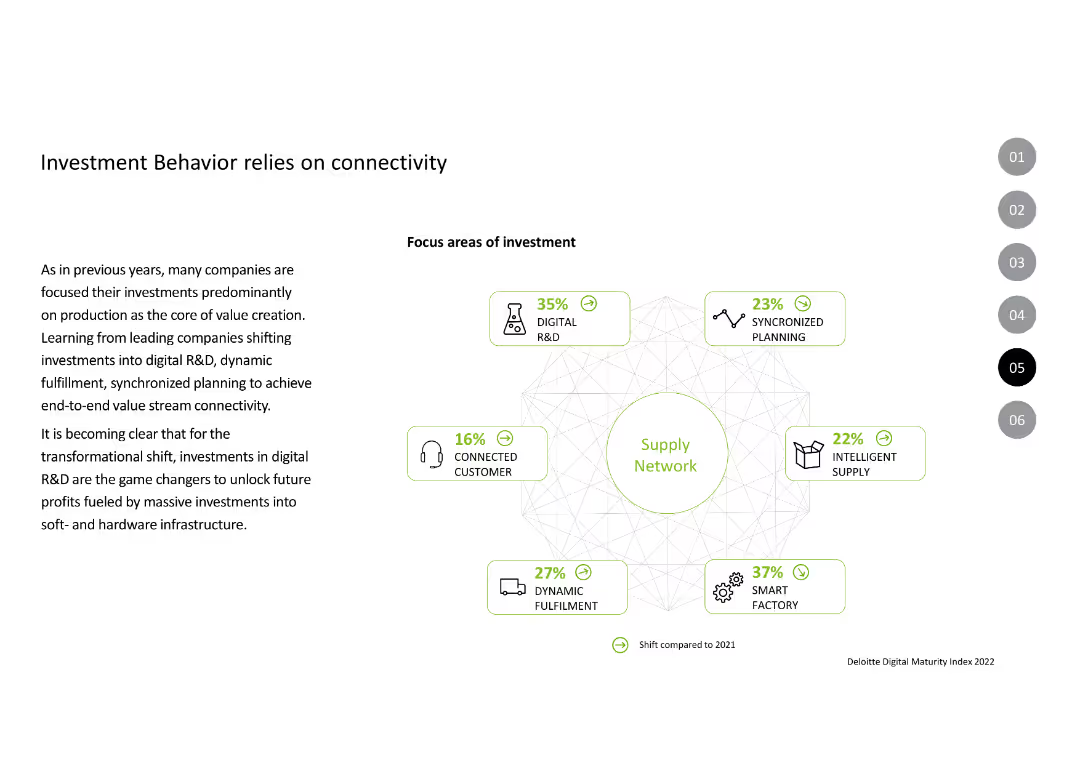
This slide includes an infographic depicting various focus areas of investment around a central "Supply Network" theme. Each area is color-coded, with icons and percentage figures showing investment shifts compared to the previous year. Text is aligned on the left, explaining investment focus changes.
Strategic Planning
Technology & Software
Emphasizes the importance of connectivity in investment strategies, detailing areas like digital R&D, synchronized planning, and intelligent supply. Describes how these areas contribute to a transformational shift in value creation and future profitability.
Connectivity, Investment, R&D, Supply, Planning
Diagram
Deloitte
Saved
This slide presents a narrative scenario with a moderate visual complexity. It uses a balanced text layout to tell a story about gender diversity issues in a professional setting. Red highlights and silhouette icons emphasize key points. The design includes bullet points, two text blocks, and stylized graphic elements.
Technology and Digital Transformation
Professional Services
The slide narrates a scenario of gender bias in a multinational company, depicting the overlooked leadership potential of a female employee due to stereotypes. It serves to initiate discussions on gender diversity and inclusion within corporate environments, particularly in international mobility opportunities.
Gender bias, Leadership, Diversity, Inclusion, Multinational
Boxed
PwC/Strategy&
Saved
The slide combines text with a large title on the left and a column chart on the right. The chart lists major enterprise-wide changes involving risk as a key group.
Strategic Planning
Financial Services
It outlines how risk management aligns with business transformation agendas, focusing on key enterprise-wide initiatives involving risk management.
Transformation, business alignment, enterprise-wide changes, risk management
Mixed Chart
EY
Saved
Modern building image on a blue-toned background listing topics such as blockchain fundamentals and commercial applications of Web 3 technologies.
Strategic Planning
Technology & Software
Serves as an agenda slide for a presentation on Web 3 and digital assets, outlining the scope and sequence of topics to be covered, from blockchain technology to its commercial applications.
Web 3, digital assets, blockchain, agenda, technologies
Agenda
McKinsey
Saved
Red line and bar graph against a white background, showing China's cases per day and total reported cases, with key event markers.
Risk Assessment and Management
Healthcare & Pharmaceuticals
Outlines China's response to COVID-19 with lockdowns and testing, highlighting the timeline of cases and government actions.
China, lockdowns, testing, COVID-19, government response
Single Chart
McKinsey
Saved
This slide includes text explanations and numbered points outlining the roles of the Chief Risk Office, Chief Sustainability Office, and Data and Technology.
Risk Assessment and Management
Financial Services
It describes Deutsche Bank's approach to integrating ESG into risk management, advancing sustainable finance, and leveraging data and technology to scale ESG business responsibly.
Risk, control, policies, ESG, sustainability, technology, risk management, integration, banking, success
Header Vertical
Deutsche Bank
Saved
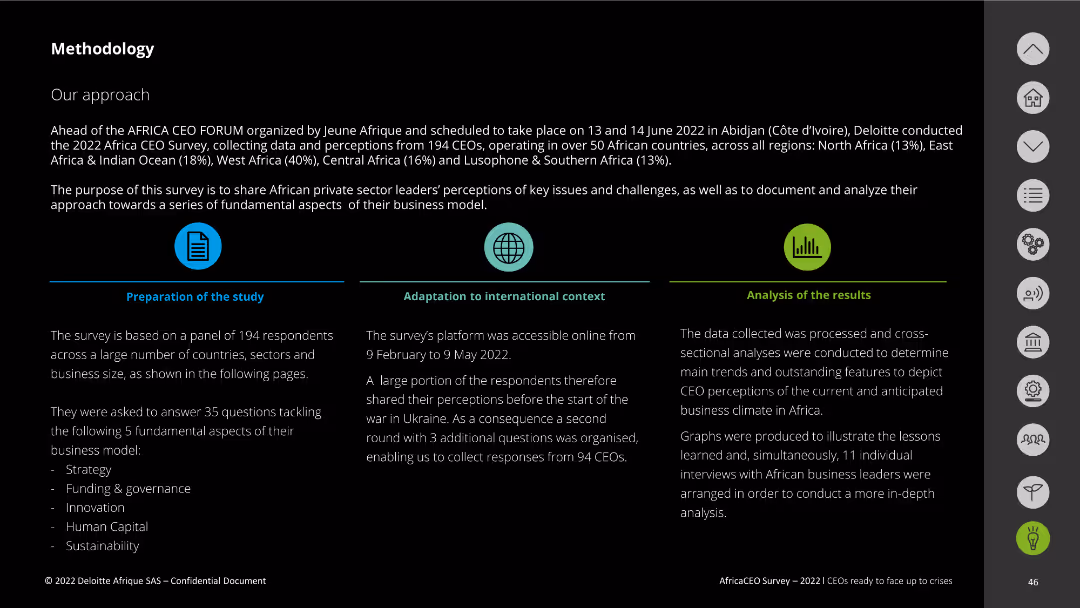
This slide provides an overview of the methodology with textual descriptions and icons.
Strategic Planning
Professional Services
It outlines the approach, preparation, adaptation, and analysis processes used in conducting the 2022 Africa CEO Survey.
methodology, survey approach, data analysis, Africa CEO Survey, preparation
Pillar
Deloitte
Saved
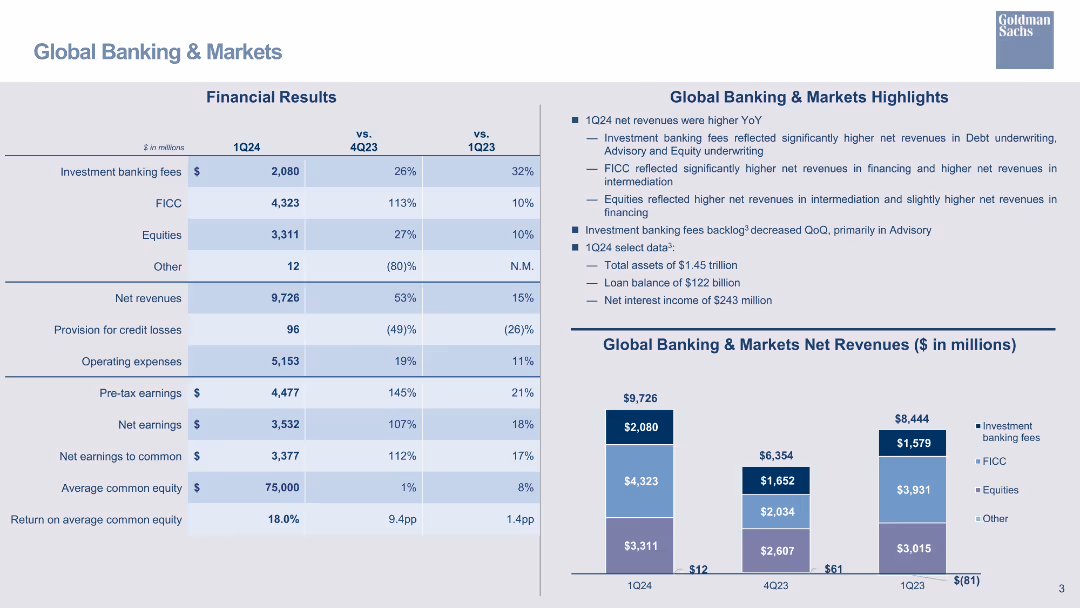
Detailed table showing financial results for various banking segments, with bar charts for net revenues and key highlights.
Financial Performance
Financial Services
Summarizes financial results in the Global Banking & Markets segment, including investment banking fees and FICC revenues.
global banking, financial results, investment banking, FICC, equities, net revenue, bar chart
Mixed Chart
Goldman Sachs
Saved
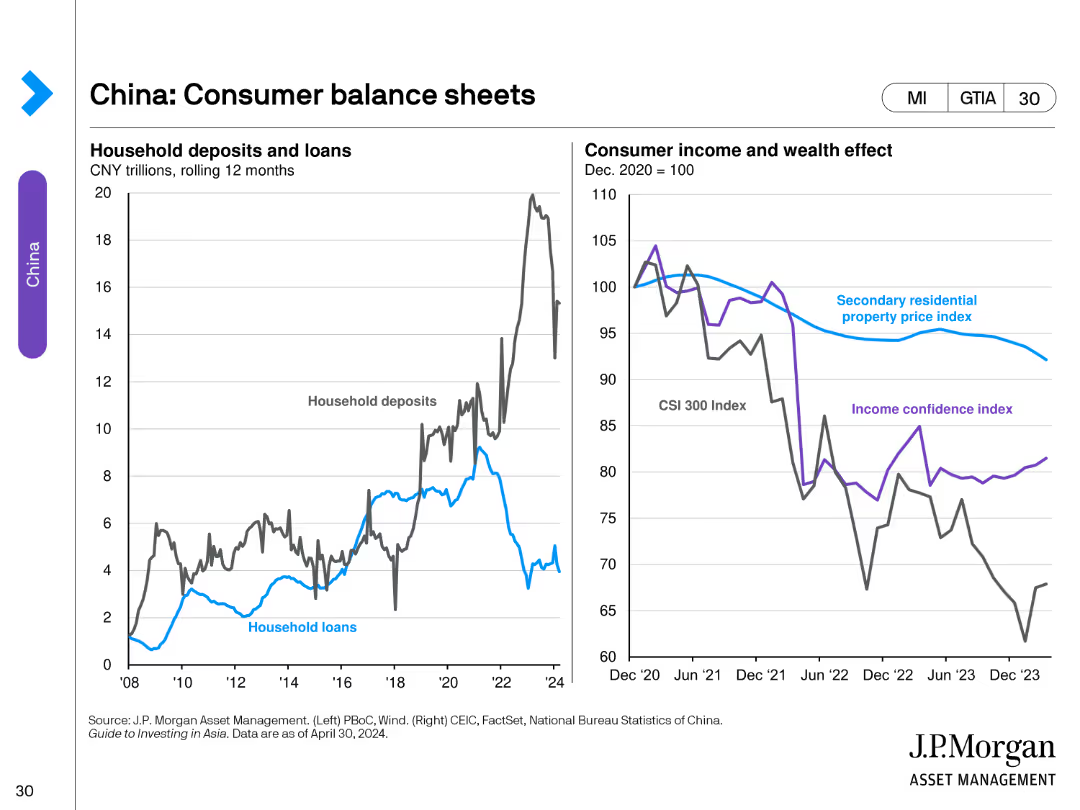
The slide features two line charts. The left chart depicts household deposits and loans in trillions of CNY. The right chart shows consumer income and wealth effect, including indexes like secondary property price and income confidence.
Financial Performance
Financial Services
This slide reviews the financial status of Chinese consumers, showing trends in household deposits and loans and examining the effect on consumer income and wealth.
Financial, Deposits, Loans, Wealth, Income
Multiple Chart
JP Morgan
Saved
Features simple icons and text highlighting key statistics about the green economy in Southeast Asia, including financial commitments and investment figures.
Financial Performance
Financial Services
Offers a numerical summary of recent investments and environmental commitments in Southeast Asia, highlighting the potential economic opportunities and necessary investments to achieve net zero emissions targets.
net zero, investments, Southeast Asia, green economy
Table
Bain
Saved
Column chart comparing the levelized cost of energy for gas combined cycle plants with CCS, under retrofit and new-build scenarios, with and without subsidies.
Financial Performance
Energy & Utilities
The slide compares the costs of gas combined cycle plants with CCS, analyzing both retrofit and new-build scenarios and showing cost differences due to subsidies.
CCS, Gas combined cycle, Cost analysis, Retrofit, New-build
Single Chart
Roland Berger
Saved
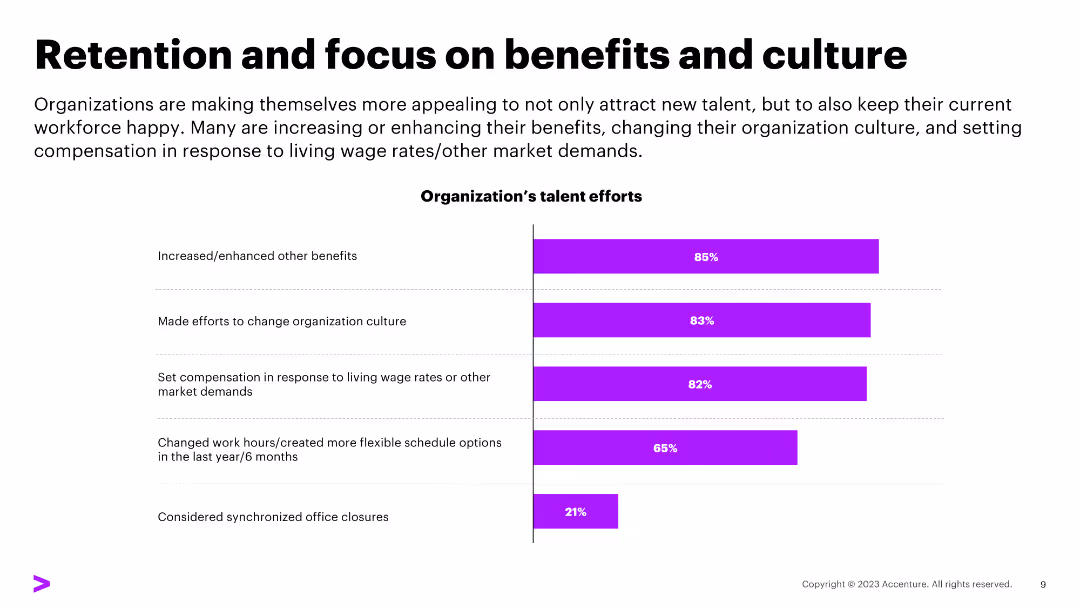
The slide contains a column chart with percentages indicating organizational efforts on benefits and culture. The design is moderately dense with text and visual elements.
Human Resources and Talent Management
Professional Services
Highlights organizational efforts to improve employee retention by enhancing benefits and organizational culture.
retention, benefits, culture, compensation, flexible schedule, office closures
Single Chart
Accenture
Saved
Contains a large blue column chart for e-Commerce GMV growth and text boxes outlining key insights related to market dynamics.
Strategic Planning
Retail & E-commerce
Highlights the rapid growth of e-Commerce GMV and details the synergy with digital financial services and the informal e-commerce sector. The slide can serve to inform investment decisions and digital transformation strategies, particularly in fintech and retail sectors.
E-commerce, GMV, DFS, Growth
Mixed Chart
Bain
Saved
Features a map of the UK with key points listed about market growth, emphasizing the UK's strengths such as regulatory environment and London as a financial centre.
Market Analysis and Trends
Financial Services
The slide argues for the strategic timing of expanding financial operations in the UK, emphasizing national economic resilience, strong regulatory frameworks, and London’s role as a global financial hub, supporting a strategic business decision for market expansion.
UK Market, Growth, Strategy, Financial Hub
Graphic
Barclays
Saved
This slide is designed with bar charts and data comparisons, showing the usage of mental health resources between Gen Z and Millennials. It utilizes a clear, professional layout with distinct color coding to differentiate between the groups.
Market Analysis and Trends
Professional Services
Focuses on the underutilization of workplace mental health resources among Gen Z and Millennials, emphasizing the gap between offerings and actual usage.
mental health, Gen Z, Millennials, workplace support, resource gap, utilization
Multiple Chart
Deloitte
Saved
Features a complex multivariate graph detailing the supply and demand dynamics in the drybulk market over several decades, with contextual annotations.
Market Analysis and Trends
Transportation & Logistics
Provides a comprehensive analysis of the historical and recent trends in the drybulk shipping market, focusing on fleet growth, trade growth, and market fluctuations.
drybulk shipping, market analysis, supply and demand, economic trends
Single Chart
Deutsche Bank
Saved
The slide features a scatter plot with annotations for various transportation authorities like MTA, WMATA, etc., showing trends in annual ridership versus year-over-year growth rates, using different colored circles to represent each entity.
Market Analysis and Trends
Transportation & Logistics
This slide analyzes trends in bus ridership across different systems, comparing annual ridership rates and growth, highlighting how entities like MTA and others are performing. Useful for assessing transportation trends and planning.
transit, ridership, trends, comparison, analysis, bus, MTA, growth, decline
Single Chart
BCG
Saved
This slide includes a header and a column chart. The charts compare employees' preferences for working remotely or in a hybrid setting against their expectations of what their employers will likely implement.
Technology and Digital Transformation
Technology & Software
Analyzes current trends and future expectations regarding hybrid and remote work arrangements, reflecting a strong preference for flexibility in work locations among employees, contrasted with their anticipation of employer policies.
hybrid working, remote work, employee preferences, employer expectations
Single Chart
PwC/Strategy&
Saved
This slide provides a detailed breakdown of strategic priorities along Australia's battery value chain from mining to recycling. It uses color-coded sections and icons to highlight specific areas such as mining, refining, active materials, and cell manufacturing, with bullet points detailing strategic actions for each segment. The layout is comprehensive and strategically organized to convey complex information in a structured manner.
Competitive Landscape
Energy & Utilities
Discusses how Australia can enhance its end-to-end capabilities in the battery value chain, focusing on leveraging its rich mineral resources and strengthening manufacturing and recycling.
strategic priorities, battery value chain, Australia, mining, refining, manufacturing, recycling, global market, value chain enhancement, resource management
Linear Flow
Accenture
Saved
Bar graphs contrasting the gross margins of private label and branded products, accompanied by distributor case studies.
Financial Performance
Financial Services
This slide highlights how an emphasis on private label products can lead to significantly higher gross margins in distribution businesses.
gross margins, private label, branded products, distribution, profitability, case studies
Single Chart
EY
Saved
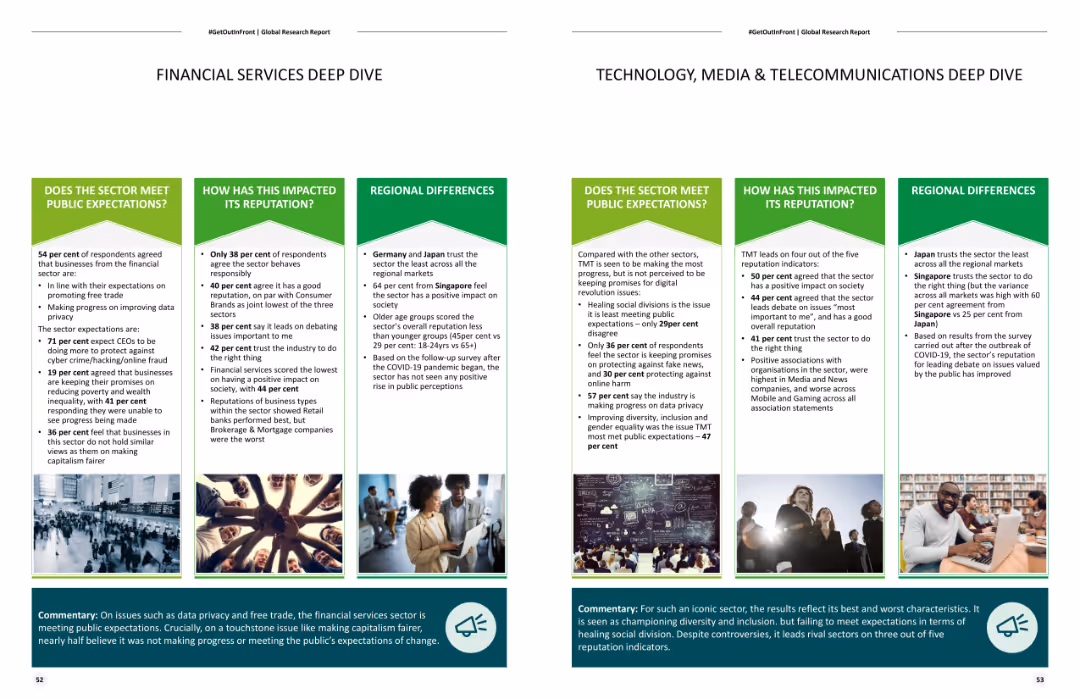
Contains detailed content and images on the public expectations and reputation impacts for the financial and TMT sectors, along with regional differences.
Industry Overview
Financial Services
Provides an in-depth analysis of the financial and TMT sectors, focusing on public expectations, reputation impacts, and regional differences in trust and perceptions.
Financial services, TMT sector, public expectations, reputation, regional differences
Header Horizontal
Deloitte
Saved
Previous
Next
If nothing, comes up, please save your slides first
Create a FREE account to continue browsing
Receive Instant Access to 1,000+ slides from companies like McKinsey, Google, and Goldman Sachs
First Name
Last Name
Email
Password
I agree to all
Terms & Privacy Policy
Thank you! Your submission has been received!
Oops! Something went wrong while submitting the form.
Have an account?
Sign in
Column Chart
Heatmap
Chevron
Org Chart
Infographic
Callouts
Timeline
List
Graphic
Picture
Process Flow
Diagram
Paragraph
Map
Table
Framework
Subtitle
Takeaway Box
Icon
Other Chart
Radar Chart
Waterfall Chart
Mekko Chart
Pie Chart
Scatter Plot
Line Chart
Bar chart
Bullet points