My Account
My Slides
Search by Category
Templates
Leave Feedback
Login
Logout
Get Started
Browse all Slides
Browse all Slides
Create a FREE Account
Instant access to 1,000+ real slides from top companies like McKinsey, BCG, Goldman Sachs, Google and many more!
First Name
Last Name
Email
Password
I agree to all
Terms & Privacy Policy
Thank you! Your submission has been received!
Oops! Something went wrong while submitting the form.
Have an account?
Sign in
Saved Slides
Contains column charts and tables. Blue shades differentiate between Private, Corporate, and Investment Banks. Dense with numerical data.
Financial Performance
Financial Services
Analyzes credit loss provisions and stage 3 loans across different banking segments over several quarters. Used for financial analysis.
Credit losses, stage 3 loans, banking, financial data, provisions, coverage ratios, amortized cost, investment calls
Multiple Chart
Deutsche Bank
Saved
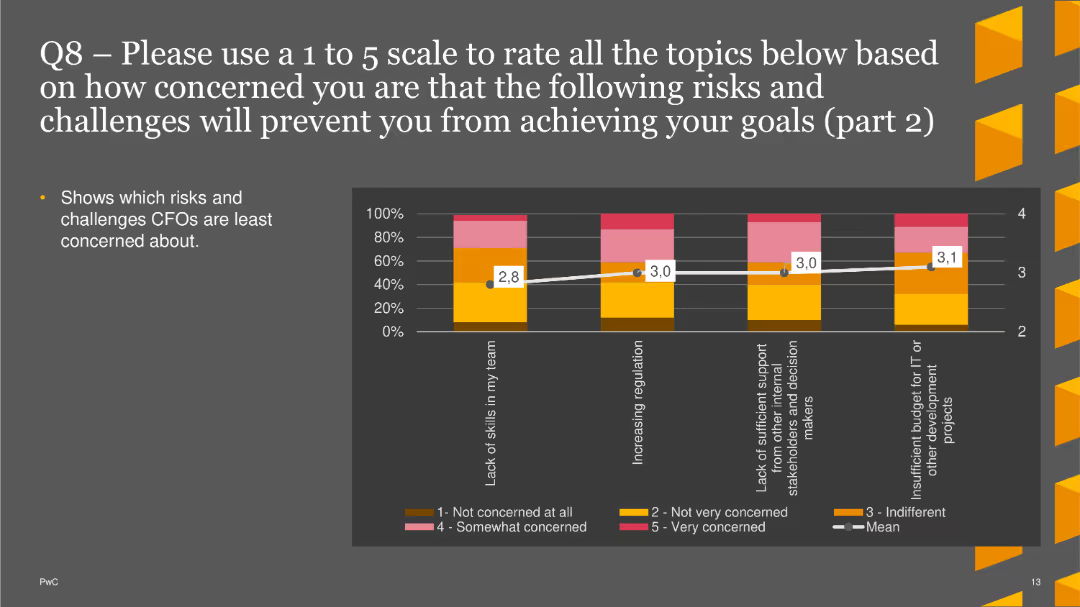
A column chart showing concern levels about various risks. The bars are vertical, with colors representing different levels of concern and mean scores marked
Risk Assessment and Management
Financial Services
This slide shows part 2 of the survey results about CFO concerns on risks such as lack of skills and increasing regulation.
risk assessment, CFO concerns, skills, regulation, survey results
Single Chart
PwC/Strategy&
Saved
The slide contains pie charts showing the distribution of assets within the firm across different channels, using shades of blue and text annotations.
Operational Efficiency
Financial Services
Meant to illustrate how a firm manages and distributes its assets, highlighting the operational structure of asset management and wealth management.
Asset Distribution, Operational Structure, Asset Management, Wealth Management, Fee-Earning, Total Assets
Multiple Chart
Goldman Sachs
Saved
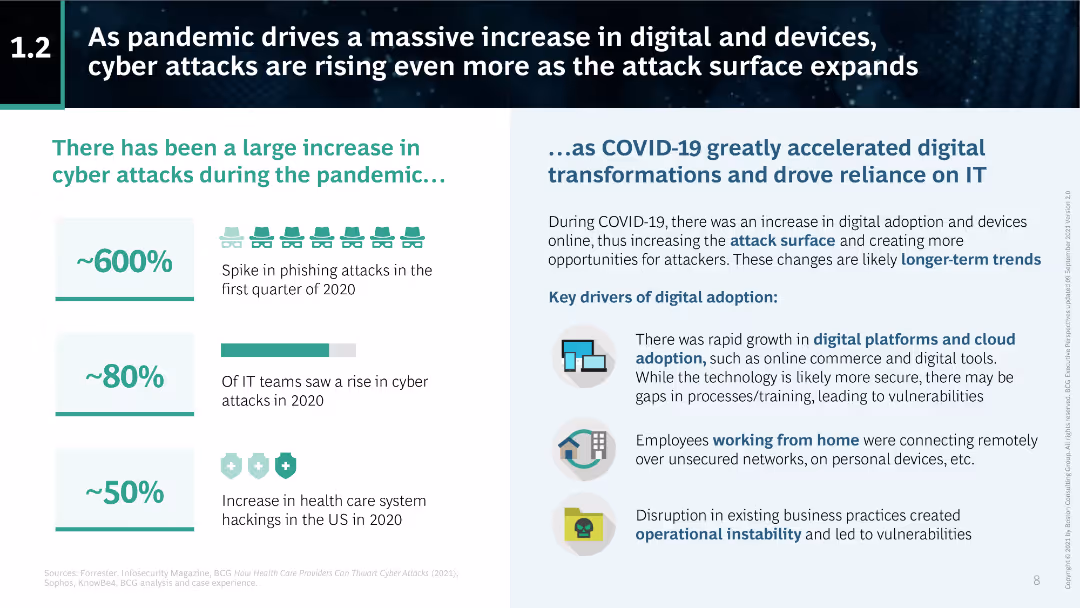
The slide includes several statistics and icons highlighting the increase in cyber attacks during the pandemic and the drivers of digital adoption.
Risk Assessment and Management
Technology & Software
This slide explains the rise in cyber attacks during the COVID-19 pandemic, citing a 600% increase in phishing attacks and an 80% rise in cyber attacks on IT teams. It also discusses key drivers of digital adoption.
pandemic, digital adoption, cyber attacks, COVID-19, phishing, IT security, statistics, cybersecurity, BCG
Boxed
BCG
Saved
Contains a column chart highlighting the CAGR for consumer E&M revenue from 2019 to 2024 across multiple countries, with India and Nigeria prominently displayed in red to emphasize their lead. This visual arrangement facilitates quick comparison and trend recognition.
Market Analysis and Trends
Media & Entertainment
This slide underlines the significant growth of consumer E&M revenue in India compared to other global markets, emphasizing India's emerging market status and potential as a primary target for E&M investments. It's particularly useful for stakeholders looking to expand in high-growth regions, offering a strategic overview of promising markets.
consumer revenue, CAGR, India, market growth
Mixed Chart
PwC/Strategy&
Saved
Vertical bar charts compare the main factors of concern for EV charging at public facilities in different regions, using distinct colors for each factor.
Market Analysis and Trends
Transportation & Logistics
This slide covers key issues like charging costs and long wait times at public charging facilities, showing how these concerns vary globally.
Public EV charging, costs, waiting times, regional concerns, charging facilities
Multiple Chart
EY
Saved
A photo of Cologne Cathedral with a graph showing Germany's GDP growth and a detailed text explanation.
Market Analysis and Trends
Financial Services
This slide discusses Germany's economic conditions, highlighting GDP growth trends and the impact of COVID-19 on the economy.
Germany, GDP growth, economy, financial services, market analysis
Multiple Chart
Deloitte
Saved
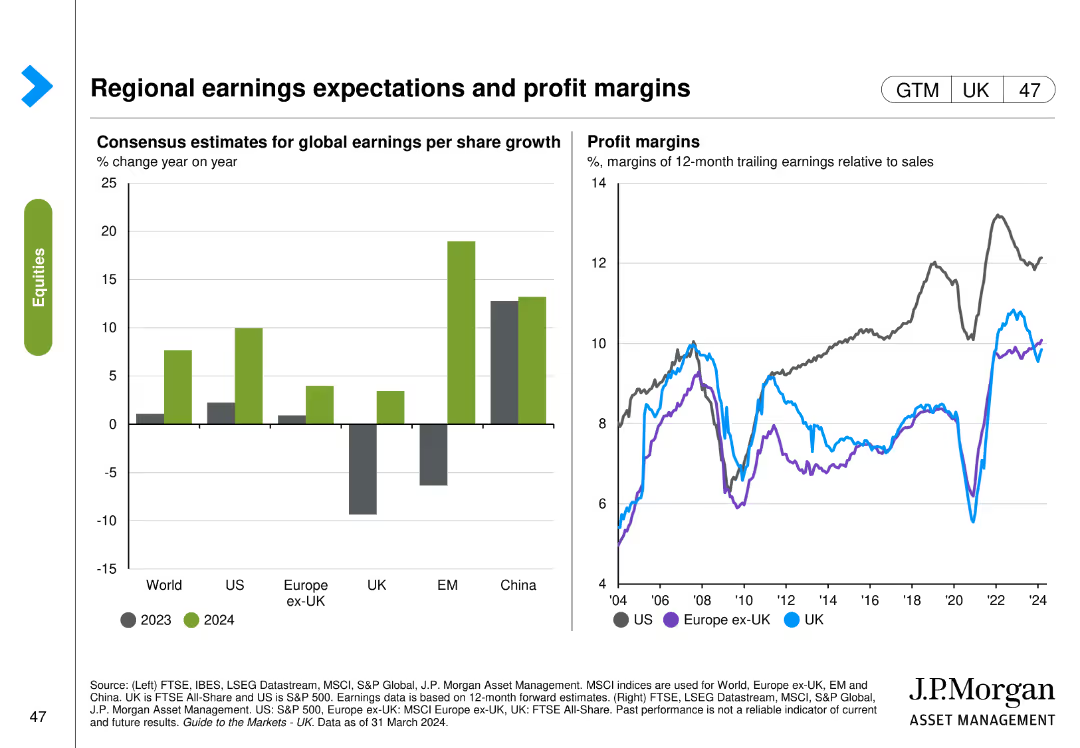
Two charts: one column chart shows consensus estimates for global earnings per share growth across regions, and one line chart shows profit margins over time.
Market Analysis and Trends
Financial Services
This slide provides insights into regional earnings expectations and profit margins, comparing various regions like US, Europe, and China.
Earnings, profit margins, regions, US, Europe, China
Multiple Chart
JP Morgan
Saved
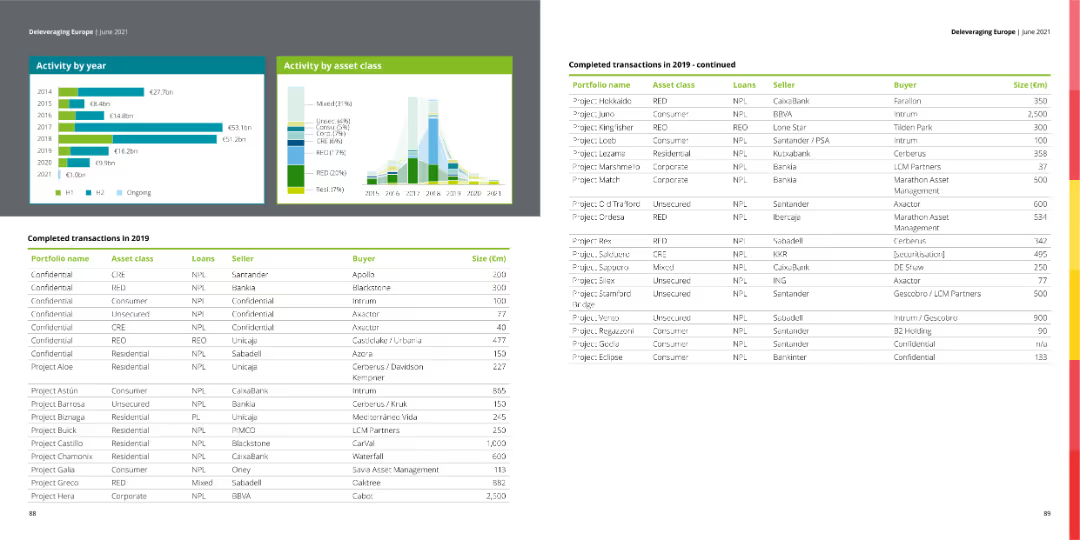
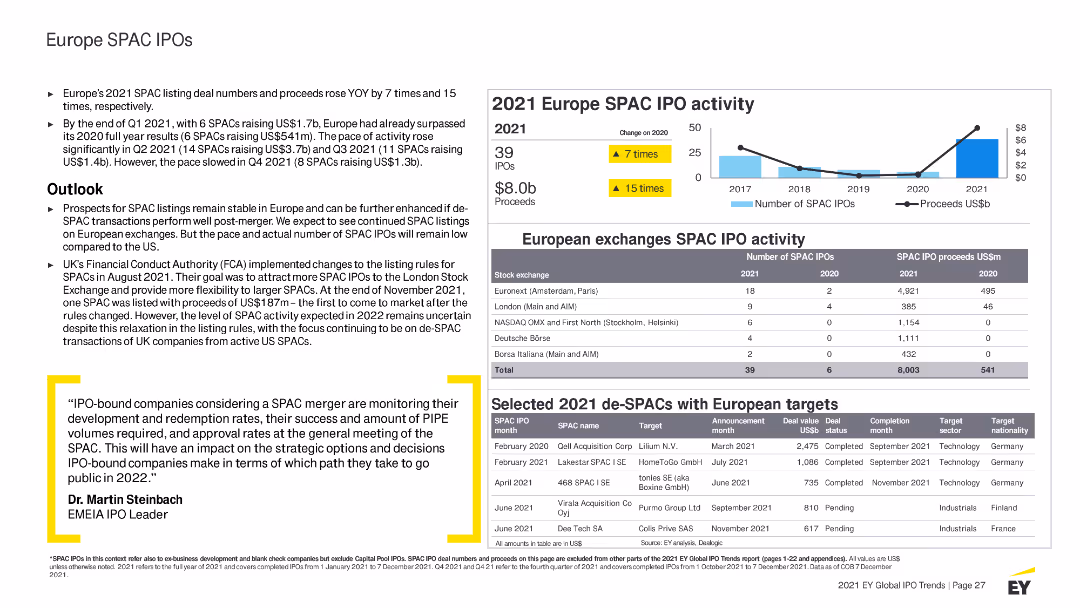
Features column charts, tables, and bullet points with highlighted statistics. Uses blue and yellow colors to indicate different SPAC activities and trends.
Market Analysis and Trends
Financial Services
Summarizes SPAC IPO activities in Europe for 2021, detailing trends, major SPAC IPOs by region and sector, and outlook for SPAC activities in Europe.
Europe, SPAC, IPO, 2021 activity, market highlights, trends, sectors, performance, outlook, stock exchanges, regulations
Mixed Chart
EY
Saved
The slide presents a table with credit loss expenses and a column chart showing ECL coverage ratios. It uses a structured layout with clear data segmentation.
Financial Performance
Financial Services
It details credit loss expenses and impaired exposures, providing figures by business segment and the evolution of ECL coverage ratios over time.
credit loss, expenses, impaired, ECL, ratios, exposures, UBS, 2Q23, financial, release
Mixed Chart
UBS
Saved
The slide contains two column charts showing yearly and quarterly assets under management (AuM) development and a set of pie charts detailing asset class distributions for different quarters.
Investment Analysis
Financial Services
Provides detailed analysis of asset management growth through net flows, market performance, and fee margins, alongside the composition of assets under management segmented by class, aiding strategic investment decisions.
AuM, asset management, growth analysis, asset class distribution, market performance
Multiple Chart
Deutsche Bank
Saved
Contains a regional breakdown of banking operations in Latin America with performance highlights, using icons and a table format to detail country-specific operations.
Financial Performance
Financial Services
Reviews the profitability of banking operations across Latin America, highlighting key markets and strategic positions in retail and wholesale banking sectors.
Latin America, banking, profitability, operations, strategy
Table
Barclays
Saved
Contains three sections labeled "Eaton Past," "Eaton Today," and "Eaton Future," each with images depicting each era's focus on technology and digital solutions.
Strategic Planning
Technology & Software
Discusses Eaton's strategic transition from a vehicle component manufacturer to a focus on power management and future digital solutions.
Eaton, strategy, growth, technology, digital solutions
Header Horizontal
Deutsche Bank
Saved
The slide includes a column chart showing daily crew rates for vessels carrying domestic cargoes, comparing internationally and Australian flagged vessels before and after the Coastal Trading Act 2012.
Regulatory and Compliance
Transportation & Logistics
It examines how cabotage regulations have increased coastal shipping costs for the cement industry in Australia, comparing costs before and after the Coastal Trading Act 2012 and highlighting cost implications.
cabotage, coastal shipping, cement industry, Australia, Coastal Trading Act
Mixed Chart
LEK
Saved
Features bar charts and text highlighting factors affecting workplace satisfaction and motivation.
Human Resources and Talent Management
Professional Services
Analyzes key factors affecting employee motivation and workplace culture, useful for enhancing organizational culture and HR policies.
Employee Motivation, Workplace Culture, Job Satisfaction, Organizational Culture, HR Policies
Single Chart
PwC/Strategy&
Saved
Features green-colored blocks outlining the rationale and questions to consider for creating value through M&A. It emphasizes traditional and forward-looking synergies like revenue and cost efficiencies, risk mitigation, and knowledge generation.
Strategic Planning
Financial Services
Provides a strategic framework for evaluating M&A opportunities, focusing on identifying synergies, assessing risks, and understanding cost benefits to maximize deal value.
M&A, Value Creation, Synergies, Strategy, Risk Mitigation, Cost Efficiency
Table
Deloitte
Saved
The slide contains a combination of bar graphs, column charts, and textual information, showcasing financial stability through various metrics like deposits and capital ratios.
Financial Performance
Financial Services
Intended to convey the strong financial position and liquidity of the company, the slide serves as an assurance of stability and strength in various market conditions.
balance sheet, financial stability, liquidity, capital ratio, deposits, fortress principle, strength, market conditions
Multiple Chart
JP Morgan
Saved
Similar to slide 1491, displays three sets of vertical column charts, showing percentages of digital merchants' expected use of various services in Malaysia.
Market Analysis and Trends
Financial Services
Analyses the reliance on digital platforms among Malaysian digital merchants, with predictions for increasing technological integration.
Malaysia, Digital Merchants, Tech-Savvy, Digital Platforms, Financial Services, Future Trends
Multiple Chart
Bain
Saved
A central hexagon labeled "Engineering-centric organization" with arrows pointing to roles like CTO, CPO.
Organizational Structure and Change
Financial Services
Describes the roles and responsibilities within an engineering-centric organization, emphasizing transformation and execution.
organizational structure, transformation, engineering, roles, responsibilities
Diagram
Credit Suisse
Saved
The slide features a column chart with five vertical bars representing different financial metrics from 4Q19 to 1Q20, showing an 8% increase overall.
Financial Performance
Financial Services
The slide shows the progression of tangible book value per share from 4Q19 to 1Q20, highlighting net profit and other contributions to the value.
tangible book value, financial metrics, net profit, OCI, quarterly data
Single Chart
UBS
Saved
Slide displays two line graphs comparing S&P 500 returns with dividend inclusion and equity index returns versus volatility.
Investment Analysis
Financial Services
Provides strategies for outperforming the broad market by focusing on consistent dividend growth and stock selection within growing industries.
dividend growth, stock selection, S&P 500, market outperformance, investment strategies
Multiple Chart
Citigroup
Saved
A column chart showing enrollment share of private K-12 education in major markets, segmented by region.
Market Analysis and Trends
Education & Training
Discusses the trend of privatization in K-12 education across major markets and its growth between 2015 and 2019.
privatization, K-12, education, enrollment, markets
Single Chart
LEK
Saved
The slide features a column chart with annotations, and two iconographic bullet points. Red and grey are the primary colors used in the graphics.
Financial Performance
Financial Services
The slide outlines Leonardo's ESG-linked financial sources, including transactions and key performance indicators aligned with the company's strategy and long-term plans. It emphasizes sustainability in finance.
ESG, finance, sustainability, KPI, funding, credit facility, term loan, CO2 emissions reduction, STEM employment
Mixed Chart
Goldman Sachs
Saved
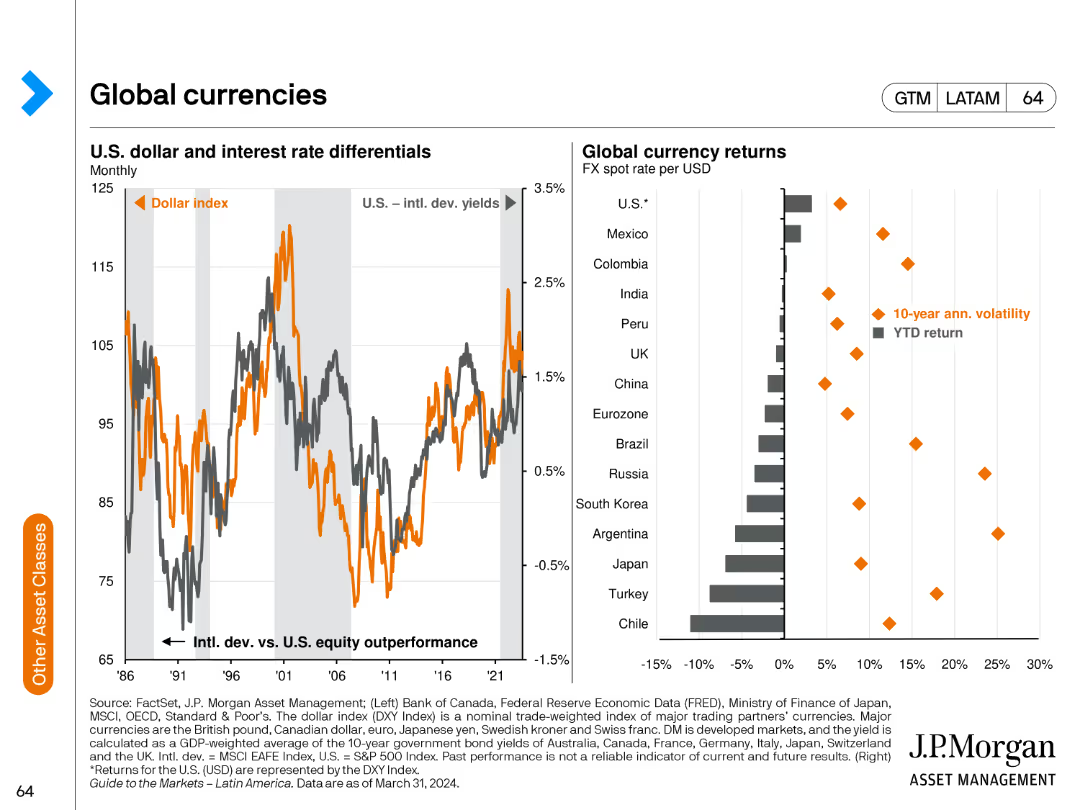
The slide features a line chart showing the U.S. dollar and interest rate differentials and a bar chart comparing global currency returns and their volatility.
Market Analysis and Trends
Financial Services
This slide analyzes the performance of global currencies, focusing on the U.S. dollar's performance relative to interest rate differentials and comparing returns and volatility across different currencies.
global currencies, USD, interest rates, returns, volatility
Multiple Chart
JP Morgan
Saved
A column chart showing the percentage of companies with tech-fluent C-suite and board members. Text elaborates on the importance of tech-savvy leadership in addressing business challenges.
Organizational Structure and Change
Technology & Software
The slide emphasizes the significance of having tech-fluent leadership in the C-suite and board, supported by a column chart comparing tech mindset metrics.
Tech Mindset, Leadership, C-suite, Board, Business Challenges
Mixed Chart
Accenture
Saved
Previous
Next
If nothing, comes up, please save your slides first
Create a FREE account to continue browsing
Receive Instant Access to 1,000+ slides from companies like McKinsey, Google, and Goldman Sachs
First Name
Last Name
Email
Password
I agree to all
Terms & Privacy Policy
Thank you! Your submission has been received!
Oops! Something went wrong while submitting the form.
Have an account?
Sign in
Column Chart
Heatmap
Chevron
Org Chart
Infographic
Callouts
Timeline
List
Graphic
Picture
Process Flow
Diagram
Paragraph
Map
Table
Framework
Subtitle
Takeaway Box
Icon
Other Chart
Radar Chart
Waterfall Chart
Mekko Chart
Pie Chart
Scatter Plot
Line Chart
Bar chart
Bullet points