My Account
My Slides
Search by Category
Templates
Leave Feedback
Login
Logout
Get Started
Browse all Slides
Browse all Slides
Create a FREE Account
Instant access to 1,000+ real slides from top companies like McKinsey, BCG, Goldman Sachs, Google and many more!
First Name
Last Name
Email
Password
I agree to all
Terms & Privacy Policy
Thank you! Your submission has been received!
Oops! Something went wrong while submitting the form.
Have an account?
Sign in
Saved Slides
This slide is data-driven, containing three separate graphs: two bar graphs and one pie chart. It has a clear, concise layout with annotations and a side panel with textual information about Kredivo's services.
Customer and Market Segmentation
Financial Services
The slide presents growth metrics for a lending company, Kredivo, focusing on the expansion in non-tier 1 cities. It highlights the increase in loan disbursement, user activation, and transaction frequency.
Lending, Growth, Non-Tier 1 Cities, Kredivo, Loan Disbursement, User Activation, Transaction Frequency
Multiple Chart
Kearney
Saved
Line graph showing the impact on EBITDA over time, comparing high performing transformations to median results.
Financial Performance
Financial Services
Evaluates the financial impact of high performing transformations on EBITDA over time.
EBITDA, financial, transformation, impact, performance
Single Chart
McKinsey
Saved
Features column charts showing the growth of loans originated and deposits, with a side bar detailing key attributes of the Marcus platform. The design is clean, with visual emphasis on data points.
Product and Service Analysis
Financial Services
Highlights the performance of Marcus, a consumer lending platform, with emphasis on technology, risk management, and growth since its inception, as well as customer-friendly features and deposit growth.
Marcus, Consumer Lending, Technology, Risk Management, Growth, Deposits, Loans Originated, Customer Experience, NerdWallet
Multiple Chart
Goldman Sachs
Saved
The slide displays a structured path divided into organizational and technical steps from nascent to multi-moment stages of digital marketing maturity.
Strategic Planning
Professional Services
Outlines steps for brands to achieve digital maturity, emphasizing the importance of integrating data and fostering an agile, data-driven culture.
digital maturity, strategy, marketing, path, integration, data, agility, brand development
Linear Flow
BCG
Saved
A slide with bar graphs and circular statistics to illustrate the experiences of women in hybrid working environments and how they vary by organizational culture.
Operational Efficiency
Professional Services
Emphasizes how Gender Equality Leaders create better hybrid working experiences, valuable for discussions on hybrid workplace models and inclusive culture development.
hybrid work, gender equality, culture, experience
Multiple Chart
Deloitte
Saved
Diagram depicting a six-element framework for transforming ad sales, including enhancing creative development and managing multi-platform inventory. Icons and labels explain each element.
Strategic Planning
Media & Entertainment
Presents a comprehensive framework for transforming advertising sales, focusing on six strategic areas to enhance scalability, intimacy, and revenue growth through technology.
Advertising, Transformation, Strategy, Framework, Sales Enhancement, Multi-platform Management, Revenue Growth
Framework
Accenture
Saved
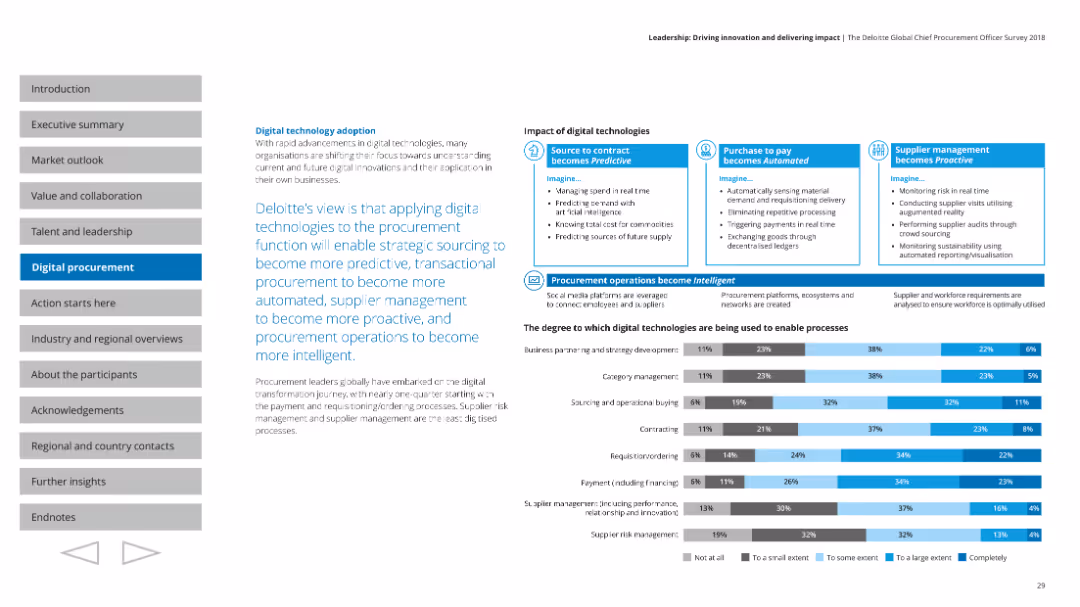
Contains a combination of charts and descriptive text blocks, highlighting the impact of digital technologies on procurement processes and strategies.
Technology and Digital Transformation
Professional Services
Describes the role of digital technologies in transforming procurement functions, making them more predictive, automated, and proactive.
Digital adoption, procurement, strategy, technology impact
Mixed Chart
Deloitte
Saved
The slide includes a bar chart and text boxes summarizing key balance sheet figures, with a specific focus on Credit Suisse assets and liabilities.
Financial Performance
Financial Services
It provides an overview of the balance sheet for 2Q23, detailing assets and liabilities, and highlights the contribution of Credit Suisse.
balance sheet, assets, liabilities, Credit Suisse, UBS, 2Q23, financial, coverage ratio, figures
Multiple Chart
UBS
Saved
Contains a comparative analysis layout, contrasting traditional IPO processes with SPAC merger processes using a timeline format.
Strategic Planning
Financial Services
Compares traditional IPO and SPAC timelines, highlighting the efficiencies and shorter timelines associated with SPACs.
IPO, SPAC, timeline, traditional, comparison, process, planning
Linear Flow
PwC/Strategy&
Saved
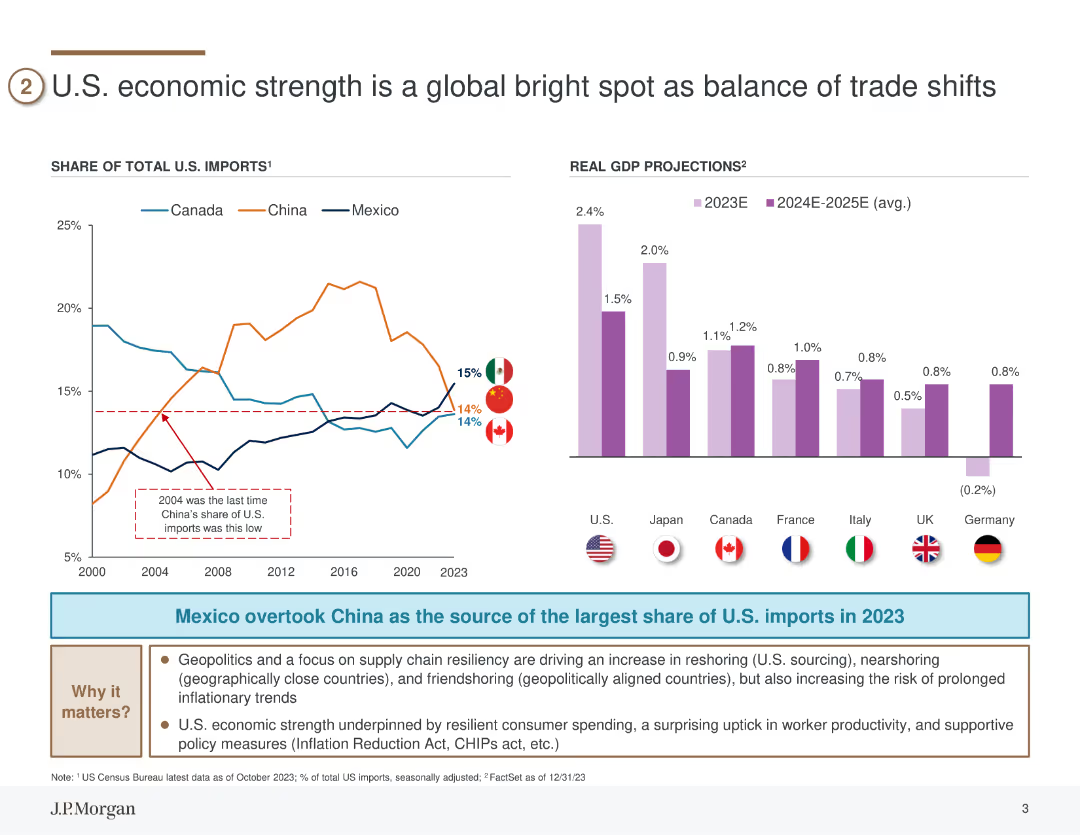
This slide contains a line chart showing the share of total U.S. imports from Canada, China, and Mexico, alongside a column chart with real GDP projections for various countries.
Market Analysis and Trends
Financial Services
The slide compares the U.S. import shares from major trading partners and projects GDP growth for 2023 and 2024-2025 for the U.S. and other countries. It emphasizes Mexico overtaking China as the largest source of U.S. imports and presents the U.S. economic strength as a key global player amidst shifting trade balances. This slide can be used for global economic analysis and forecasting.
imports, GDP, Mexico, China, trade shifts
Multiple Chart
JP Morgan
Saved
A large column chart displays the growth of Indonesia’s internet economy, with projections to 2025. A smaller line graph shows the Compound Annual Growth Rate (CAGR).
Market Analysis and Trends
Technology & Software
Shows Indonesia's growing internet economy with projections suggesting robust future growth, symbolizing a positive economic outlook.
Indonesia, Internet Economy, Growth, Projection, CAGR, Optimism, $70B, 2025
Single Chart
Bain
Saved
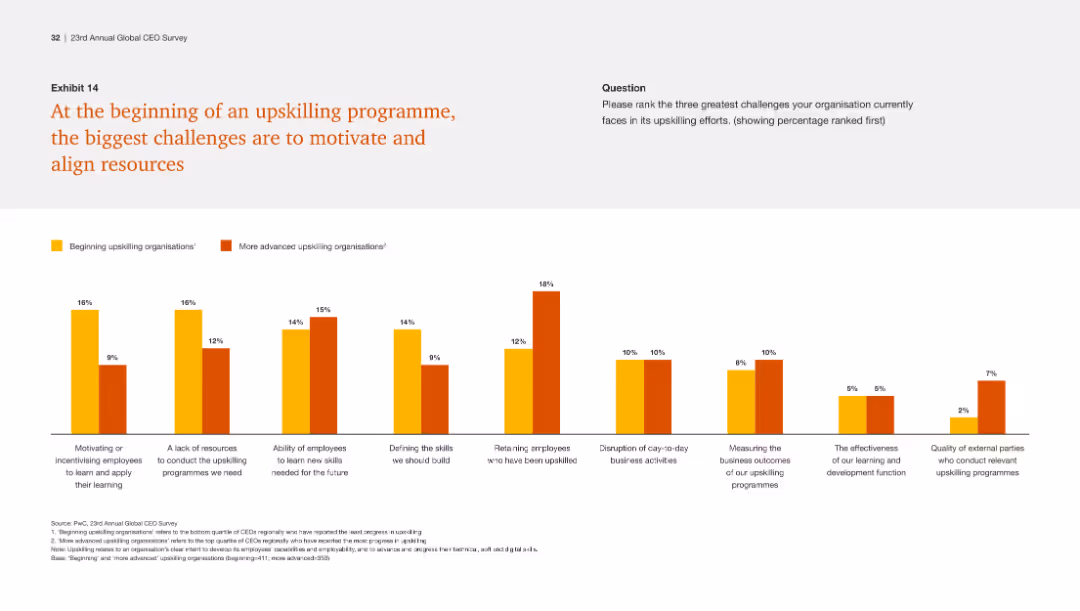
This slide includes a column chart comparing challenges faced by beginning and advanced upskilling organizations, with bars representing different challenges and their severity.
Human Resources and Talent Management
Professional Services
The slide discusses the primary challenges in initiating upskilling programs, including motivating employees, resource limitations, and aligning efforts.
Upskilling challenges, motivation, resource alignment, employee engagement, program initiation
Single Chart
PwC/Strategy&
Saved
Features a heat map table categorizing various asset classes and their respective returns over the years, color-coded to indicate performance levels.
Investment Analysis
Financial Services
The slide breaks down historical returns by asset class, serving as a tool for retrospective analysis and guiding future investment decisions based on past performance.
asset class, return analysis, heat map, historical data, investment, performance
Table
Morgan Stanley
Saved
With a blue theme, this slide has two main columns comparing common issues with best practices in hiring, accompanied by related icons and labeled sections.
Human Resources and Talent Management
Technology & Software
It advocates for a seamless hiring process to ensure a positive candidate experience, targeting HR teams and recruitment strategies.
hiring process, candidate experience, HR, recruitment, best practices, common issues
Header Horizontal
Kearney
Saved
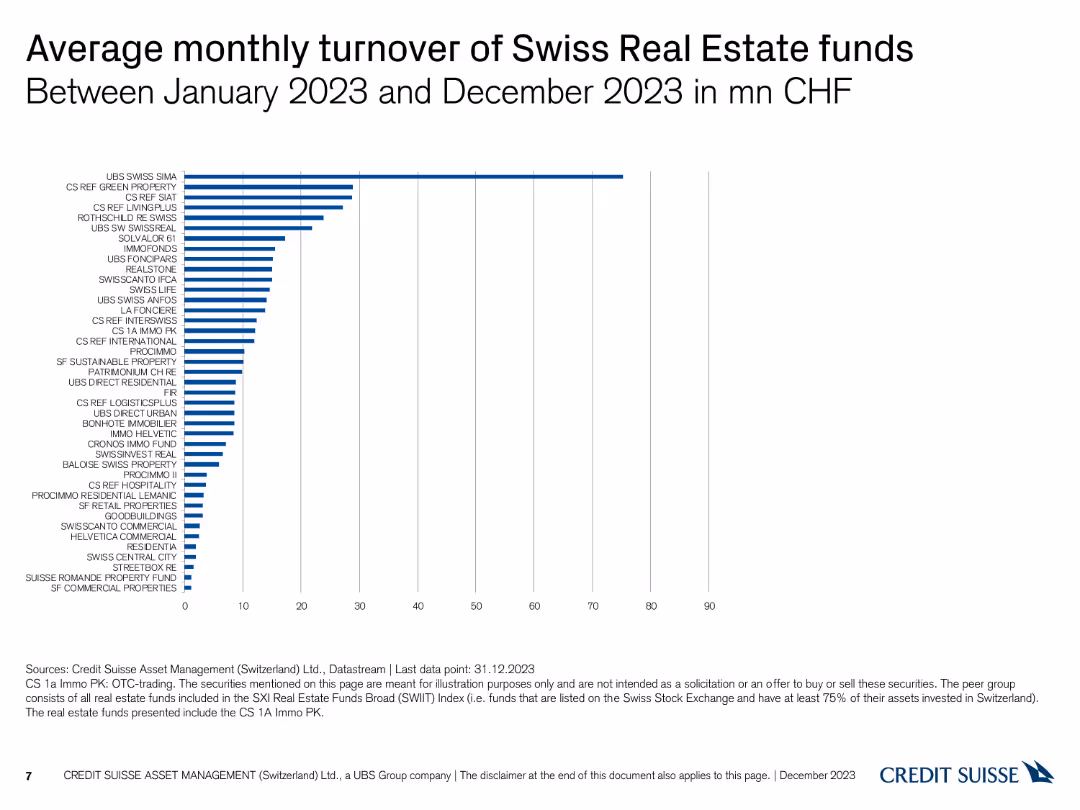
A column chart showing the average monthly turnover (in million CHF) of various Swiss real estate funds from January 2023 to December 2023.
Financial Performance
Financial Services
This slide details the average monthly turnover of Swiss real estate funds over the course of 2023, comparing the performance of different funds.
Monthly Turnover, Real Estate Funds, Performance, 2023
Single Chart
Credit Suisse
Saved
The slide includes pie and a table with labels. The pie chart divides participants by economic sector (B2B Product, B2B Services, B2C Product, B2C Services), while the column chart segments them by industry, illustrating the diversity of the survey participants.
Market Analysis and Trends
Professional Services
This slide provides a breakdown of survey participants by economic and industry sectors, highlighting the representation across various fields. It is useful for understanding the demographic spread of the survey, which can influence the interpretation of its results.
Survey, Participants, Demographics, Industry Sectors, Economic Sectors
Mixed Chart
Deloitte
Saved
The slide contains multiple text boxes with headers and bullet points, contrasting 'Talent resignation' and 'Talent retrenchment', and providing key considerations for the company on the right.
Human Resources and Talent Management
Professional Services
This slide compares different aspects of talent retention and exit, including resignation and retrenchment, and outlines the company's imperatives in managing these situations. It serves as an informational slide for management and HR professionals.
Resignation, Retrenchment, Talent Management, Company Strategy
Header Vertical
Kearney
Saved
Contains column charts showing the percentage of population in urban areas from 2020 to 2050 across continents, with color distinctions and clear labeling.
Market Analysis and Trends
Government & Public Sector
Predicts significant urban population increases by 2050, emphasizing urban planning needs.
urbanization, population growth, planning, 2050, global
Multiple Chart
Roland Berger
Saved
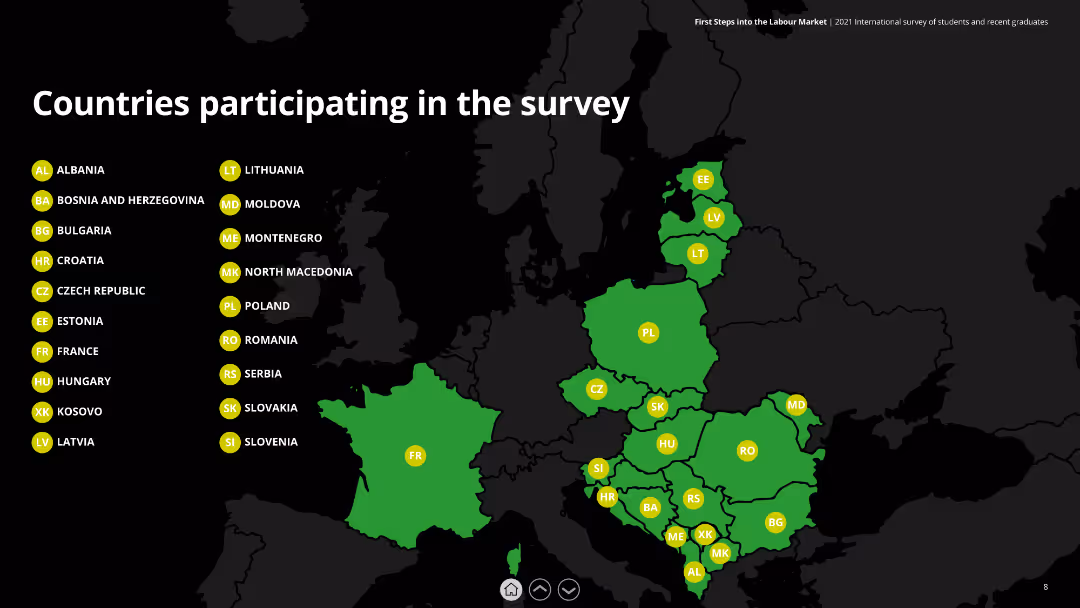
The slide features a map of Europe highlighting countries participating in the survey, with country names listed on the side.
Market Analysis and Trends
Government & Public Sector
This slide lists the countries participating in the survey, with a map highlighting the geographic distribution of survey participants.
survey, countries, Europe, participants, analysis
Graphic
Deloitte
Saved
This slide features a column chart showing asset sales, mark-ups/mark-downs, and net dispositions. The layout is simple with a significant focus on the data represented by blue columns against a grey backdrop with green accent lines.
Risk Assessment and Management
Financial Services
Highlights the progress in asset sales and balance sheet management over a period. It can be used to inform stakeholders of risk management and asset optimization strategies.
Asset Sales, Equity Investments, Balance Sheet
Single Chart
Goldman Sachs
Saved
The slide has a green theme with text and icons outlining a three-step approach to leveraging tech and digital to build resilience and start transformation.
Strategic Planning
Technology & Software
This slide emphasizes the urgency of acting now by understanding resilience starting points, acting on tech levers, and planning the transformation.
tech, digital, resilience, transformation, urgency
Vertical Flow
BCG
Saved
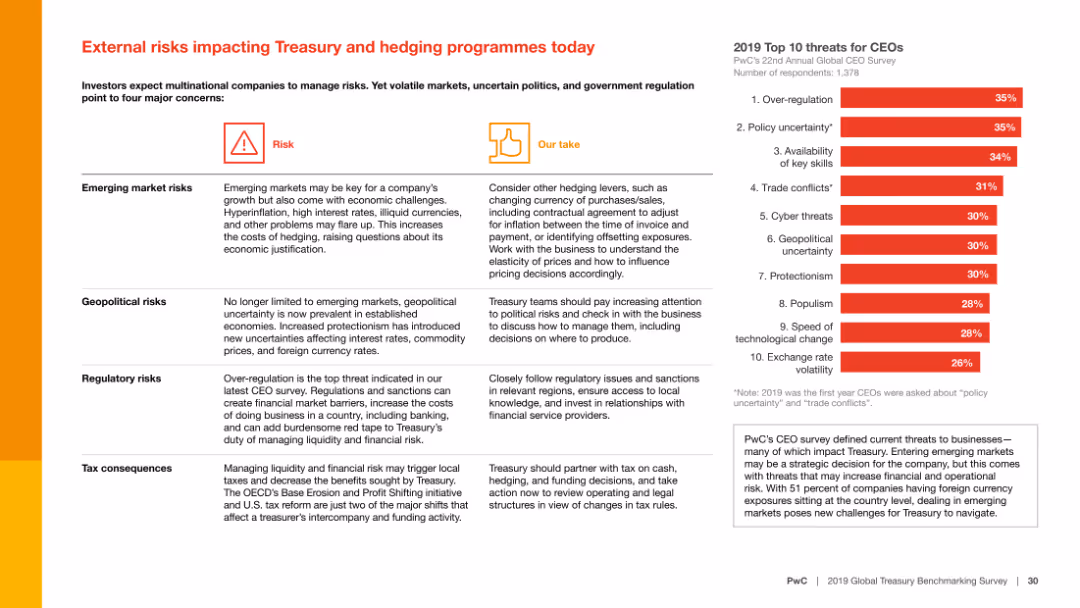
The slide contains text with a summary of external risks such as emerging market risks, geopolitical risks, regulatory risks, and tax consequences, alongside a column chart showing the top 10 threats for CEOs.
Risk Assessment and Management
Financial Services
The slide identifies major external risks impacting treasury and hedging programs, including emerging market risks and geopolitical uncertainties, and provides strategies to address these concerns.
External risks, Treasury, hedging, emerging markets, geopolitical risks, regulatory risks, tax consequences, financial services, risk management, threats for CEOs
Mixed Chart
PwC/Strategy&
Saved
Includes three column charts that show historical data alongside current metrics to illustrate the progress made since a merger. The charts depict 'Adjusted Tangible Efficiency Ratio' and 'Adjusted Return on Average Tangible Common Equity'.
Mergers and Acquisitions
Financial Services
Communicates the achievement of merger-related targets with visual emphasis on improved financial ratios. It compares the current state against past projections and against peers, underlining the success of the integration strategy in achieving operational efficiencies.
Merger, Targets, Financial Ratios, Integration, Operational Efficiency, Peer Comparison
Multiple Chart
Goldman Sachs
Saved
Slide features multiple line graphs comparing GDP growth scenarios for China, USA, Eurozone, and the world. Clean layout with distinct colors for each region.
Market Analysis and Trends
Financial Services
The slide compares projected GDP growth under a scenario where the virus is contained. It's useful for discussions on economic recovery and policy planning.
GDP, Economic growth, Virus, Containment, Forecast
Single Chart
McKinsey
Saved
This Data-Driven Slide presents Michelin’s ratings from various ESG agencies, along with distribution graphs showing the market average performance and Michelin's standing. The visual elements, including the column charts, rating icons, and color-coded tables, create a data-rich yet clear and structured presentation. It demonstrates Michelin’s strong ESG performance in an impactful and visually effective manner.
Corporate Finance and Valuation
Industrial & Manufacturing
The slide highlights Michelin’s exemplary ESG ratings, showcasing their strong performance in non-financial aspects like sustainability, compared to industry and global averages. It demonstrates their leadership and commitment to environmental and social governance, aligning with investors' and consumers' increasing focus on corporate responsibility.
ESG, sustainability, ratings, performance, Michelin, industry average, leadership, non-financial
Multiple Chart
Morgan Stanley
Saved
Previous
Next
If nothing, comes up, please save your slides first
Create a FREE account to continue browsing
Receive Instant Access to 1,000+ slides from companies like McKinsey, Google, and Goldman Sachs
First Name
Last Name
Email
Password
I agree to all
Terms & Privacy Policy
Thank you! Your submission has been received!
Oops! Something went wrong while submitting the form.
Have an account?
Sign in
Column Chart
Heatmap
Chevron
Org Chart
Infographic
Callouts
Timeline
List
Graphic
Picture
Process Flow
Diagram
Paragraph
Map
Table
Framework
Subtitle
Takeaway Box
Icon
Other Chart
Radar Chart
Waterfall Chart
Mekko Chart
Pie Chart
Scatter Plot
Line Chart
Bar chart
Bullet points