My Account
My Slides
Search by Category
Templates
Leave Feedback
Login
Logout
Get Started
Browse all Slides
Browse all Slides
Create a FREE Account
Instant access to 1,000+ real slides from top companies like McKinsey, BCG, Goldman Sachs, Google and many more!
First Name
Last Name
Email
Password
I agree to all
Terms & Privacy Policy
Thank you! Your submission has been received!
Oops! Something went wrong while submitting the form.
Have an account?
Sign in
Saved Slides
Slide with four bar charts and accompanying text blocks highlighting talent presence in various industries in Italy, colored distinctly for each sector.
Human Resources and Talent Management
Technology & Software
Discusses talent distribution across different sectors, emphasizing on the gaps and how companies might bridge these to match top-performing companies.
talent management, HR, technology, analytics, digital marketing
Multiple Chart
Bain
Saved
Features a three-part diagram in shades of purple, each part highlighting a different social impact goal (access to finance, save money, reduce debt).
Operational Efficiency
Financial Services
This slide presents Experian's mission to leverage its platform to provide social benefits, detailing goals to improve financial access, save money for consumers, and reduce debt among US consumers.
social good, financial access, consumer savings, debt reduction, Experian
Pillar
Barclays
Saved
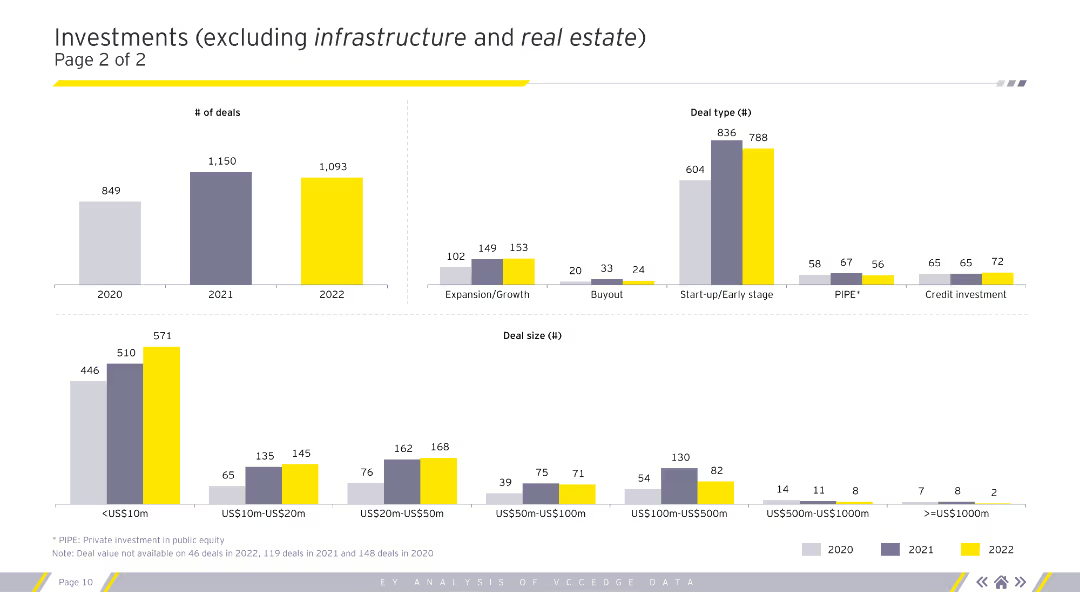
Column charts showing the number of deals, deal types, and deal sizes in various segments excluding infrastructure and real estate for 2020-2022.
Market Analysis and Trends
Financial Services
Continued analysis of investment types, sizes, and segments, excluding infrastructure and real estate.
deals, deal types, deal sizes, trends, analysis
Multiple Chart
EY
Saved
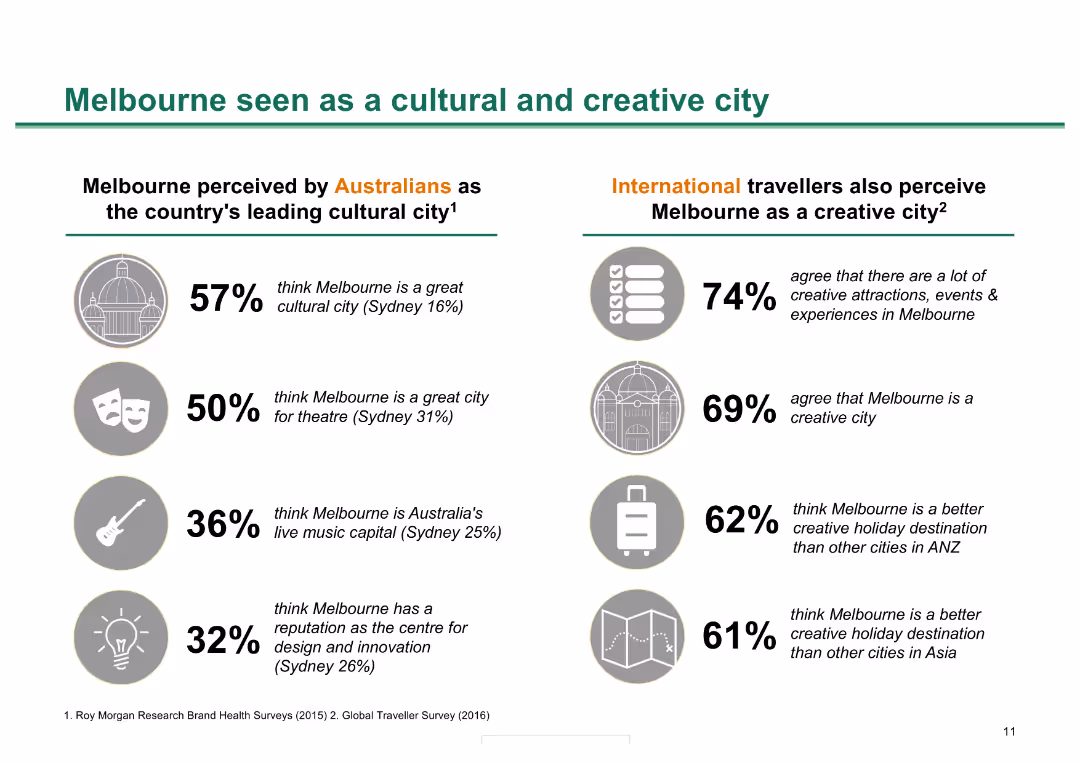
Split layout with icons and statistics comparing Australian and international perceptions of Melbourne as a cultural and creative city.
Market Analysis and Trends
Hospitality & Tourism
This slide compares perceptions of Melbourne's cultural and creative appeal among Australians and international travelers, using survey statistics and key insights.
Melbourne, cultural city, creative city, perceptions, survey, Australians, international travelers, statistics, insights
Header Horizontal
BCG
Saved
The slide uses a combination of text and circular data visualizations to show the percentage of viewers engaging with content across OTT, LTV, and Movie Studios. It uses a green and white color scheme with icons and a clear layout.
Market Analysis and Trends
Media & Entertainment
This slide compares the digital engagement rates across OTT, LTV, and Movie Studios. It highlights the high levels of engagement, with specific percentages for each vertical, indicating significant digital influence even for LTV content.
digital engagement, OTT, LTV, Movie Studios, viewer engagement, consumer survey, digital influence
Mixed Chart
BCG
Saved
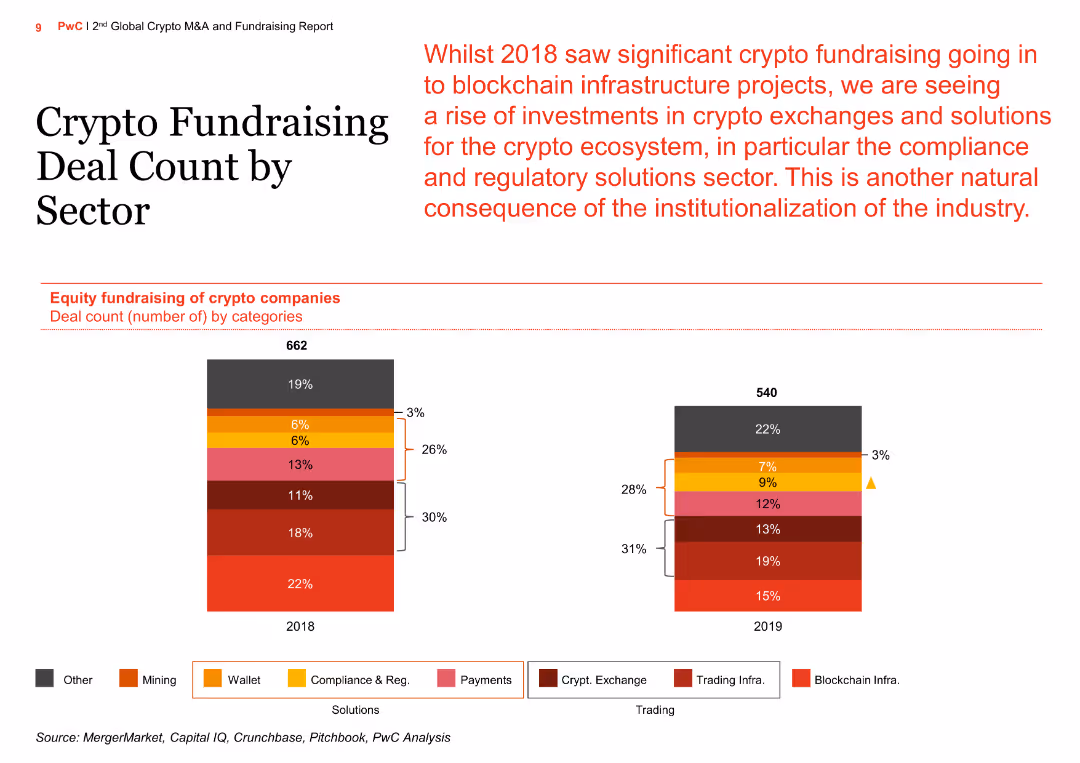
The slide features a column chart depicting the equity fundraising deal count of crypto companies across various categories for the years 2018 and 2019. It includes a stacked column chart with different colored segments representing different categories such as blockchain infrastructure, trading infra, crypto exchange, etc.
Market Analysis and Trends
Financial Services
The slide analyzes the changes in equity fundraising for crypto companies by sector from 2018 to 2019, highlighting the rise in investments in crypto exchanges and compliance and regulatory solutions, reflecting the institutionalization of the industry.
Crypto, Fundraising, Sector, Compliance, Regulatory, Exchange, Blockchain, Infrastructure, Trading, Analysis
Multiple Chart
PwC/Strategy&
Saved
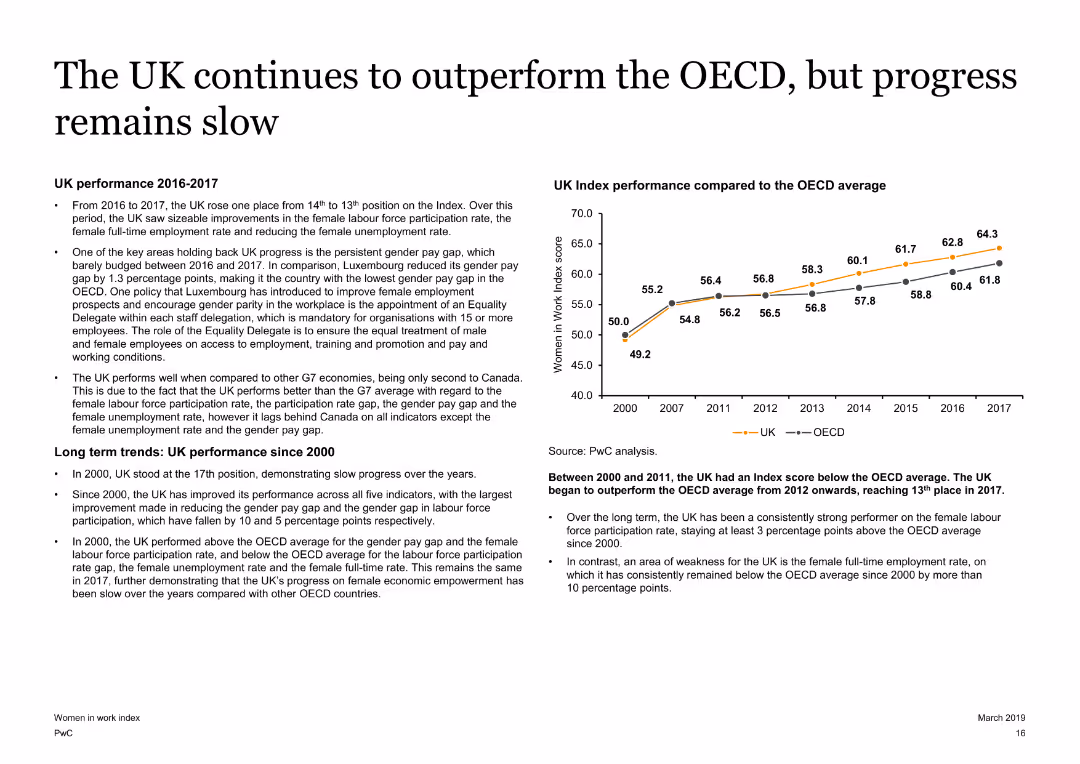
A slide with text on the left and a line chart on the right. The line chart compares the UK Index performance with the OECD average from 2000 to 2017. The slide has a moderate amount of text and visual elements.
Market Analysis and Trends
Government & Public Sector
Analyzes the UK's performance on the Women in Work Index, showing improvements over time and comparing it with the OECD average. Highlights key factors affecting progress, such as the gender pay gap and female labor force participation rates.
UK, Women in Work Index, OECD, gender pay gap, labor force participation
Mixed Chart
PwC/Strategy&
Saved
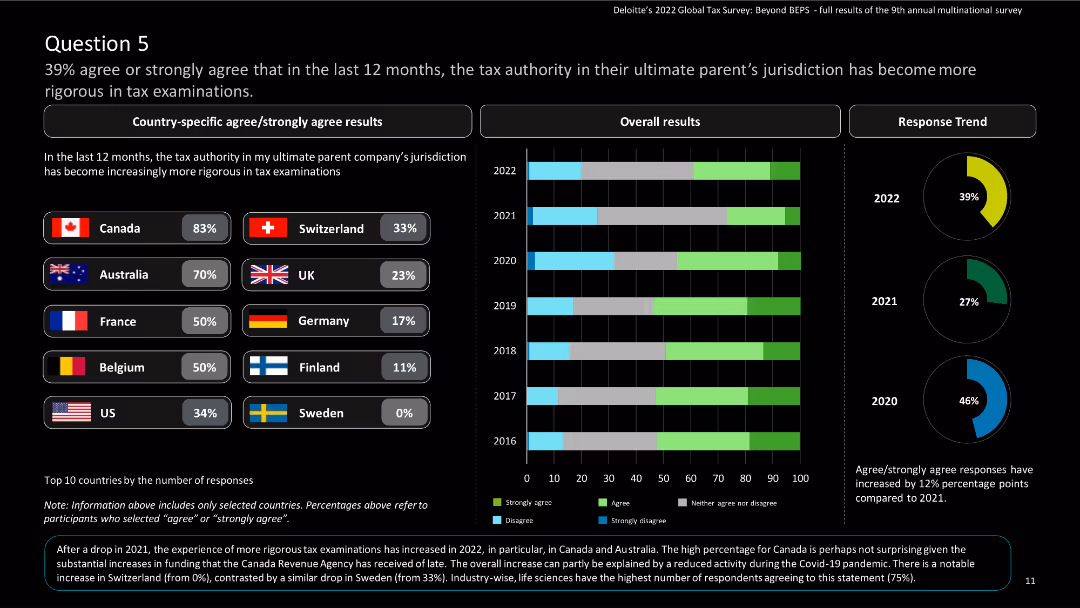
The slide features country-specific results and a column chart showing overall and response trend results over the years.
Regulatory and Compliance
Financial Services
The slide highlights the increasing rigor of tax examinations by the tax authority in the parent company’s jurisdiction.
Tax examinations, rigor, global tax, Deloitte, agree, strongly agree, survey, multinational
Multiple Chart
Deloitte
Saved
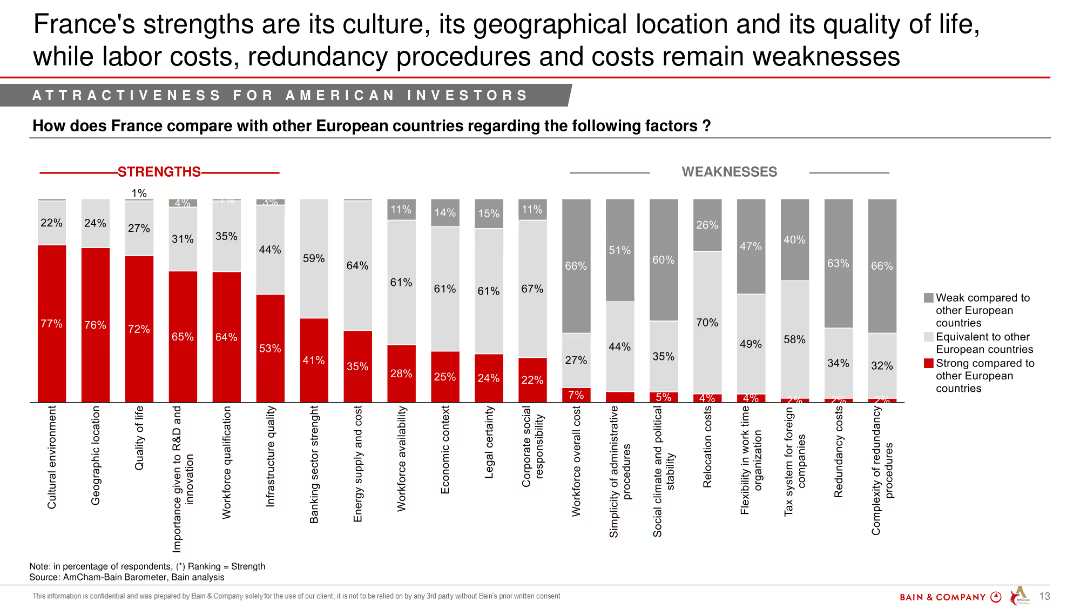
Column chart comparing strengths and weaknesses of France against other European countries across various factors like cultural environment and labor costs.
Market Analysis and Trends
Professional Services
The slide evaluates France's strengths and weaknesses in comparison to other European countries, focusing on cultural environment, geographic location, and quality of life.
strengths, weaknesses, France, comparison, Europe, cultural environment, labor costs
Single Chart
Bain
Saved
Slide with three sections of bullet points discussing the balance of opportunities and pitfalls in digital trust.
Technology and Digital Transformation
Technology & Software
Highlights how digital trust can contribute to value creation despite the challenges and uncertainties in the technological landscape.
digital trust, value creation, risk management, strategic planning
Header Horizontal
McKinsey
Saved
The slide includes a line chart showing Nigeria's trade dynamics, including crude oil exports, non-oil exports, and trade balance from Q1 2015 to Q3 2023. Key insights and outlooks discuss the potential sustainability and vulnerabilities of the trade surplus.
Market Analysis and Trends
Financial Services
This slide analyzes Nigeria's trade surplus, focusing on the increase in crude oil exports and the potential vulnerabilities due to international oil market volatility. It provides insights into the sustainability of the trade balance in the context of global oil trends.
trade surplus, crude oil exports, trade balance, market volatility, sustainability
Mixed Chart
PwC/Strategy&
Saved
The slide has a bar chart showing client retention rate, and two pie charts displaying revenue distribution by clients and by country and region.
Client Case Studies
Professional Services
This slide highlights the high client retention rate (>99%) and the distribution of revenue by client and geography for the year 2022.
Client retention, revenue, pie chart, bar chart, geography
Multiple Chart
IPSOS
Saved
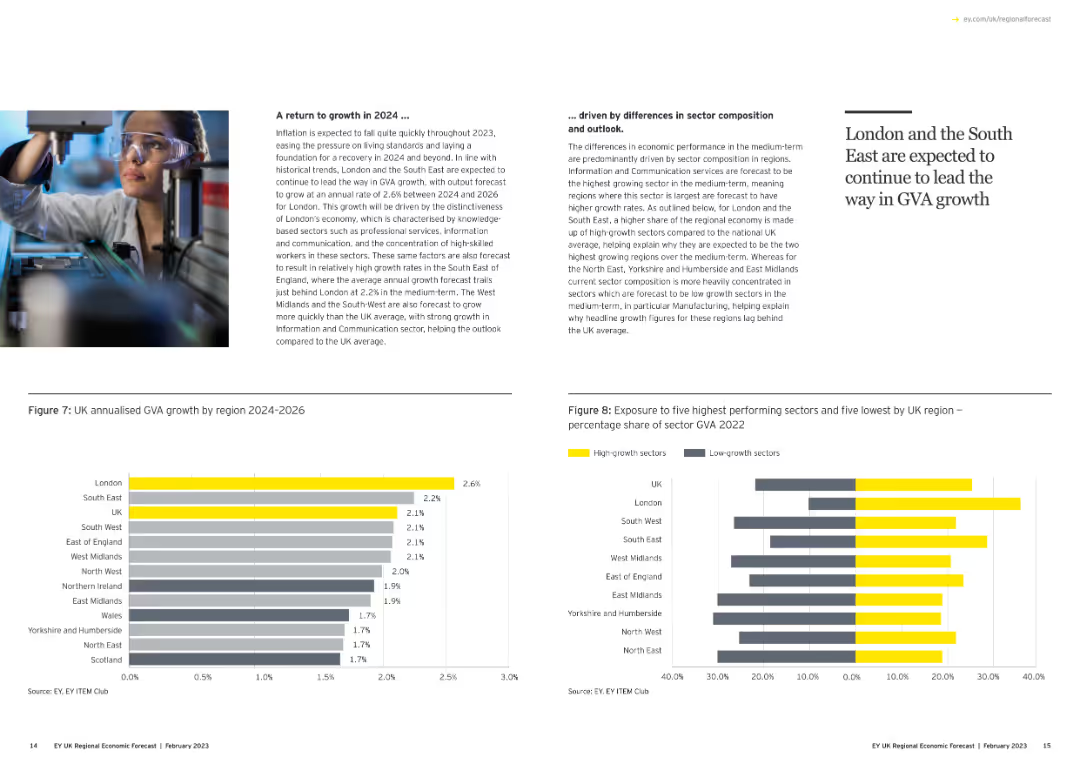
Features a small image of a person in a lab with two column charts showing annualized GVA growth by region and sector exposure percentages.
Strategic Planning
Government & Public Sector
Projects economic growth for 2024 and beyond, highlighting sectors and regions expected to lead in GVA growth, driven by sector composition.
growth forecast, 2024, GVA, regions, sectors, column chart
Multiple Chart
EY
Saved
This slide includes multiple triangular diagrams illustrating the impact of technology, process, data, and talent on operational maturity. The visuals are effectively used to compare the influence of each factor.
Strategic Planning
Professional Services
Highlights how different operational levers affect the maturity and efficiency of business operations. Essential for strategic decision-making and resource allocation in organizational development.
Operational Efficiency, Maturity Levels, Strategy
Mixed Chart
Accenture
Saved
The slide is an Image with Caption Slide, featuring an exploded view of a vehicle showcasing tire components, alongside a column chart and a world map. The visual elements are well-integrated and support the slide's message. The graphical data is presented clearly with contrasting colors to differentiate Michelin from competitors, and the map illustrates global presence, making for an engaging and informative layout.
Market Analysis and Trends
Transportation & Logistics
Highlighting Michelin's competitive advantage in the electric vehicle (EV) market, the slide demonstrates key tire requirements met by Michelin’s products, superior performance statistics compared to competitors, and their status as the preferred tire maker for leading EV manufacturers globally. It showcases their strategic positioning to leverage the shift towards vehicle electrification with their unique know-how.
electrification, vehicles, tires, performance, global, market, EV OEMs, competitive advantage, Michelin
Multiple Chart
Morgan Stanley
Saved
Contains stacked area chart and a line chart displaying global COVID-19 cases over time. Utilizes a color gradient for different continents.
Regulatory and Compliance
Healthcare & Pharmaceuticals
Slide presents global COVID-19 epidemic progression with a focus on daily cases and cumulative totals by region. Analyzes trends in case growth rates.
COVID-19, epidemic, cases, global, trends
Multiple Chart
BCG
Saved
Slide includes a line graph and column charts illustrating global print and digital news circulation from 2013 to 2018.
Market Analysis and Trends
Media & Entertainment
Discusses global trends in news consumption, focusing on the rise of digital subscriptions and the stability of print circulation.
global trends, news consumption, digital subscriptions, print circulation, rise, stability, media market, circulation data, comparison
Mixed Chart
Accenture
Saved
The slide includes a column chart showing USD inflows to the Nigerian economy, distinguishing between CBN and non-CBN sources, with a trend line for annual inflows.
Market Analysis and Trends
Financial Services
The slide analyzes the proportion of FX inflows to Nigeria from autonomous sources, noting a significant rise and its implications for the economy.
FX inflows, autonomous sources, CBN, Nigeria, financial analysis
Mixed Chart
PwC/Strategy&
Saved
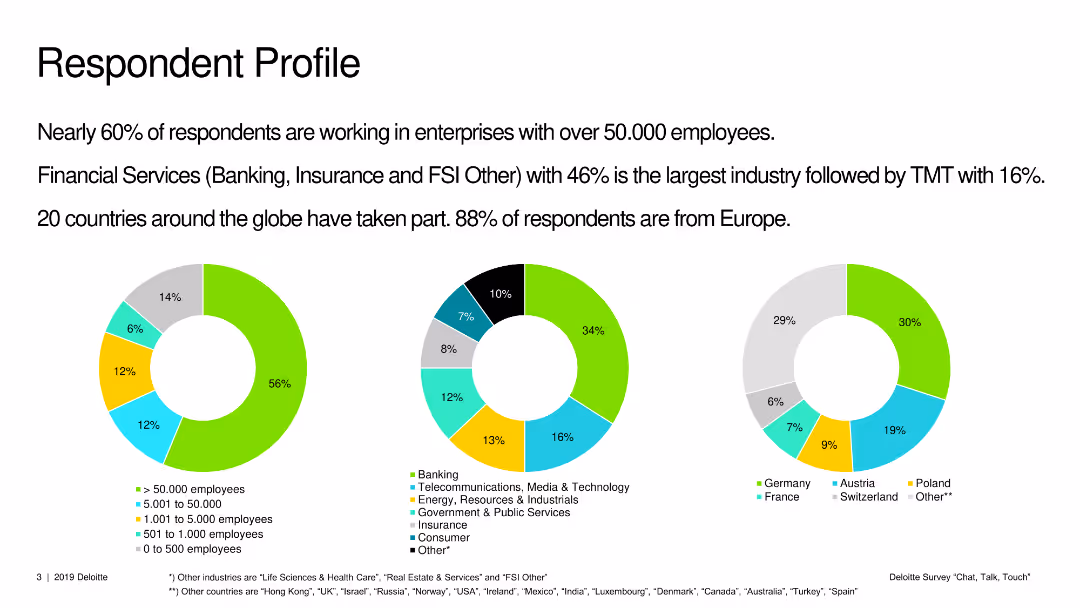
Three pie charts showing the profile of survey respondents by company size, industry, and geographic location.
Market Analysis and Trends
Professional Services
The slide outlines the demographic breakdown of survey respondents, detailing their company sizes, industries, and regions.
respondent profile, company size, industry, geography, survey, demographics
Multiple Chart
Deloitte
Saved
Two graphs displaying goods consumption against services and raw material input prices, using line charts with recessions marked. Text annotations complement the data.
Investment Analysis
Financial Services
Evaluates the potential for long-term inflation considering the consumption patterns of goods vs. services and the cost of raw materials, useful for economic forecasting and strategy.
Inflation, Goods Consumption, Services, Raw Material Costs, Economic Forecasting, Market Strategy
Multiple Chart
Citigroup
Saved
The slide features a column chart showing IWM credit volume in CHF bn across different sectors and key risk metrics like investment grade credit exposure and secured loans. Bullet points provide additional insights into the portfolio composition.
Financial Performance
Financial Services
The slide offers an overview of the credit volume portfolio, highlighting the distribution across various sectors like export finance and real estate. It details risk metrics, emphasizing secured loans and the proportion of investment-grade exposure.
credit volume, portfolio, risk metrics, secured loans, investment grade
Mixed Chart
Credit Suisse
Saved
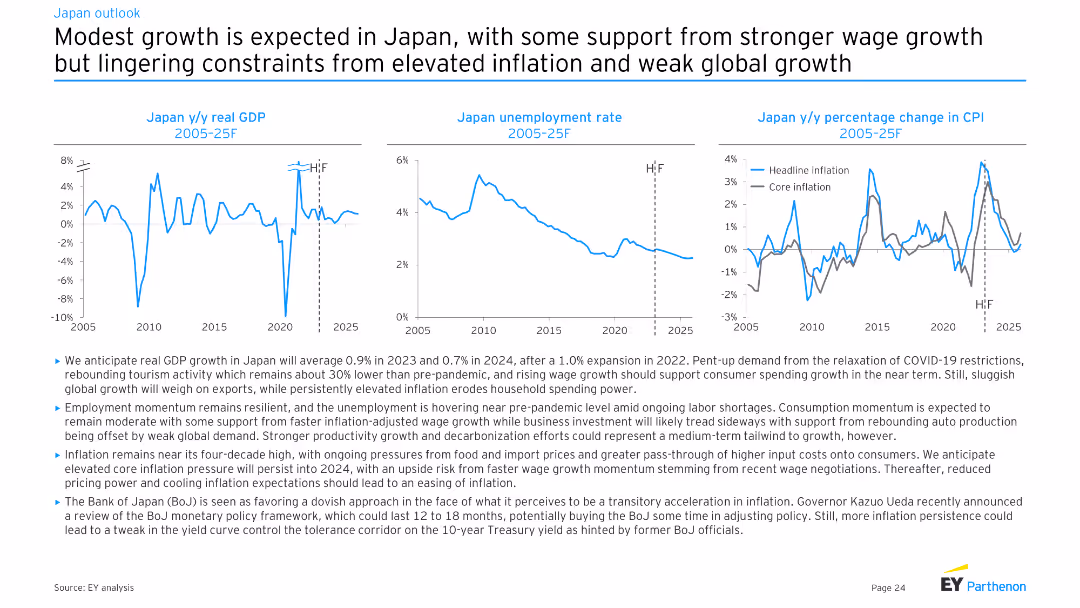
Three line charts showing Japan y/y real GDP, Japan unemployment rate, and Japan y/y percentage change in CPI from 2005-25F. Moderate complexity, well-structured for presenting economic projections and trends.
Market Analysis and Trends
Financial Services
This slide forecasts modest economic growth in Japan, supported by wage growth and rebounding tourism. It addresses ongoing inflation, employment trends, and the impact of global demand on economic performance.
Japan, GDP, unemployment, inflation, growth
Multiple Chart
EY
Saved
This slide displays a bar graph showing the percentage composition of different tax sources including customs & excise, VAT, individual income tax, and corporate income tax. Each category is represented by a different color and clearly labeled, making it straightforward to interpret.
Financial Performance
Government & Public Sector
This slide provides a breakdown of various sources of tax revenue in Namibia, highlighting the significant contributions of each type. It is commonly used in financial or economic presentations to illustrate how different taxes contribute to the national budget.
tax revenue, fiscal analysis, revenue sources, Namibia
Single Chart
PwC/Strategy&
Saved
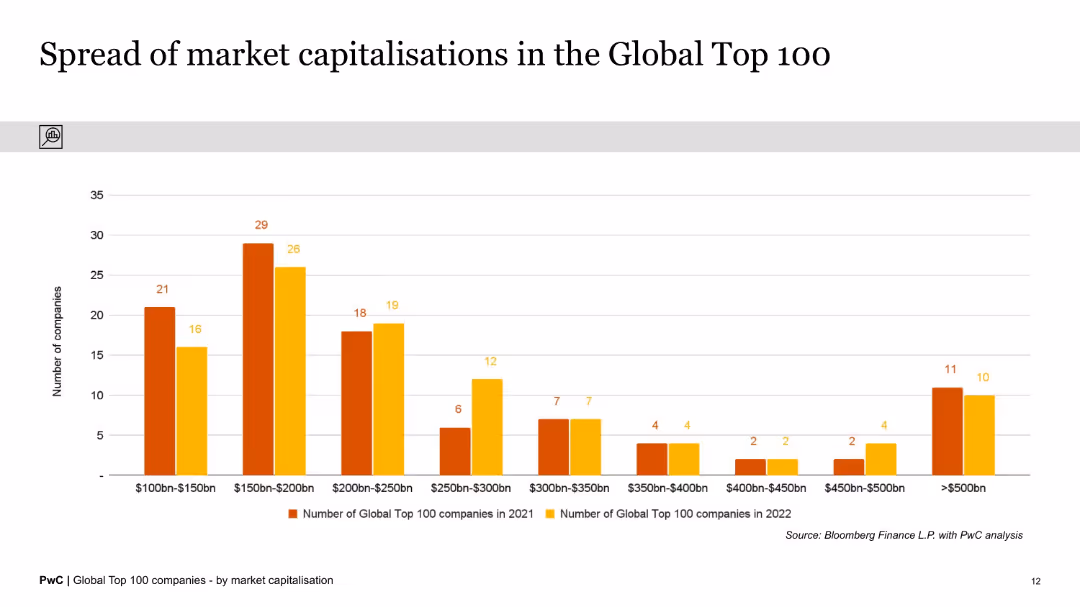
This slide displays a column chart showing the distribution of market capitalizations of the Global Top 100 companies in various ranges from $100bn to over $500bn, comparing the years 2021 and 2022.
Market Analysis and Trends
Financial Services
The slide provides an analysis of the spread of market capitalizations within the Global Top 100 companies, indicating the number of companies within specific market cap ranges and highlighting changes between 2021 and 2022.
Market Capitalization, Distribution, Global Top 100, Financial Analysis, Trends, Column Chart, Comparison, Years, Data Spread, Analysis
Single Chart
PwC/Strategy&
Saved
This slide features a blue and teal color scheme with four column charts displaying growth and simplification metrics in different financial segments. A legend explains the growth (+) and simplicity (−) metrics, and there's a footnote reference.
Product and Service Analysis
Financial Services
The slide presents JPMorgan’s growth in products, front office locations, hires in business segments, and app modernization, alongside simplification through funds merged or closed. It aims to show progress over two years.
growth, simplification, financial products, app modernization, JPMorgan, column chart, business segments, metrics
Multiple Chart
JP Morgan
Saved
Previous
Next
If nothing, comes up, please save your slides first
Create a FREE account to continue browsing
Receive Instant Access to 1,000+ slides from companies like McKinsey, Google, and Goldman Sachs
First Name
Last Name
Email
Password
I agree to all
Terms & Privacy Policy
Thank you! Your submission has been received!
Oops! Something went wrong while submitting the form.
Have an account?
Sign in
Column Chart
Heatmap
Chevron
Org Chart
Infographic
Callouts
Timeline
List
Graphic
Picture
Process Flow
Diagram
Paragraph
Map
Table
Framework
Subtitle
Takeaway Box
Icon
Other Chart
Radar Chart
Waterfall Chart
Mekko Chart
Pie Chart
Scatter Plot
Line Chart
Bar chart
Bullet points