My Account
My Slides
Search by Category
Templates
Leave Feedback
Login
Logout
Get Started
Browse all Slides
Browse all Slides
Create a FREE Account
Instant access to 1,000+ real slides from top companies like McKinsey, BCG, Goldman Sachs, Google and many more!
First Name
Last Name
Email
Password
I agree to all
Terms & Privacy Policy
Thank you! Your submission has been received!
Oops! Something went wrong while submitting the form.
Have an account?
Sign in
Saved Slides
Column chart showing negative to positive impacts of EU politics on US investments in France, accompanied by authoritative quotes.
Strategic Planning
Government & Public Sector
Discusses the investment climate in France influenced by European political uncertainties and the strategies suggested by experts.
EU politics, US investments, France, political uncertainties, Merkel, Italian budget
Mixed Chart
Bain
Saved
Similar to slide 1844, it presents a central, bold statement with a list of key opportunities and challenges against a monochromatic background, with the second point highlighted.
Strategic Planning
Professional Services
Focuses on the digitization of globalization as a key strategic point. The slide aims to discuss the specific implications and strategic considerations of digitizing global operations.
globalization, digitization, strategy, opportunities
Agenda
McKinsey
Saved
The slide has a dark background, a yellow text box for the quote, and a question followed by a bar chart illustrating percentages of consumers' openness to virtual care.
Customer and Market Segmentation
Healthcare & Pharmaceuticals
The slide discusses Canadian consumers' willingness to consider switching to virtual primary care consultations instead of in-person visits.
Virtual primary care, healthcare, consumer behavior, openness, Canada
Mixed Chart
EY
Saved
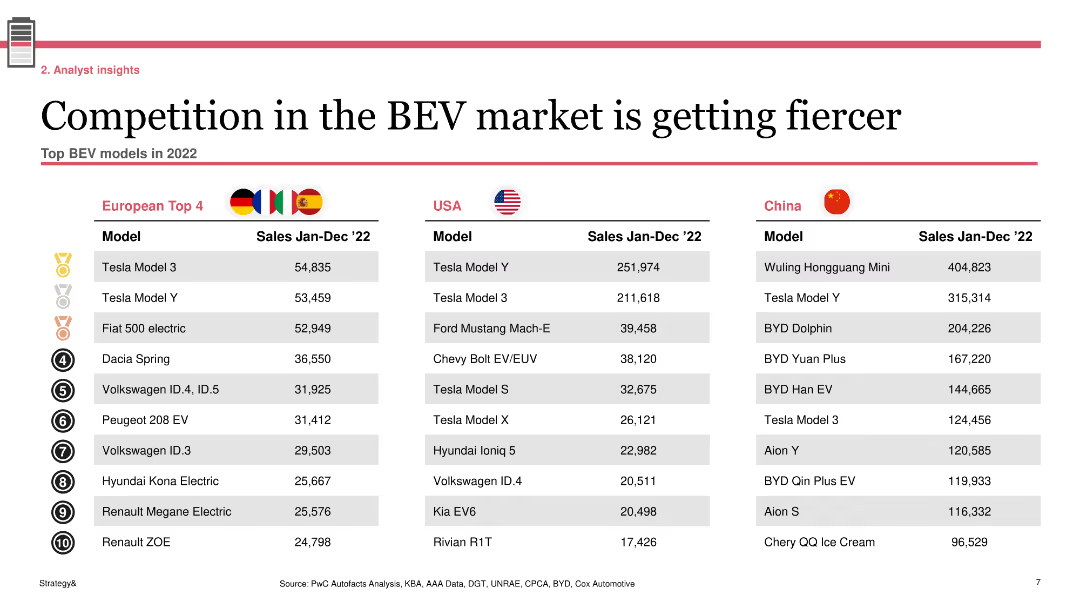
The slide presents three tables listing the top BEV models in 2022 for Europe, USA, and China. Each table includes the model name and sales figures for January to December 2022.
Competitive Landscape
Transportation & Logistics
This slide shows the top BEV models sold in Europe, USA, and China in 2022, highlighting the competitive nature of the BEV market across different regions with sales figures for each top model.
BEV, competition, market, sales, models
Table
PwC/Strategy&
Saved
Includes a column chart and detailed annotations discussing investments into Copernicus infrastructure and services. The layout is information-rich with clear visual breakdowns.
Investment Analysis
Environmental Services & Sustainability
Analyzes the investment into Copernicus by the European Commission and ESA, detailing the financial impacts and transactional impact on GDP. Valuable for financial analysis and understanding investment flows in space services.
Copernicus, investment, European Commission, ESA, GDP impact
Mixed Chart
PwC/Strategy&
Saved
Lists key facts about the firm's Asian operations using bullet points and a simple map to indicate locations. The design is straightforward with blue highlights.
Market Analysis and Trends
Professional Services
Provides an overview of Alvarez & Marsal’s presence in Asia, detailing their office locations, years of operation, and team experience. The slide aims to position the firm as a seasoned player in the Asian market with extensive regional expertise.
Asia, market presence, senior team, operational experience, client portfolio
Header Vertical
Alvarez & Marsal
Saved
This slide presents data in a series of well-organized tables and charts. It compares epidemiological data across various European countries with economic indicators on the side. There's a consistent color theme for visual clarity.
Market Analysis and Trends
Government & Public Sector
This slide compares COVID-19 data among European countries, with a focus on epidemiological and economic impacts. It is designed for presenting to stakeholders interested in the pandemic's effects and measures like travel restrictions and health notices, with country-specific details for a granular approach.
COVID-19, Europe, Data Comparison, Travel Restrictions, Health Notice, Economic Impact, Epidemiological Data, Country-Specific, Pandemic, Measures
Multiple Chart
McKinsey
Saved
Column charts illustrating investment categories over years and a graphical representation of risk management capabilities.
Risk Assessment and Management
Financial Services
This slide highlights advanced risk management capabilities and delivery approach, with strategic investments and technology platforms.
Risk management, technology platform, investment categories, strategic investments, delivery approach
Multiple Chart
Credit Suisse
Saved
Features a collection of bar and tables that display financial results and revenue streams, accompanied by dense numerical data and textual summaries of key fiscal details for Deutsche Bank's Investment Bank.
Financial Performance
Financial Services
This slide reviews the Q2 2023 financial outcomes for Deutsche Bank's Investment Bank, focusing on revenue streams and major fiscal indicators like adjusted costs and profit before tax.
Investment banking, financial results, revenue analysis, fiscal indicators, Deutsche Bank, Q2 2023
Mixed Chart
Deutsche Bank
Saved
This slide uses icons and brief text to illustrate the advantages of design leadership, such as a "Virtuous Cycle of Innovation" and "Stronger Security". The layout is clear, with each benefit separated into its own section using thin dividers, and the color scheme is consistent with green highlights.
Market Analysis and Trends
Technology & Software
Highlights the benefits of leading in semiconductor design, such as attracting global talent, setting technical standards, and ensuring national security. Useful in discussions aimed at industry leaders and policymakers, focusing on strategic advantages and long-term goals in the semiconductor industry.
semiconductor, design leadership, innovation, security, employment, standards
Pillar
BCG
Saved
Includes diagrams and bullet points describing the customer value delivery and collaboration in each phase of business model transformation.
Strategic Planning
Environmental Services & Sustainability
Discusses the importance of customer value delivery and collaboration in different phases of business transformation. It is ideal for detailed strategic planning and implementation discussions focusing on enhancing customer engagement and collaboration throughout transformation phases.
Customer value, Collaboration, Business model transformation, Strategic planning, Phase analysis, Engagement, Implementation, Business operations, Resource management, Scalability
Table
Accenture
Saved
Composed of multiple vertical bar graphs, this slide indicates the factors investors consider when making investment decisions. It uses a teal color scheme with variations in bar height to represent percentages, making it data-rich and informative.
Investment Analysis
Financial Services
The slide conveys investors' focus on various company-specific factors for investment consideration, such as long-term growth and valuation, suitable for analyzing investment criteria.
Investment Factors, Market Share, Valuation, Cash Flow, Balance Sheet, Organic Growth, Capital Improvement, Long-term Outlook, Strategic Investment, Company Evaluation
Mixed Chart
BCG
Saved
Contains logos and brief descriptions of three organizations: Social Progress Imperative, Play Verto, and Deloitte. Text blocks are well-organized with a clear, professional layout.
Strategic Planning
Professional Services
This slide presents three partnership organizations involved in social progress and consulting, providing brief overviews of each. It's aimed at highlighting the roles and unique selling points of each partner in the context of social impact.
partnerships, consulting, social impact, organizations
Pillar
Deloitte
Saved
Bar chart displaying the percentage of respondents by industry feeling an increased urgency for digital transformation due to COVID-19.
Market Analysis and Trends
Technology & Software
Provides a comparative analysis of how various industries perceive the urgency of digital transformation amidst the pandemic. Useful for strategic planning across sectors.
digital transformation, industries, COVID-19, urgency, strategy
Single Chart
BCG
Saved
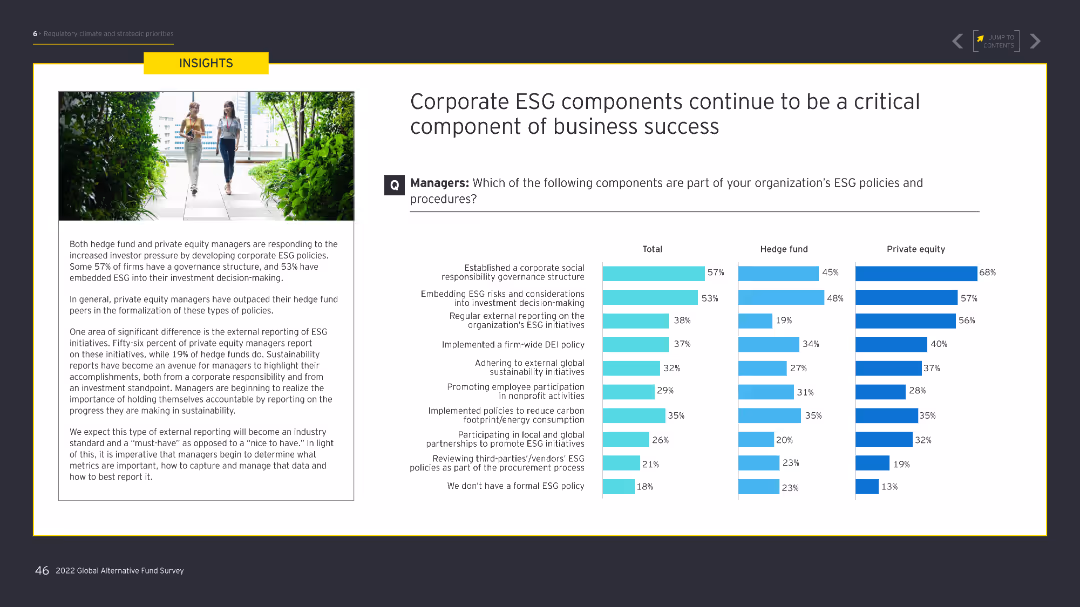
Includes a large image on the left and column charts on the right comparing hedge funds and private equity managers on various ESG policy components.
Regulatory and Compliance
Financial Services
The slide explores the importance of corporate ESG policies, showing how different components are integrated into hedge fund and private equity management practices.
ESG, corporate, business success, hedge funds, private equity
Multiple Chart
EY
Saved
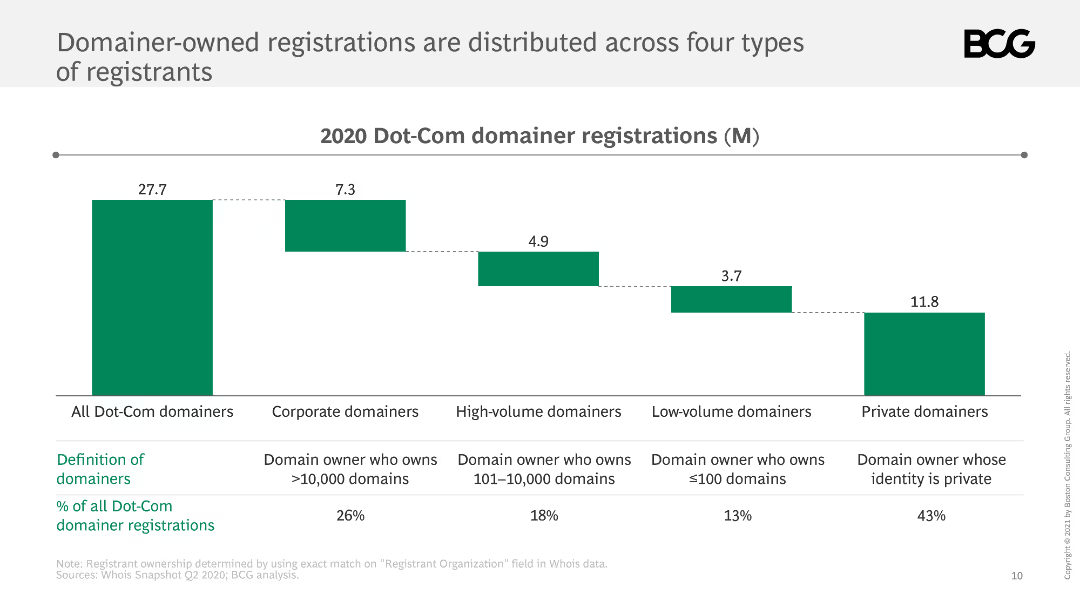
This slide shows a bar chart displaying the distribution of Dot-Com domainer registrations across corporate, high-volume, low-volume, and private domainers.
Market Analysis and Trends
Retail & E-commerce
It analyzes the distribution of domainer-owned Dot-Com registrations, identifying four types of registrants and their respective proportions.
domainers, registrations, distribution, Dot-Com, types
Mixed Chart
BCG
Saved
The slide features a list layout with iconography for different industries like Aircraft monitoring and Surgical robotics.
Client Case Studies
Transportation & Logistics
Highlights Ford's patents being cited across industries from agriculture to biopharma with specific examples of applications.
Ford, innovation, patents, industries, agriculture, biopharma
Boxed
BCG
Saved
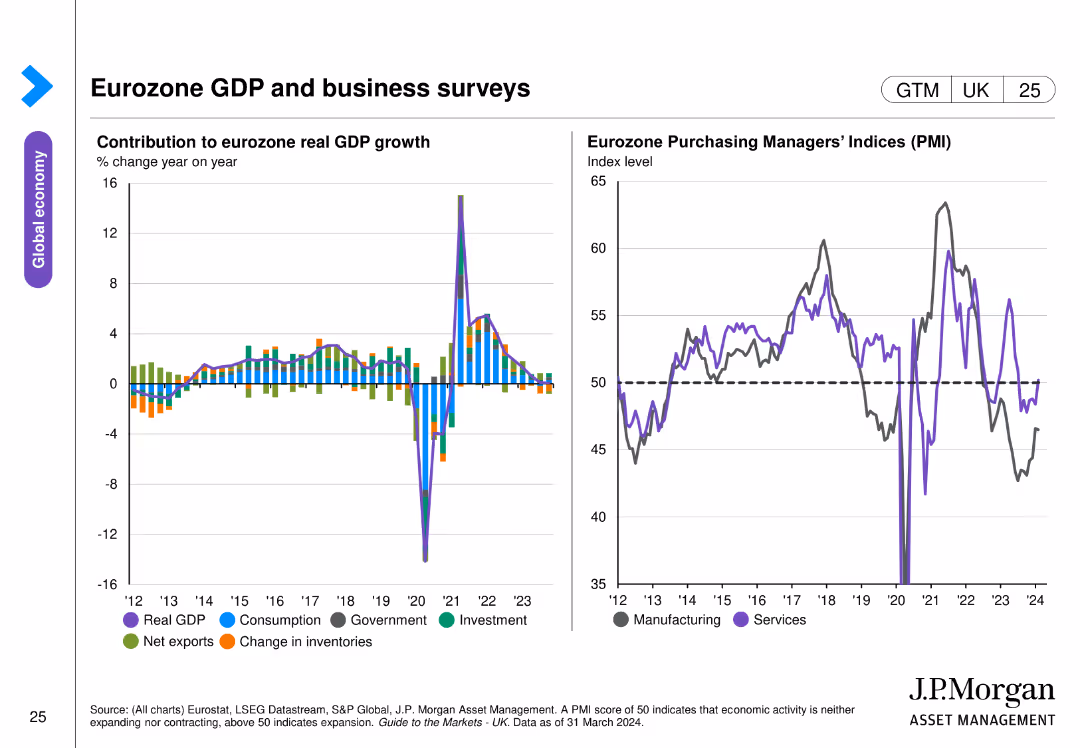
This slide contains two column charts. The left chart presents the contribution to eurozone real GDP growth by different sectors. The right chart shows Eurozone Purchasing Managers' Indices (PMI) over time. The charts are detailed and use various colors to distinguish data categories.
Market Analysis and Trends
Financial Services
The slide analyzes the eurozone's GDP growth and business activity through sector contributions and PMI trends, essential for economic analysis and business strategy.
eurozone GDP, business surveys, PMI, sector growth, economic analysis
Multiple Chart
JP Morgan
Saved
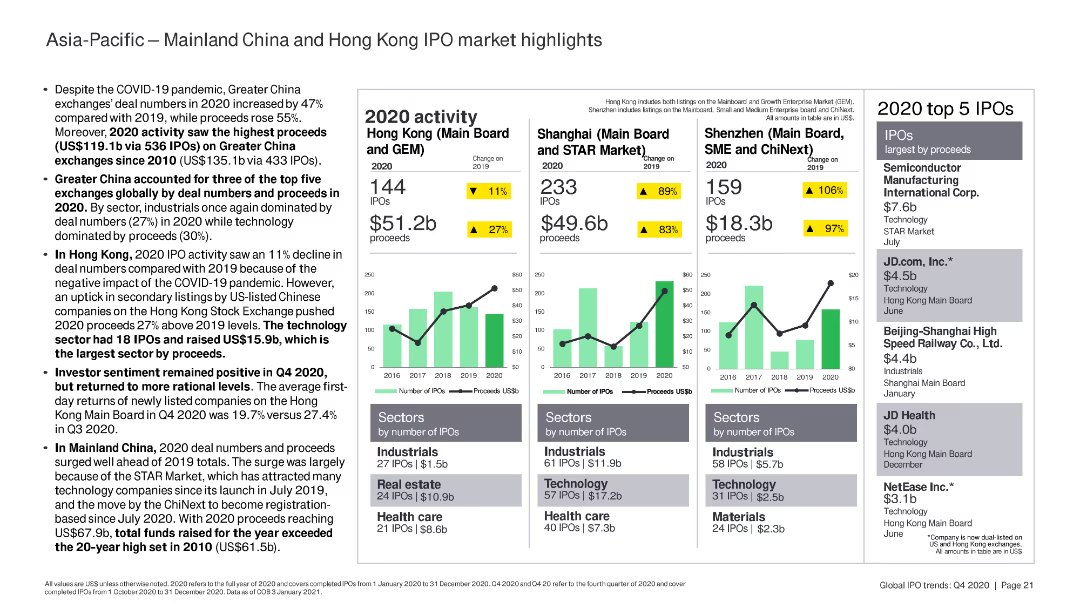
The slide features column charts and bar charts summarizing IPO activity in Mainland China and Hong Kong, highlighting key sectors and top IPOs by proceeds.
Market Analysis and Trends
Financial Services
The slide highlights IPO activity in Mainland China and Hong Kong in 2020, focusing on the performance of key stock exchanges, sectors, and top IPOs by proceeds.
China, Hong Kong, IPO, sectors, proceeds
Multiple Chart
EY
Saved
The slide includes a column chart assessing risks and opportunities by corporate function. There are icons for each function and highlights per industry.
Strategic Planning
Transportation & Logistics
Analyzes the risks and opportunities of digitalization across various corporate functions, with a focus on logistics and finance sectors leveraging new technologies.
Digitalization, logistics, finance, opportunities, risks, strategic planning
Table
Roland Berger
Saved
Contains text blocks and minimalistic design elements, focusing on interviews and statistical data.
Investment Analysis
Financial Services
Provides insights into near-term investment opportunities in Southeast Asia through sector screening and interviews with investors.
near-term opportunities, SEA, investment screening, investor interviews, sectors
Header Horizontal
Bain
Saved
Combines text sections and graphical elements to discuss talent acquisition strategies and neurodiversity initiatives.
Strategic Planning
Professional Services
Details strategies to attract and develop talent, highlighting the firm's inclusive goals and partnerships.
talent acquisition, neurodiversity, recruitment, analytics, growth strategy
Text Only
Booz Allen Hamilton
Saved
Two large numeric points on the right, a simple text box on the left, and a bright purple background. The design is clean and segmented with bold text for easy reading.
Strategic Planning
Telecommunications
This slide serves as an introduction, highlighting the key values and essentialities of the nbn™ network, setting the stage for the discussion to follow.
nbn network, introduction, essential tasks, enriching activities, presentation, connectivity, digital value, network importance
Agenda
Accenture
Saved
This slide displays two stacked column charts comparing the age of SSCs in various countries over different periods.
Strategic Planning
Professional Services
Evaluates the age distribution of shared service centers (SSCs) across different countries, showing trends over time which indicate shifts in global business service strategies.
SSCs, trends, geographic, business
Mixed Chart
Deloitte
Saved
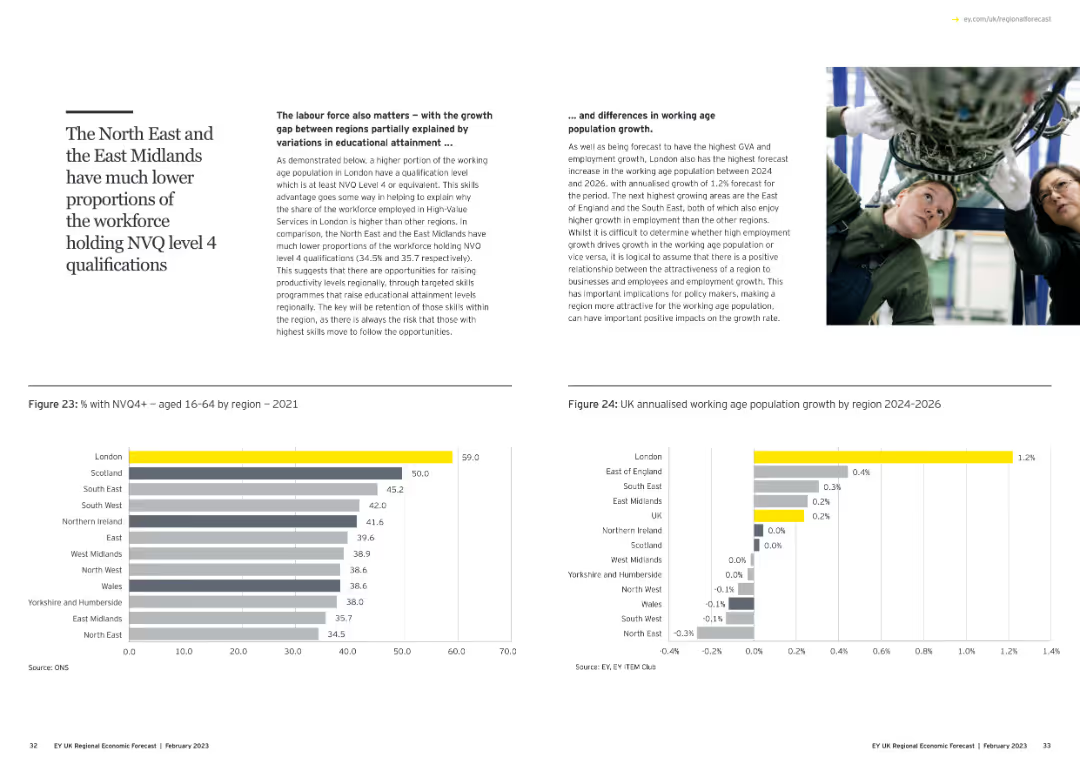
This slide includes a text box on the left with explanations about NVQ level 4 qualifications. Below, there is a column chart showing the percentage of workforce with NVQ4+ by region, and a bar chart forecasting working-age population growth.
Human Resources and Talent Management
Education & Training
The slide discusses regional disparities in educational attainment, specifically NVQ level 4 qualifications, and its impact on workforce proportions and future population growth across various regions.
NVQ level 4, workforce, education, regional disparities, population growth
Multiple Chart
EY
Saved
Previous
Next
If nothing, comes up, please save your slides first
Create a FREE account to continue browsing
Receive Instant Access to 1,000+ slides from companies like McKinsey, Google, and Goldman Sachs
First Name
Last Name
Email
Password
I agree to all
Terms & Privacy Policy
Thank you! Your submission has been received!
Oops! Something went wrong while submitting the form.
Have an account?
Sign in
Column Chart
Heatmap
Chevron
Org Chart
Infographic
Callouts
Timeline
List
Graphic
Picture
Process Flow
Diagram
Paragraph
Map
Table
Framework
Subtitle
Takeaway Box
Icon
Other Chart
Radar Chart
Waterfall Chart
Mekko Chart
Pie Chart
Scatter Plot
Line Chart
Bar chart
Bullet points