My Account
My Slides
Search by Category
Templates
Leave Feedback
Login
Logout
Get Started
Browse all Slides
Browse all Slides
Create a FREE Account
Instant access to 1,000+ real slides from top companies like McKinsey, BCG, Goldman Sachs, Google and many more!
First Name
Last Name
Email
Password
I agree to all
Terms & Privacy Policy
Thank you! Your submission has been received!
Oops! Something went wrong while submitting the form.
Have an account?
Sign in
Saved Slides
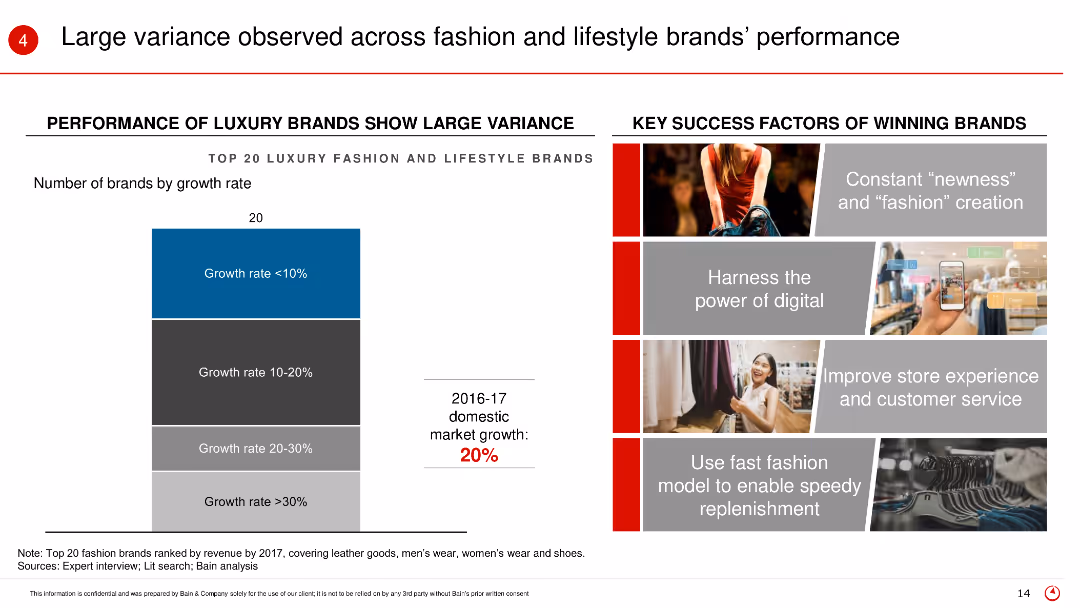
The slide includes a column chart showing the performance of top 20 luxury fashion and lifestyle brands by growth rate, accompanied by key success factors on the right.
Market Analysis and Trends
Retail & E-commerce
This slide analyzes the performance variance among top luxury brands, identifying key success factors such as digital power, customer service, and fast fashion models.
Brand performance, luxury brands, growth rate, key success factors, fashion brands
Mixed Chart
Bain
Saved
The content slide includes a photo of a person gardening, accompanied by three line graphs showing employment rate scenarios for Africa, India, and Southeast Asia. The visual layout is clear, with the photo providing contextual background.
Human Resources and Talent Management
Professional Services
This slide focuses on the employment rate changes in Africa, India, and Southeast Asia due to the green transition. It highlights the role of green jobs in maintaining employment levels and stresses the importance of supporting the labor market transition to avoid social unsustainability and labor shortages.
Employment, Africa, India, Southeast Asia, Green Jobs
Multiple Chart
EY
Saved
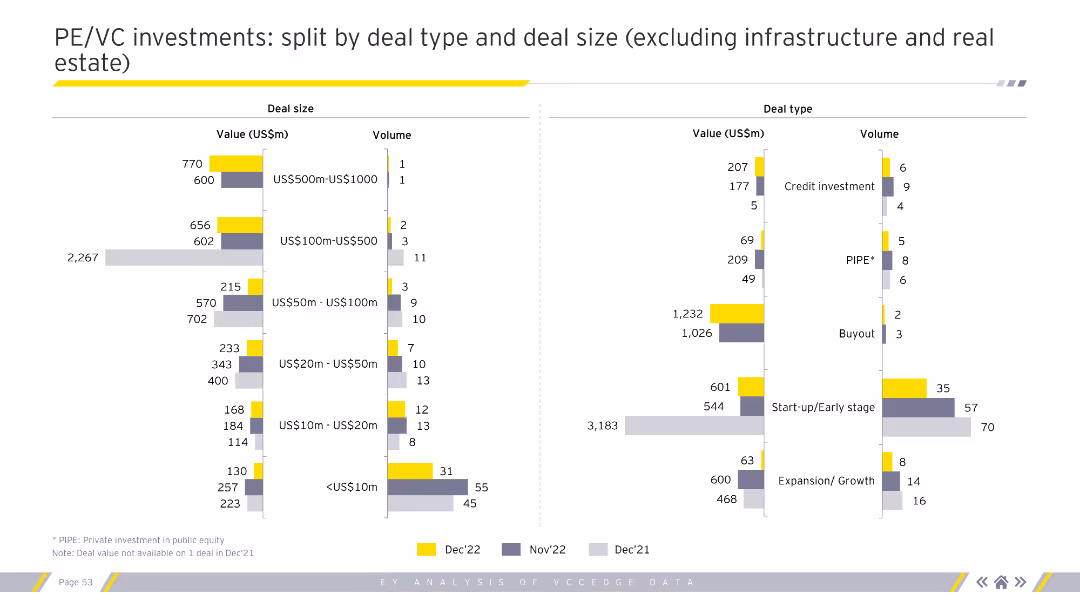
Shows column charts for PE/VC investments split by deal size and deal type, excluding infrastructure and real estate. Visual complexity is moderate.
Investment Analysis
Financial Services
Breaks down PE/VC investments by deal size and type, providing insights into investment strategies excluding infrastructure and real estate. Essential for investment analysts.
PE, VC, investments, deal size, deal type
Multiple Chart
EY
Saved
Tabular comparison of industry use cases for immersive tech, accompanied by relevant isometric illustrations.
Technology and Digital Transformation
Technology & Software
Describes horizontal and vertical use case scenarios for immersive tech across various industries, highlighting specific applications and their significance.
Immersive tech, industries, use cases, application, significance
Header Horizontal
McKinsey
Saved
The slide contains multiple text boxes with headers and bullet points, contrasting 'Talent resignation' and 'Talent retrenchment', and providing key considerations for the company on the right.
Human Resources and Talent Management
Professional Services
This slide compares different aspects of talent retention and exit, including resignation and retrenchment, and outlines the company's imperatives in managing these situations. It serves as an informational slide for management and HR professionals.
Resignation, Retrenchment, Talent Management, Company Strategy
Header Vertical
Kearney
Saved
Combines text with an image and bar charts showing different emission reduction pathways and the use of offsets from 2020 to 2050.
Strategic Planning
Environmental Services & Sustainability
Describes various business approaches to emissions reduction, including direct decarbonisation, carbon neutrality, and beyond net zero, highlighting the role of offsets.
Emissions, reduction, business, commitment, pathway, offset, decarbonisation, 2050
Multiple Chart
EY
Saved
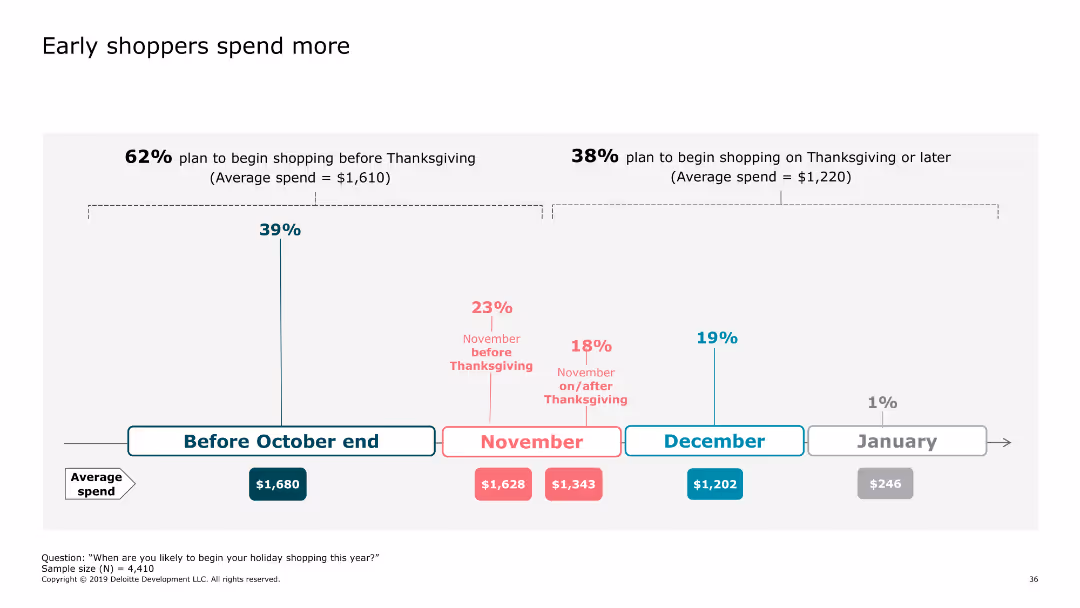
This slide features a horizontal bar chart showing different shopping periods with respective average spend values. The chart is divided into months, highlighting consumer spend trends.
Market Analysis and Trends
Retail & E-commerce
The slide explains how consumer spending habits vary based on the shopping period, emphasizing higher spending by early shoppers before Thanksgiving compared to late shoppers.
shopping, spending, consumers, holidays, trends
Linear Flow
Deloitte
Saved
Pie chart representing percentage of internet-using buyers, with side bar graphs detailing the triggers for offline and online buyers.
Market Analysis and Trends
Hospitality & Tourism
Comparison between offline and online buyers for hotels, emphasizing trust and payment reasons for offline purchases and multiple options online.
Hotels, Trust, Payment, Offline Buying, Online Options, Market Trends
Mixed Chart
BCG
Saved
A world map highlights key locations with markers. An inset magnifies the Singapore region, showing more detail with labeled yard locations.
Strategic Planning
Energy & Utilities
The slide demonstrates Seatruim's global presence, highlighting its worldwide yards and the strategic position of Singapore in the company's operations. It could be used to emphasize the company's expansive global operations and strategic locations.
Global, Operations, Reach, Yards, Singapore
Graphic
Morgan Stanley
Saved
It uses a balance of text bullet points and illustrative graphics, to present medium-term strategic goals and financial targets. There's a clear distinction between the narrative sections and the data visualizations, allowing for easy reading and interpretation.
Strategic Planning
Financial Services
Communicates a strategic overview for the medium-term, detailing expected financial performance and strategic shifts towards higher-returning businesses. This slide is typically used in executive briefings and strategic planning meetings to set forward-looking goals and align business efforts with market opportunities.
Strategic Overview, Financial Targets, Business Strategy, Return on Investment
Text Only
Citigroup
Saved
Pie charts showing survey results, text with bullet points and manifesto sections
Organizational Structure and Change
Professional Services
Discusses EY's approach to flexible work policies, survey results, and the EYManifesto
Agile work, flexibility, survey, manifesto, EY
Multiple Chart
EY
Saved
The slide features two column charts showing the percentages of participants who experienced gains or losses from crypto assets and crypto investment funds.
Financial Performance
Financial Services
This slide provides insights into the financial outcomes (gains or losses) for participants holding crypto assets and investment funds.
Gains, losses, crypto assets, investment funds, financial outcomes
Multiple Chart
IPSOS
Saved
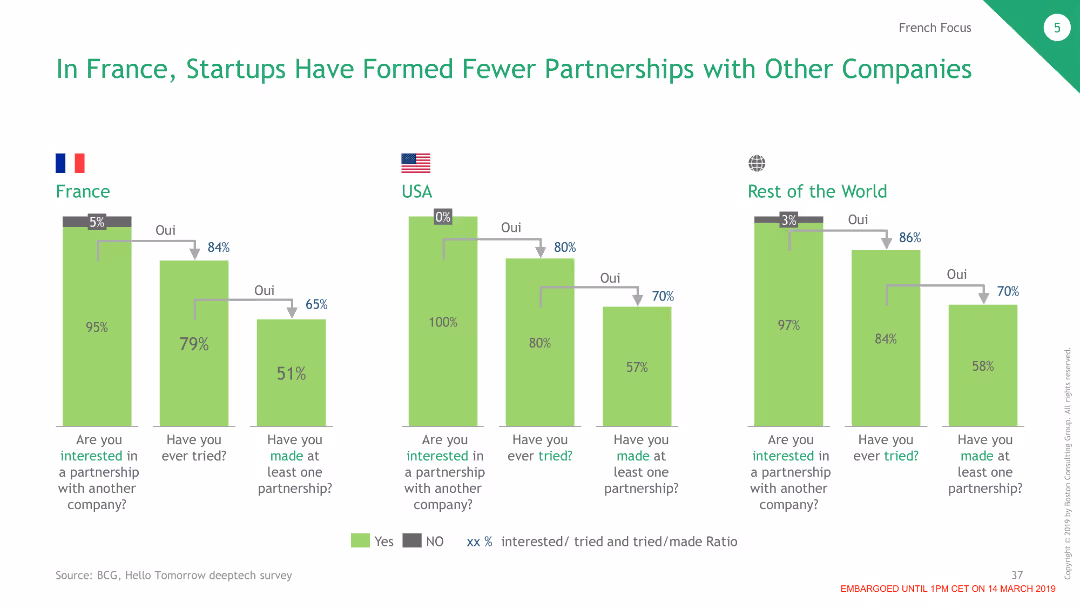
The slide presents column charts comparing partnership formation rates among startups in France, the USA, and the RoW.
Market Analysis and Trends
Professional Services
Analyzes the lower rates of partnership formation among French startups compared to their counterparts in the USA and the RoW.
partnerships, startups, France, USA, RoW
Multiple Chart
BCG
Saved
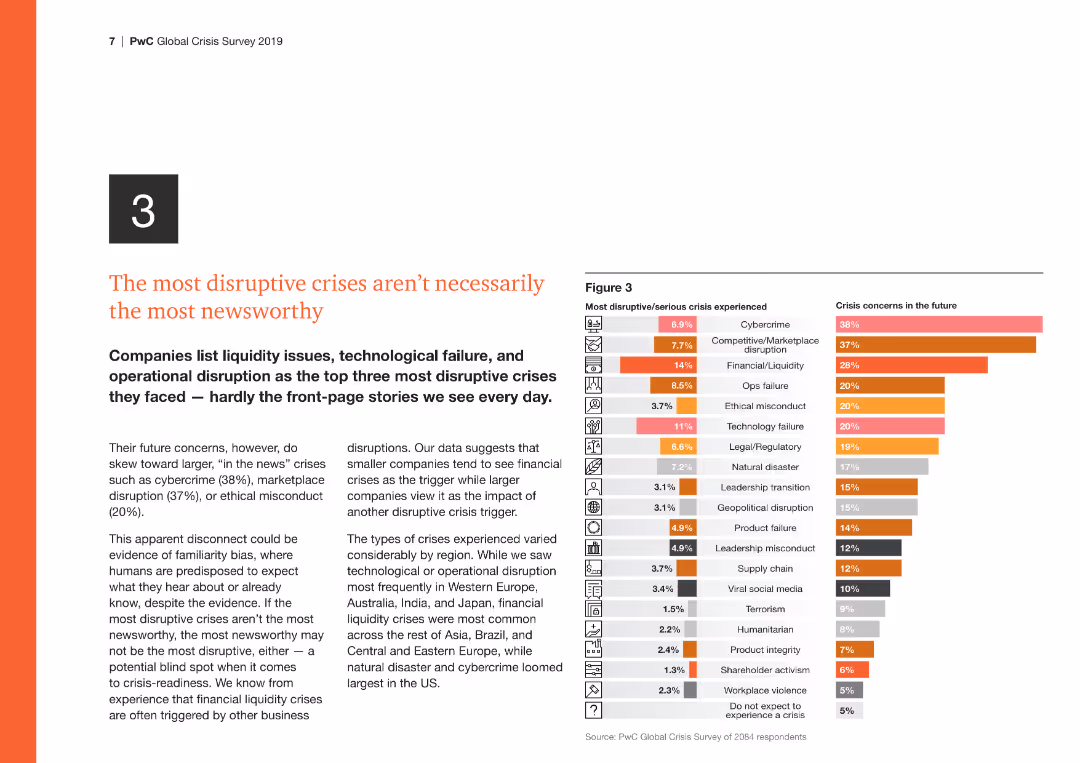
The slide features a column chart on the right comparing the most disruptive/serious crises experienced with future crisis concerns, highlighting cybercrime and financial issues.
Risk Assessment and Management
Financial Services
This slide discusses the disconnect between the most disruptive crises and those most reported, emphasizing the need for attention to operational and tech disruptions.
Disruptive crises, cybercrime, financial, operational, future concerns
Multiple Chart
PwC/Strategy&
Saved
The slide features a four-column layout with textual information on the left and various bubble charts on the right, visually representing data on AI utilization across different business processes. Each chart is marked with a percentage, indicating the level of AI integration.
Industry Overview
Government & Public Sector
This slide discusses the potential of AI to improve operations in government and public services, with specific examples from the Air Force and other agencies. It explains how AI can predict performance and safety issues, and how it assists humans before performance degrades. Additionally, it lists different operational areas where AI is currently used, like customer experience and operations finance.
Government, Public Services, AI, Innovation, Performance, Safety, Operations, Finance, Customer Experience
Multiple Chart
Deloitte
Saved
Bar charts detailing the creation of new roles over the past year and within the next 12 months, alongside their executive/non-executive levels.
Organizational Structure and Change
Professional Services
This slide analyzes the trend of creating new innovation roles within organizations, highlighting the distribution between executive and non-executive levels.
Innovation roles, organizations, trends, creation, executive, non-executive, structure, analysis, 12 months
Multiple Chart
EY
Saved
Contains two column charts: one showing GVA growth in UK regions for 2023 and another showing GVA growth by sector.
Market Analysis and Trends
Government & Public Sector
Discusses the expected recession in 2023, detailing forecasted declines in GVA growth across UK regions and sectors, driven by consumer spending declines.
recession, 2023, GVA growth, UK regions, sectors, column chart
Multiple Chart
EY
Saved
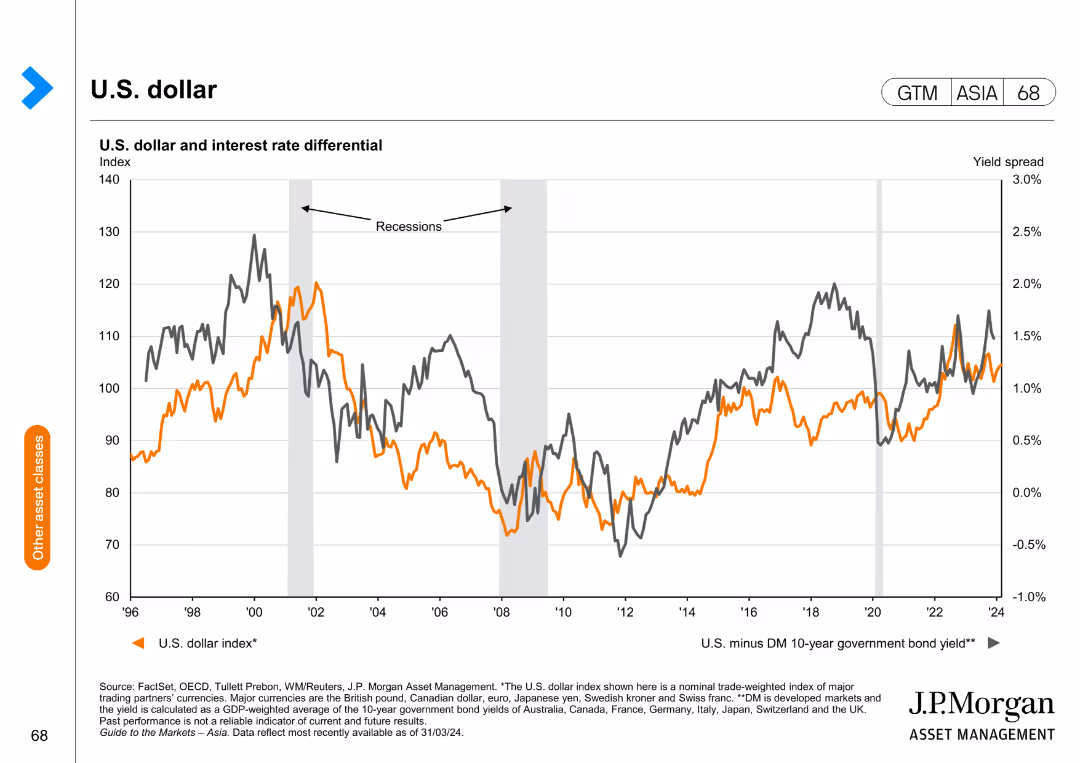
This slide includes a line chart depicting the U.S. dollar index and the interest rate differential over time.
Market Analysis and Trends
Financial Services
The slide analyzes the U.S. dollar index in relation to interest rate differentials, providing insights into currency trends and economic impacts.
U.S. dollar, interest rates, currency trends, economic analysis, financial insights
Single Chart
JP Morgan
Saved
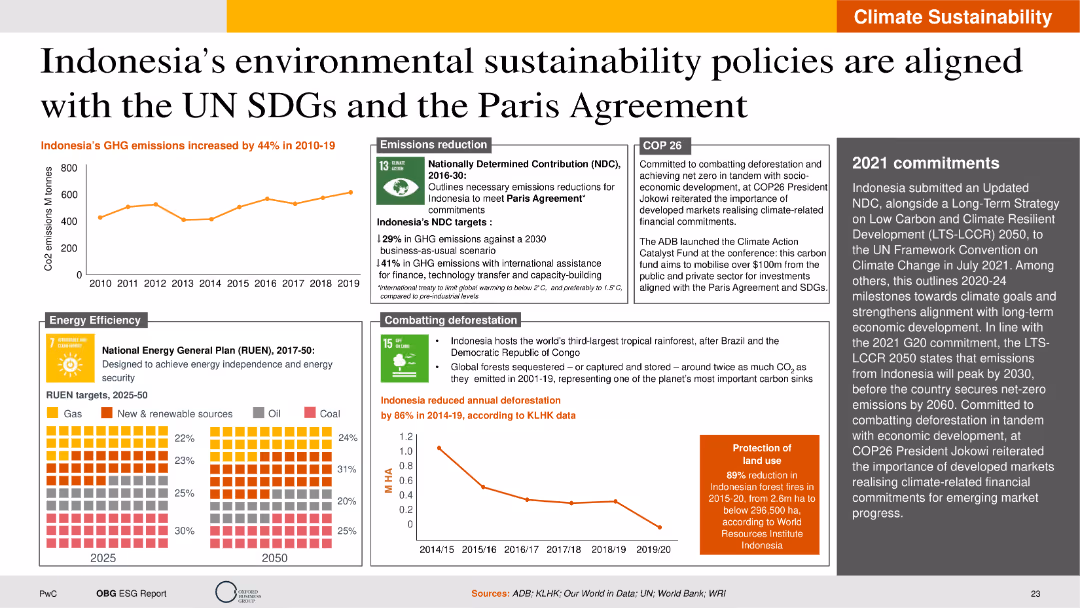
This slide includes line charts, heat maps, and detailed text descriptions. The layout is moderately complex, displaying data on GHG emissions, energy efficiency targets, and deforestation rates.
Regulatory and Compliance
Environmental Services & Sustainability
The slide outlines Indonesia's environmental sustainability policies and their alignment with the UN SDGs and the Paris Agreement. It provides an overview of GHG emission trends, energy efficiency goals, deforestation reduction efforts, and commitments made during COP26. The slide also discusses the role of international assistance and financial investments in achieving these targets.
Environmental sustainability, UN SDGs, Paris Agreement, GHG emissions, energy efficiency
Multiple Chart
PwC/Strategy&
Saved
A bubble chart showing hydrogen production combined with CCUS projects for various industrial applications.
Market Analysis and Trends
Energy & Utilities
Discusses the development of CCUS for blue hydrogen production and its industrial applications.
CCUS, hydrogen, production, industrial, applications
Single Chart
Kearney
Saved
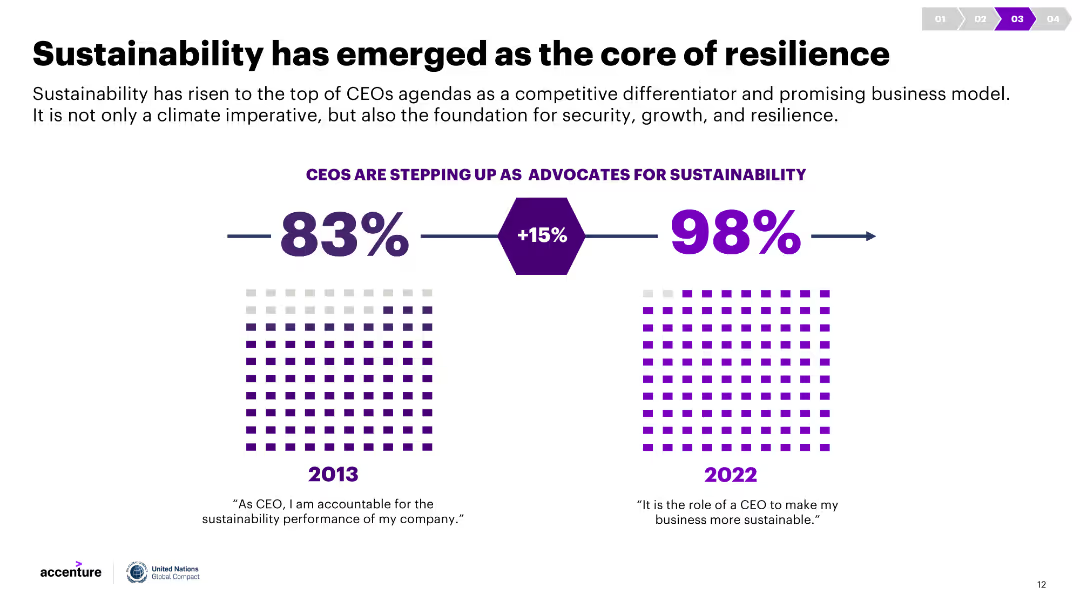
A slide with statistical data comparing CEOs' advocacy for sustainability between 2013 and 2022, using percentage values and visual graphics. Commentary discusses the implications.
Strategic Planning
Environmental Services & Sustainability
The slide illustrates the growing importance of sustainability among CEOs, showing a significant increase in advocacy from 2013 to 2022 and positioning sustainability as a core business strategy.
Sustainability, CEO advocacy, business strategy, resilience, statistics
Single Chart
Accenture
Saved
The slide includes text and an infographic explaining the different scopes of GHG emissions (direct, indirect, and other indirect), and their impact on corporate GHG emissions disclosure.
Regulatory and Compliance
Government & Public Sector
The slide discusses the development of corporate GHG emissions disclosure covering scopes 1, 2, and 3. It includes an infographic detailing the types of emissions, their definitions, and examples, emphasizing the increasing pressure on corporations to reduce GHG emissions.
GHG emissions, disclosure, scopes, corporate
Diagram
Kearney
Saved
The slide contains a structured table on the top outlining proposed capital raises. Below, there's a timeline detailing the indicative timeline for these raises.
Investment Analysis
Financial Services
This slide provides an overview of the proposed capital raises, including a breakdown of the structure and size, followed by a detailed timeline for the execution of these raises.
capital raises, timeline, financial planning, investment, strategy
Linear Flow
Credit Suisse
Saved
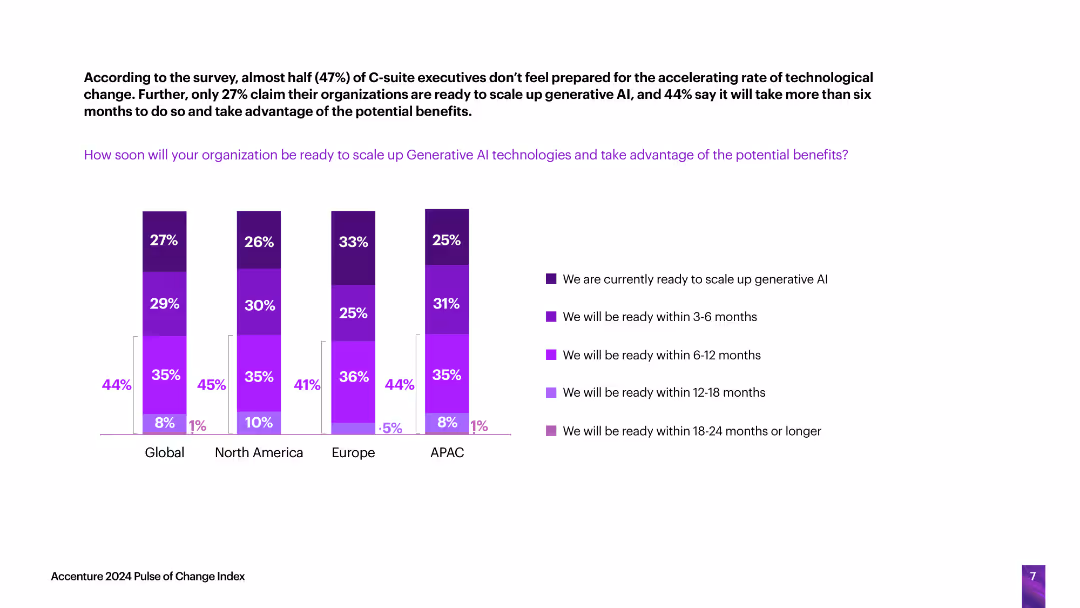
The slide includes vertical column charts indicating how soon organizations in different regions will be ready to scale up generative AI technologies, with readiness categorized by time frames (current, 3-6 months, etc.).
Technology and Digital Transformation
Technology & Software
The slide evaluates the readiness of organizations across various regions to scale up generative AI technologies, highlighting the time frames within which they expect to be prepared.
generative AI, readiness, scaling, technology adoption, time frames
Single Chart
Accenture
Saved
Two column charts detailing sources of return for global equities and global valuations, including EPS, multiples, and dividends for various regions.
Investment Analysis
Financial Services
This slide provides an analysis of the sources of return and valuation metrics for global equities, comparing performance across different regions and indicators.
global equities, return sources, valuations, EPS, multiples, dividends
Multiple Chart
JP Morgan
Saved
Previous
Next
If nothing, comes up, please save your slides first
Create a FREE account to continue browsing
Receive Instant Access to 1,000+ slides from companies like McKinsey, Google, and Goldman Sachs
First Name
Last Name
Email
Password
I agree to all
Terms & Privacy Policy
Thank you! Your submission has been received!
Oops! Something went wrong while submitting the form.
Have an account?
Sign in
Column Chart
Heatmap
Chevron
Org Chart
Infographic
Callouts
Timeline
List
Graphic
Picture
Process Flow
Diagram
Paragraph
Map
Table
Framework
Subtitle
Takeaway Box
Icon
Other Chart
Radar Chart
Waterfall Chart
Mekko Chart
Pie Chart
Scatter Plot
Line Chart
Bar chart
Bullet points