My Account
My Slides
Search by Category
Templates
Leave Feedback
Login
Logout
Get Started
Browse all Slides
Browse all Slides
Create a FREE Account
Instant access to 1,000+ real slides from top companies like McKinsey, BCG, Goldman Sachs, Google and many more!
First Name
Last Name
Email
Password
I agree to all
Terms & Privacy Policy
Thank you! Your submission has been received!
Oops! Something went wrong while submitting the form.
Have an account?
Sign in
Saved Slides
Presents a timeline from 1990 to 2030 showing changes in the top semiconductor companies by revenue. Each decade is represented by a different color, and arrows indicate new entrants or drops from the list. The slide is visually dense but organized, allowing for clear comparisons across years.
Market Analysis and Trends
Technology & Software
This slide depicts the dynamic nature of leadership in the semiconductor industry, showing how top companies have shifted positions over the decades. Useful for discussions on market dynamics, industry evolution, and strategic planning in technology and industrial sectors.
semiconductor, industry leaders, market dynamics, revenue, historical comparison
Table
BCG
Saved
This slide displays four key strategy areas, each accompanied by an icon and brief description, and central metrics such as ROTCE target and CET1 ratio. The layout is clear and spacious, with ample white space and large, readable fonts, creating a visually accessible summary of strategic commitments.
Strategic Planning
Financial Services
Reiterating its commitment to customers, Slide 19 summarizes JPMorgan Chase & Co.'s strategic targets and performance metrics, emphasizing a robust, client-focused approach across global markets.
Strategy, Commitment, ROTCE, CET1 Ratio, Client Focus, Global, Performance Metrics
Boxed
JP Morgan
Saved
The slide includes multiple visual elements, such as a line graph showing historical and projected market size for movie theaters, alongside icons and brief points highlighting shifts in consumer preferences toward online entertainment. The layout is engaging and visually organized.
Market Analysis and Trends
Media & Entertainment
Discusses the lasting impacts of COVID-19 on the entertainment sector, focusing on the shift away from traditional movie theaters towards streaming and gaming. It details how consumer habits have evolved and the strategic implications for the industry, including potential areas for growth in digital entertainment.
entertainment trends, COVID-19 impact, streaming growth, gaming, market analysis, consumer behavior, structural change
Mixed Chart
BCG
Saved
This slide is dominated by a large, purple column chart that breaks down total spending into categories such as engineering, support, and infrastructure. Text boxes provide context and outline opportunities for development excellence and technology modernization.
Financial Performance
Financial Services
Explores financial strategies aimed at leveraging technology and development practices to enhance productivity and manage expense growth.
Financial Performance, Technology Modernization, Strategic Planning, Financial Services, Productivity, Cost Efficiency
Mixed Chart
JP Morgan
Saved
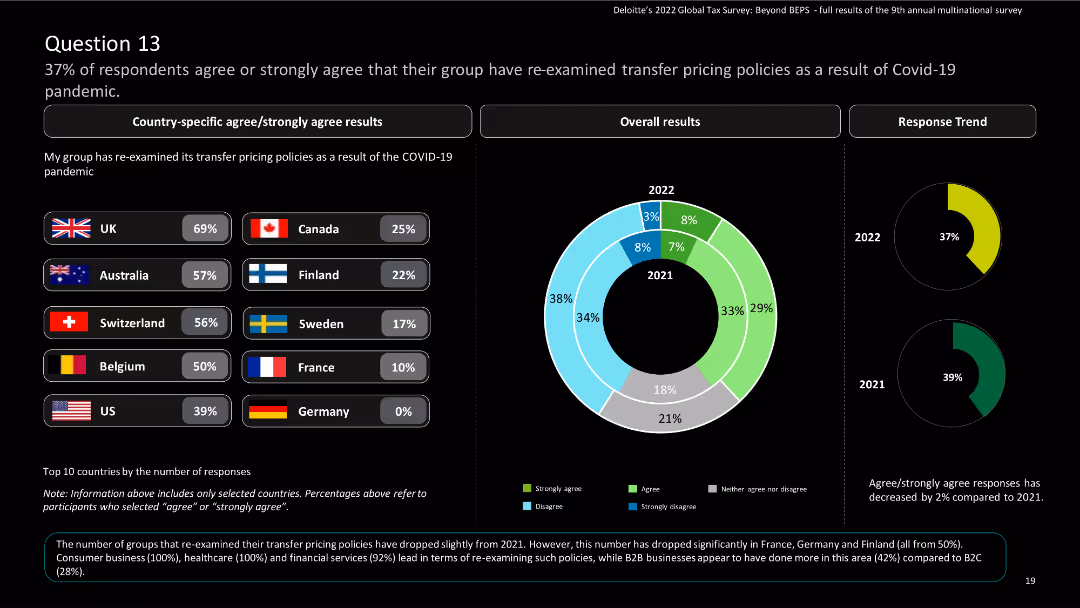
This slide presents country-specific results using bar charts and a donut chart for overall results. It includes country flags and percentages.
Risk Assessment and Management
Financial Services
The slide displays survey results on the re-examination of transfer pricing policies due to COVID-19. It shows country-specific and overall responses, comparing results from 2021 to 2022.
COVID-19, transfer pricing, survey, financial services, policy re-examination
Multiple Chart
Deloitte
Saved
The slide features a column chart displaying the number of IPOs and proceeds from 2019 to YTD 2023, a table of cross-border IPOs by country, and line charts for percentage trends.
Market Analysis and Trends
Financial Services
This slide presents data on US IPO performance, highlighting cross-border deals, their origin countries, and their percentage of total US IPOs, along with pricing and performance metrics.
IPO, cross-border, US, financial, trends
Multiple Chart
EY
Saved
Text-heavy with table and a bar chart, discussing technology's impact on financial advisors.
Technology and Digital Transformation
Financial Services
Explores how technology will shift the role of financial advisors and the preference for digital solutions.
technology, financial advisors, digital solutions, impact, financial services
Mixed Chart
Deloitte
Saved
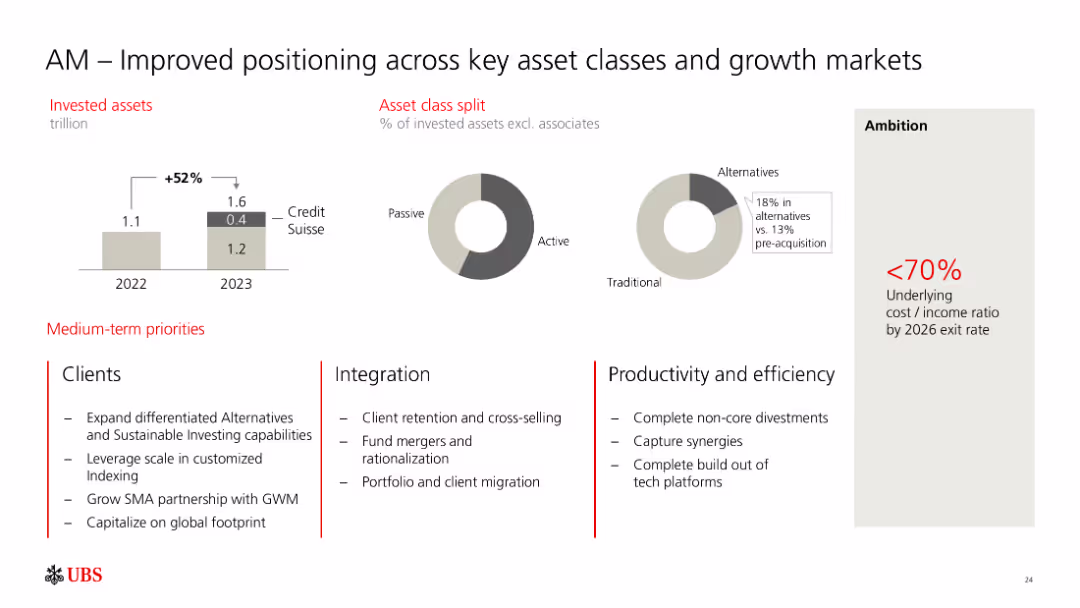
The slide shows bar graphs indicating invested assets growth from 1.1 trillion in 2022 to 1.6 trillion in 2023, including Credit Suisse assets. Pie charts display the asset class split between passive, active, and alternatives. Text outlines medium-term priorities for clients, integration, and productivity.
Market Analysis and Trends
Financial Services
The slide highlights improved positioning of asset management across key asset classes and growth markets. It details asset growth, asset class distribution, and strategic priorities in client services, integration, and productivity. This slide is suitable for discussing asset management strategies and market positioning.
asset management, growth markets, asset classes, strategic priorities, Credit Suisse
Multiple Chart
UBS
Saved
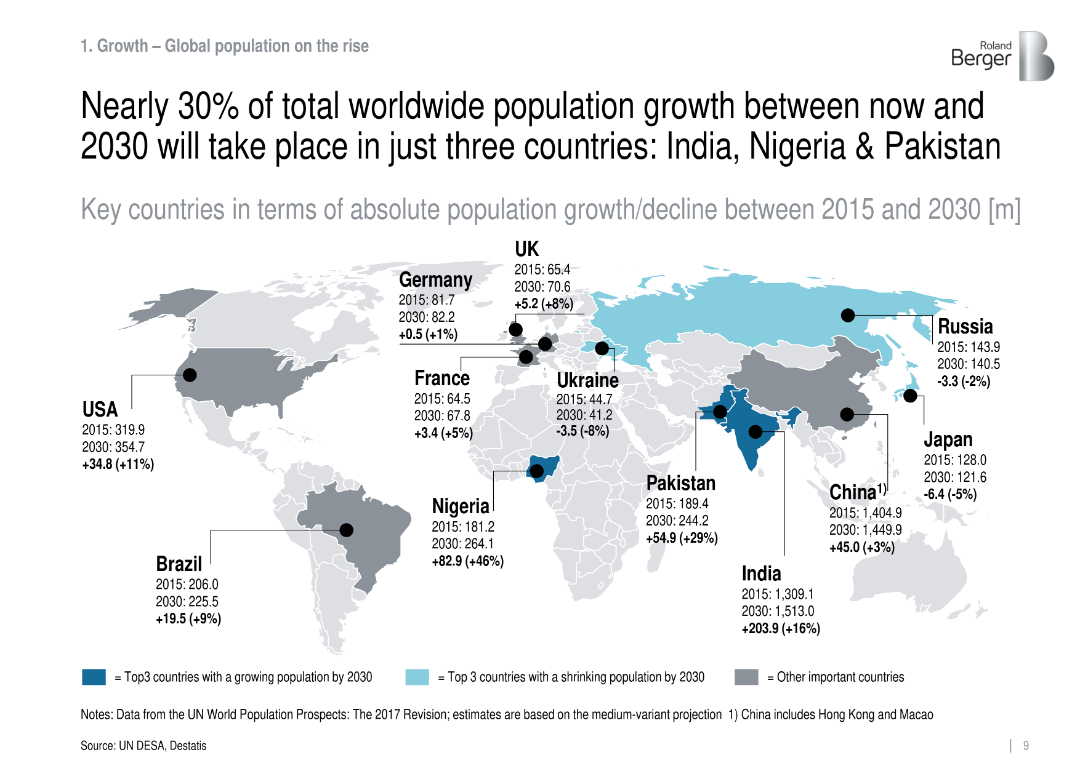
World map with black/blue circle markers indicating population growth/decline per country from 2015 to 2030.
Market Analysis and Trends
Government & Public Sector
The slide visualizes absolute population growth from 2015 to 2030 by country, showing that India, Nigeria, and Pakistan will contribute nearly 30% of global growth. It includes current and projected population figures and percentage change.
population growth, India, Nigeria, Pakistan, demographics, global trends, UN projections, 2030, population distribution
Single Chart
Roland Berger
Saved
Left side shows percentage bubbles, right side has a column chart and text
Technology and Digital Transformation
Technology & Software
Insights into the use of synthetic data for model improvement and efficiency, highlighting challenges
model accuracy, efficiency, synthetic data, challenges
Multiple Chart
Gartner
Saved
Slide displays a vertical bar chart listing supply chain priorities such as cost mitigation and reliability improvements.
Operational Efficiency
Retail & E-commerce
The slide highlights key supply chain management priorities for retailers in 2022, focusing on cost control and improving distribution efficiency.
supply chain, retail, priorities, cost mitigation, efficiency, management, distribution, 2022
Single Chart
Deloitte
Saved
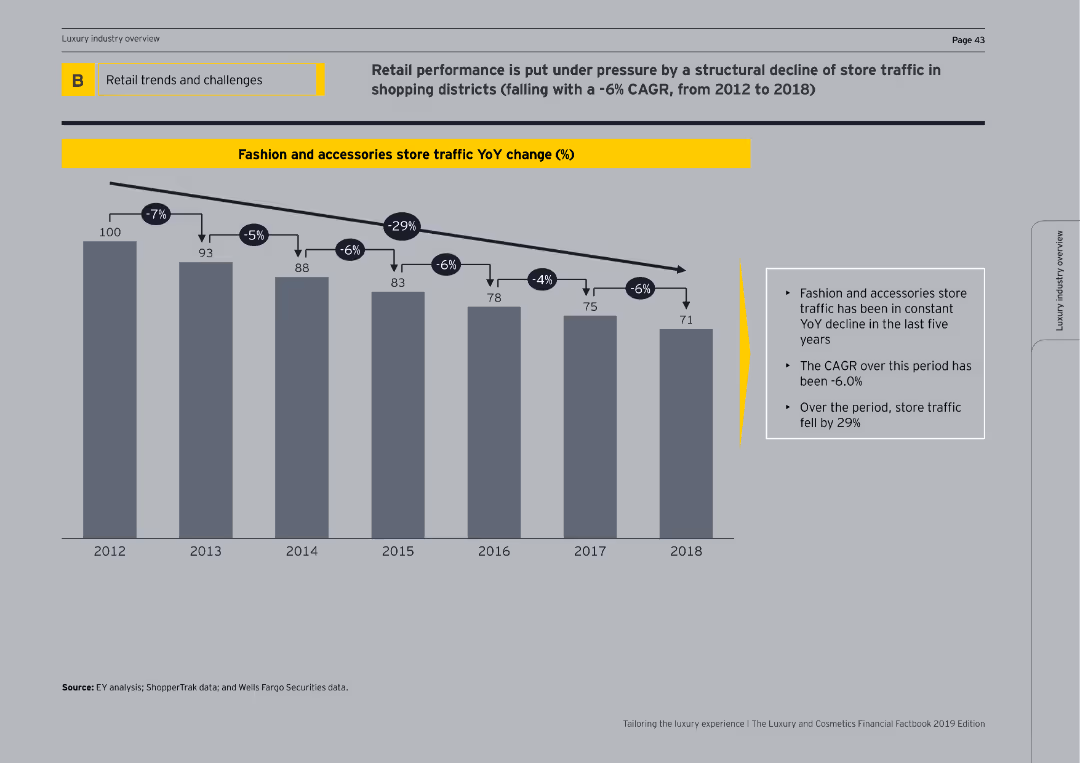
Features a column chart illustrating the year-over-year percentage change in store traffic for fashion and accessories from 2012 to 2018.
Market Analysis and Trends
Retail & E-commerce
Reviews the decline in store traffic for fashion and accessories, showing a -6% CAGR and discussing potential impacts on retail performance.
store traffic, fashion, accessories, YoY change, CAGR, decline, retail performance, column chart, market analysis
Mixed Chart
EY
Saved
The slide presents a graph showing carbon abatement cost versus grid emissions for various business cases in different countries.
Market Analysis and Trends
Energy & Utilities
The slide evaluates the benefits and costs of electrolysis for different applications, emphasizing the impact of a country’s energy mix on its effectiveness.
electrolysis, energy mix, carbon abatement, benefits, country analysis
Single Chart
Kearney
Saved
The slide outlines team, category, and supplier excellence pillars with icons and a diagram of Kearney's House of Purchasing and SupplySM.
Human Resources and Talent Management
Professional Services
It describes the pillars for sustained procurement performance, highlighting the roles of team excellence, category excellence, and supplier excellence.
Team excellence, category excellence, supplier excellence, procurement, performance, talent
Header Vertical
Kearney
Saved
Features a title at the top, two bar graphs in the center comparing consumer habits, and a quote on the right side.
Market Analysis and Trends
Retail & E-commerce
Highlights increasing consumer preference for local products and brands during the pandemic, backed by quantitative data and a personal quote.
consumer trends, local brands, shopping habits, data analysis, pandemic impact, testimonial
Multiple Chart
Accenture
Saved
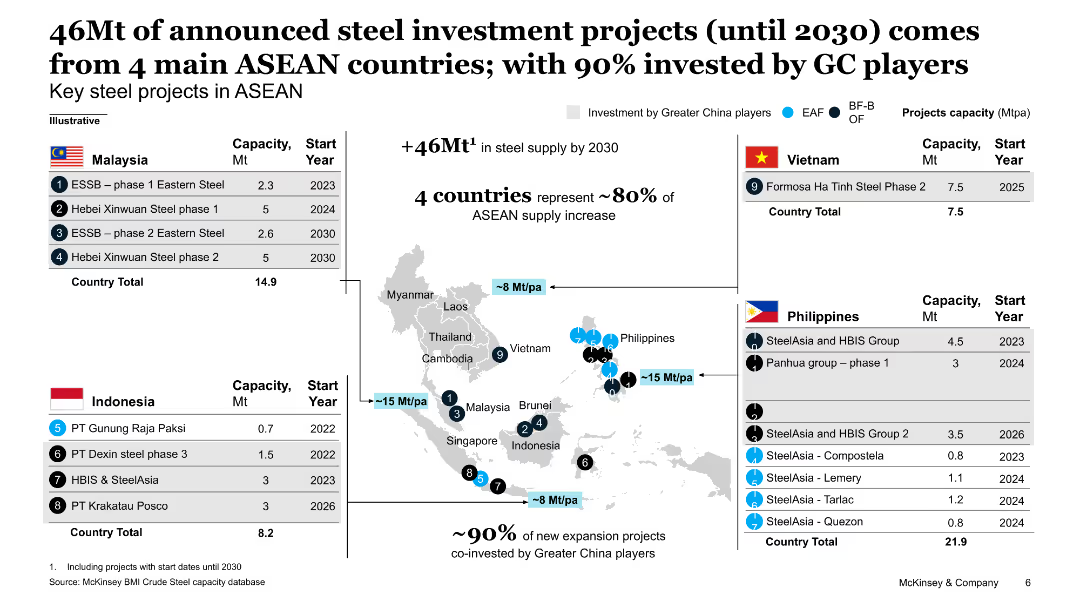
The slide includes a map highlighting key steel projects in ASEAN countries, with accompanying tables listing project capacities and start years.
Investment Analysis
Industrial & Manufacturing
This slide details 46Mt of announced steel investment projects in ASEAN countries, with specific projects listed by country, showing capacities and start years, emphasizing Chinese investment.
steel investment, ASEAN, projects, capacity, Chinese investment
Graphic
McKinsey
Saved
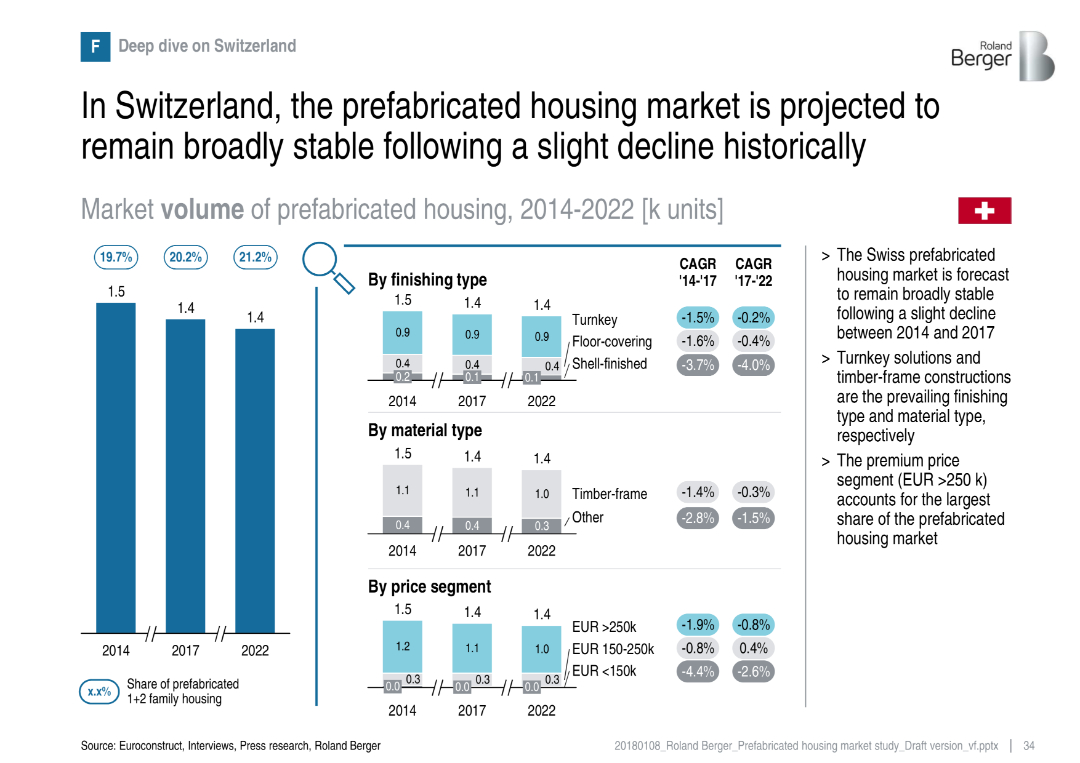
Bar chart and segments showing minor fluctuations; stable forecast emphasized
Market Analysis and Trends
Real Estate & Construction
Switzerland’s prefabricated housing market has declined slightly but is expected to stabilize. The market favors turnkey solutions and premium price segments, with timber-frame as the preferred material.
Switzerland, stability, prefabricated, turnkey, timber-frame, market trends
Multiple Chart
Roland Berger
Saved
The slide features three charts: a line chart of the US manufacturing PMI subindexes, a line chart of the Global supply chain pressure index, and a line chart of the Global trade openness index. The layout is clean and uses a consistent blue and white color scheme.
Risk Assessment and Management
Transportation & Logistics
The slide highlights global supply chain vulnerabilities due to pandemic disruptions, geopolitical tensions, and increased international fragmentation, supported by data on US manufacturing PMI, global supply chain pressure, and trade openness.
supply chain, pandemic, geopolitical, fragmentation, trade
Multiple Chart
EY
Saved
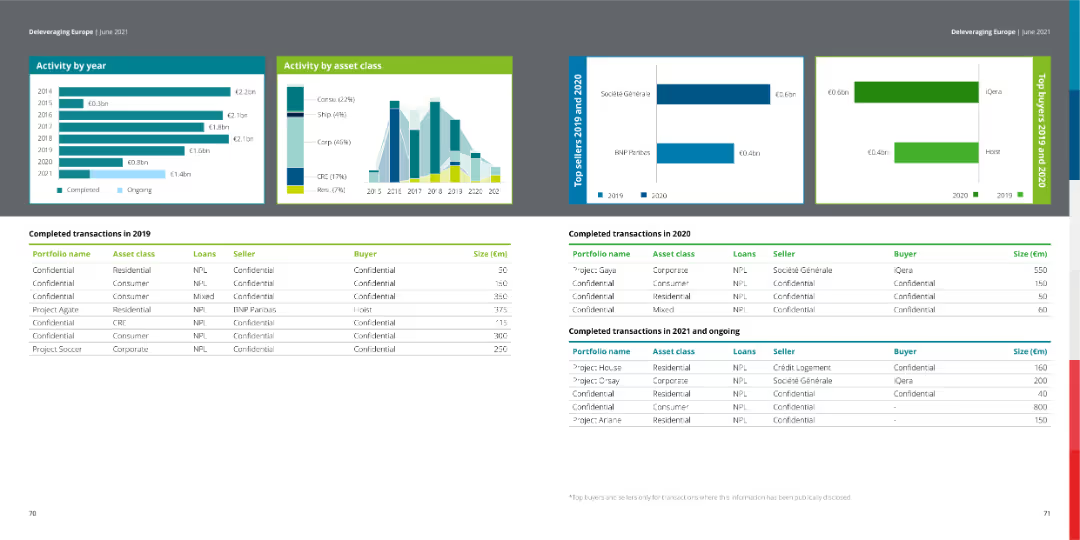
The slide features column charts for activity by year and asset class, with tables listing completed transactions for 2019 and 2020.
Financial Performance
Financial Services
This slide provides an overview of completed transactions in 2019, showcasing activity by year and asset class in financial terms.
transactions, financial services, column chart, asset class, activity
Multiple Chart
Deloitte
Saved
Contains bar charts showing the percentage of time spent on various activities, segmented by line of business and average account premium.
Operational Efficiency
Financial Services
Details time allocation for different types of activities by insurance underwriters, segmented by line of business and premium size, offering insights into operational focus and efficiency.
time allocation, insurance, operational efficiency, business lines, account premiums, risk analysis, sales negotiations
Multiple Chart
Accenture
Saved
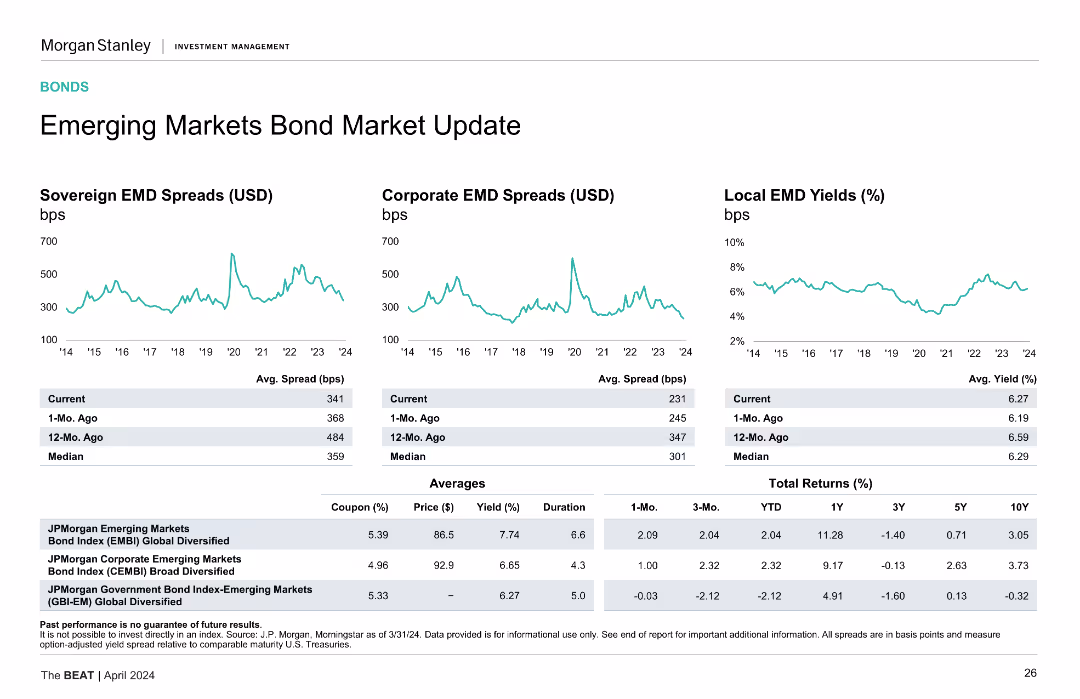
Line charts showing sovereign, corporate, and local EMD spreads and yields over time, with tables for average spreads and returns.
Market Analysis and Trends
Financial Services
Discusses the emerging markets bond market, analyzing sovereign, corporate, and local bond yields and spreads.
Emerging Markets, Bond Spreads, Sovereign Bonds, Corporate Bonds, Yields
Multiple Chart
Morgan Stanley
Saved
Text-heavy, detailing the benefits of integrating different GBS functions across a unified platform and a column chart
Operational Efficiency
Professional Services
Discusses cross-functional improvements, data integrity, and reduced handoffs in GBS operations.
cross-functional, GBS, improvements, data integrity, efficiency
Mixed Chart
Deloitte
Saved
Bar chart presenting future plans of refugees regarding their stay in Poland.
Strategic Planning
Government & Public Sector
Analyzes the future intentions of refugees in Poland based on survey data.
refugees, future plans, Poland, survey data
Single Chart
Deloitte
Saved
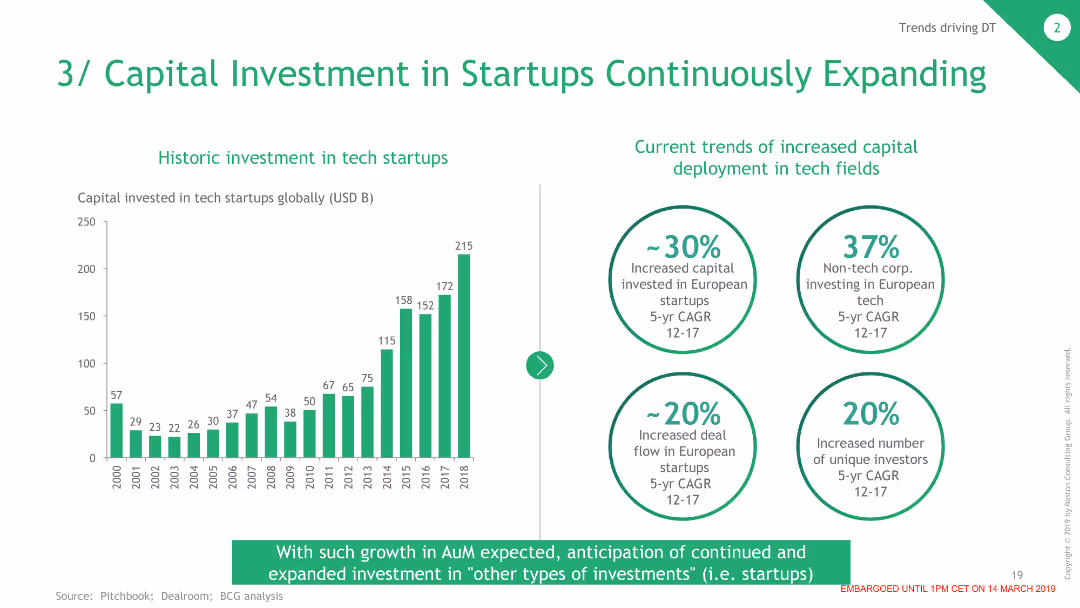
The slide contains a column chart on the left showing historic investments in tech startups and four circular data points on the right summarizing current trends in capital investment.
Investment Analysis
Financial Services
This slide shows the growth in capital investment in tech startups over time and highlights significant trends in increased investment and deal flow in European startups.
Investment, Startups, Capital, Trends, Financial
Mixed Chart
BCG
Saved
This slide includes tables comparing ownership structure, geographic footprint, port terminals, and recent investments of three major bulk handlers.
Competitive Landscape
Agriculture & Food Production
The slide compares three major bulk handlers in the grain industry, detailing their ownership, geographic reach, port terminal capacities, and recent investments.
Grain, Bulk Handlers, Comparison, Investment, Port
Multiple Chart
LEK
Saved
Previous
Next
If nothing, comes up, please save your slides first
Create a FREE account to continue browsing
Receive Instant Access to 1,000+ slides from companies like McKinsey, Google, and Goldman Sachs
First Name
Last Name
Email
Password
I agree to all
Terms & Privacy Policy
Thank you! Your submission has been received!
Oops! Something went wrong while submitting the form.
Have an account?
Sign in
Column Chart
Heatmap
Chevron
Org Chart
Infographic
Callouts
Timeline
List
Graphic
Picture
Process Flow
Diagram
Paragraph
Map
Table
Framework
Subtitle
Takeaway Box
Icon
Other Chart
Radar Chart
Waterfall Chart
Mekko Chart
Pie Chart
Scatter Plot
Line Chart
Bar chart
Bullet points