My Account
My Slides
Search by Category
Templates
Leave Feedback
Login
Logout
Get Started
Browse all Slides
Browse all Slides
Create a FREE Account
Instant access to 1,000+ real slides from top companies like McKinsey, BCG, Goldman Sachs, Google and many more!
First Name
Last Name
Email
Password
I agree to all
Terms & Privacy Policy
Thank you! Your submission has been received!
Oops! Something went wrong while submitting the form.
Have an account?
Sign in
Saved Slides
Five sections each with an icon and text: Native tokens, Stablecoins & CBDCs, Governance tokens, NFTs, Tokenized real world assets. Icons represent various digital assets.
Product and Service Analysis
Financial Services
Describes five types of digital assets issued on blockchains: native tokens, stablecoins, governance tokens, NFTs, and tokenized real world assets. For product categorization in blockchain services.
Digital Assets, Blockchain, NFTs, Stablecoins, Governance, Tokenization, Real World Assets
Table
McKinsey
Saved
A slide with a night traffic long exposure image, bar graphs, and detailed text analysis of investment trends.
Investment Analysis
Technology & Software
Reviews significant investment trends in Southeast Asia's technology sector, with a focus on venture capital and private equity.
Investment Trends, Southeast Asia, Venture Capital, Private Equity, Technology Sector, Market Growth
Mixed Chart
Bain
Saved
A comparative slide with a two-column list ranking barriers to adoption by geography, complemented by side notes highlighting regional nuances.
Strategic Planning
Technology & Software
Highlights the regional differences in barriers to digital adoption between Java and non-Java areas, emphasizing the importance of a localized approach for startups and investors.
digital adoption, regional barriers, Java, non-Java, Indonesia, startups, investors
Table
Kearney
Saved
The slide contains a flowchart illustrating the components of the market model, including vehicle production volumes, hydrogen penetration rates, and market value calculation.
Strategic Planning
Financial Services
Describes the framework for building the market model based on expert views, covering key factors like production volumes and hydrogen capacity per vehicle.
market model, hydrogen, vehicle production, penetration rate, market value, framework, calculation, expert views
Diagram
Roland Berger
Saved
The slide has several bar charts comparing consumer attitudes in Germany, the US, and China on various aspects such as safety, willingness to pay for connected services, and opinions on BEV cars.
Market Analysis and Trends
Consumer Goods
This slide summarizes the latest consumer attitudes in CASE (Connected, Autonomous, Shared, and Electric) across Germany, the US, and China, focusing on safety, navigation, and preferences for connected car services.
consumer attitudes, CASE, market trends, Germany, US, China, safety, connected services, bar charts
Multiple Chart
PwC/Strategy&
Saved
The slide utilizes a series of column charts to illustrate quarterly income, costs, and other financial metrics, with an emphasis on impairment costs and its impact on profitability.
Financial Performance
Financial Services
Evaluates the financial performance of the Consumer, Cards & Payments segment, particularly the effects of increased impairments on profitability and returns.
financial performance, CC&P, RoTE, impairment, profitability, Q423, Barclays, costs, income
Multiple Chart
Barclays
Saved
Displays tiered categorization of industries and a table detailing duration of tax incentives based on location and industry tier.
Investment Analysis
Financial Services
Discusses the structure and duration of tax incentives for enterprises across different industry tiers and geographical locations.
tax incentives, industries, tiers, duration, CREATE, investment, Philippines
Table
Deloitte
Saved
The slide presents a world map with circular diagrams illustrating the geographical distribution of company assets, alongside statistical information in bullet points and percentage figures. The map uses different colors to represent various regions. Text boxes with additional information about the company's global presence are strategically placed around the map.
Market Analysis and Trends
Industrial & Manufacturing
The slide provides an overview of the company's global presence and balance in geographical distribution, with a focus on Europe, North America, China, and other regions. Key statistics such as the number of plants and R&D centers, along with the percentage of economic revenue per region, are shared. It may serve as an analysis tool for discussing market presence or expansion strategies.
Global, Distribution, Plants, R&D, Geography, Percentages, Map, Industrial, Revenue, Strategy
Multiple Chart
Goldman Sachs
Saved
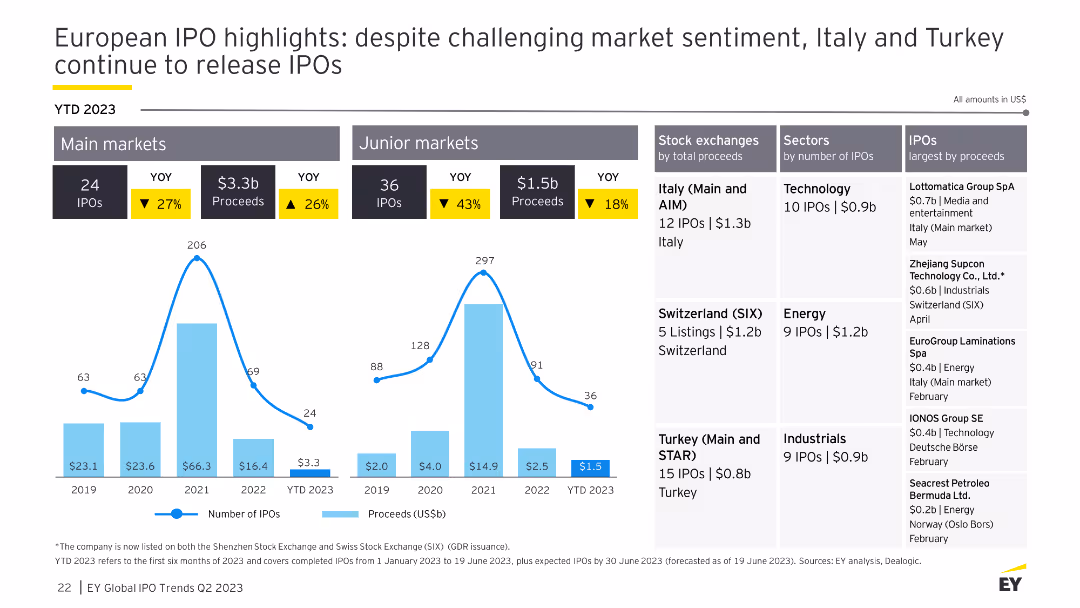
The slide includes column charts for IPO performance in main and junior markets, tables for stock exchanges and sectors, and highlights of the largest IPOs by proceeds.
Market Analysis and Trends
Financial Services
This slide examines the European IPO market, focusing on the challenging market sentiment and the performance of main and junior markets, with details on top exchanges, sectors, and notable IPOs.
IPO, Europe, market sentiment, financial
Multiple Chart
EY
Saved
The slide features a complex line chart tracking the EBITDA multiples over time for different industry sectors. There are four lines representing the medians for Food & Beverage, Industrials, Utilities, and Diversified sectors. Tables with key statistics are positioned at the top right.
Market Analysis and Trends
Technology & Software
This slide presents market performance data for process automation companies, indicating trading ranges of EBITDA multiples and comparing sectors. Useful for financial and market trend analysis.
EBITDA, Market Performance, Process Automation, Financial Analysis, Industry Comparison, Trading Ranges, Sector Median, Utilities, Industrials
Single Chart
LEK
Saved
The slide features a colorful, bullet-list style layout with a central circular logo. It lists financial goals through color-coded bars, with each bar representing a different objective such as revenue growth, efficiency ratio, and customer assets growth.
Strategic Planning
Financial Services
The slide outlines Citibank's financial objectives from 2021 to 2024, with goals like total revenue growth, customer revenue growth, and efficiency improvements. It presents a strategic overview for stakeholders and investors, highlighting key targets such as return on equity, customer assets growth, and maintaining dividend payouts. The simple bullet-list format and the color-coding are designed to facilitate easy understanding of strategic priorities.
financial goals, revenue growth, customer assets, dividends, efficiency, returns, strategic planning, 2021-2024, Citibank
Framework
Citigroup
Saved
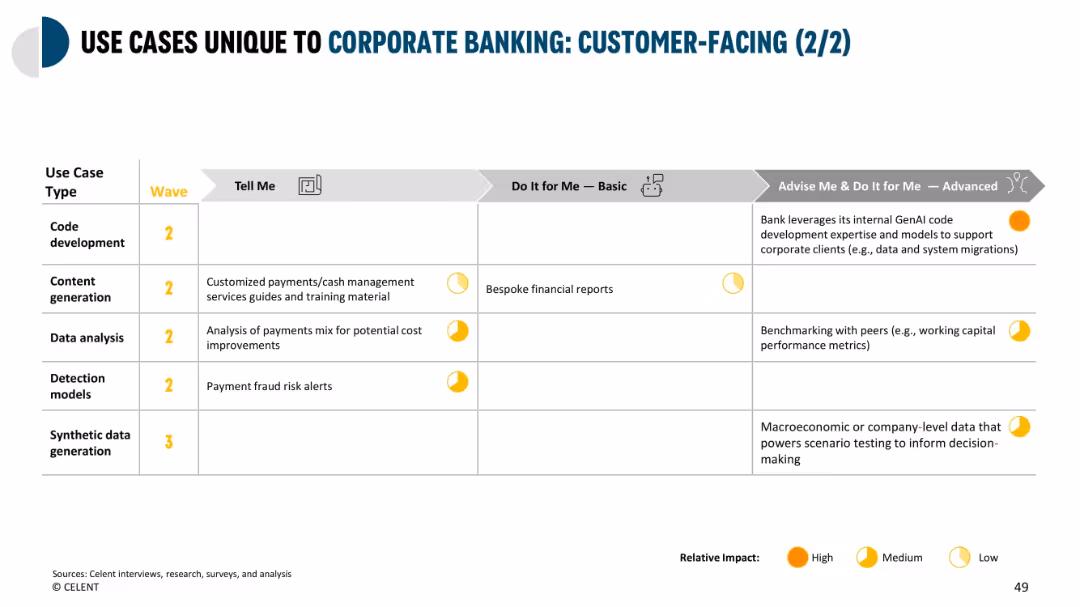
Continuation of the previous matrix; use cases mapped to impact levels across 5 AI use types; clear three-column structure
Product and Service Analysis
Financial Services
Explores AI-powered customer-facing tools in areas such as code development, content creation, fraud detection, data analysis, and macroeconomic scenario testing through synthetic data.
fraud alerts, data analysis, AI automation, GenAI, scenario modeling
Single Chart
Oliver Wyman
Saved
Line chart comparing the trends in purchasing new versus resale homes from Fall 2015 to Fall 2020, with two lines representing each category.
Market Analysis and Trends
Real Estate & Construction
The slide analyzes the preferences between new and resale homes over several years, showing a shift in consumer preferences.
new homes, resale homes, purchase trends, Fall 2015-2020, consumer preferences
Single Chart
IPSOS
Saved
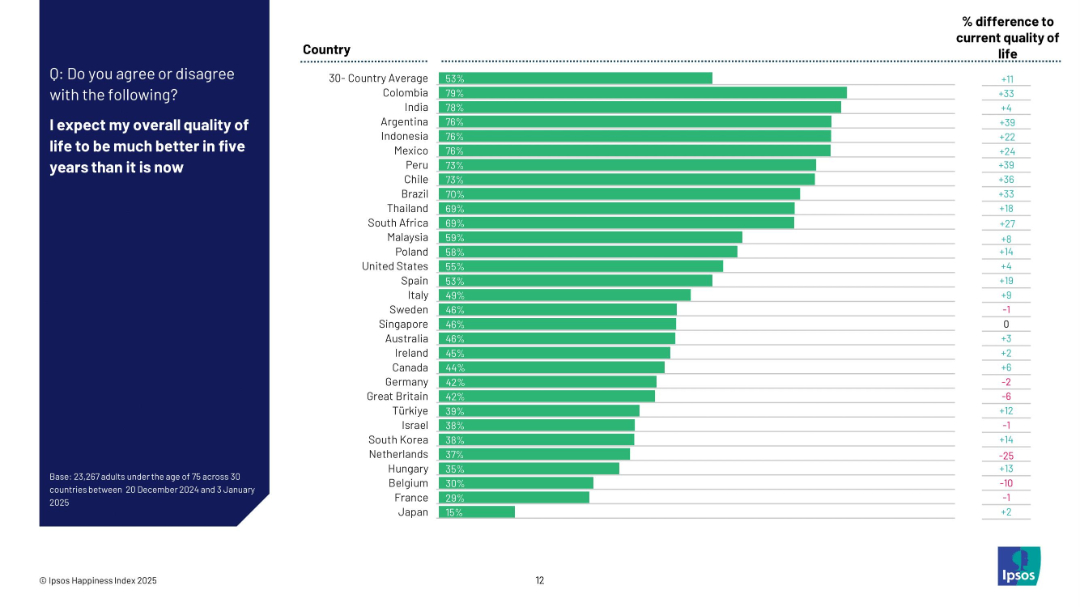
Vertical bar chart with countries ranked by optimism about future quality of life; includes side column with percentage difference from current life assessment.
Market Analysis and Trends
Professional Services
The slide ranks countries based on optimism regarding future quality of life. Colombia, India, and Argentina are the most optimistic, with Japan ranking lowest. It also shows the percentage point difference compared to their current quality of life, highlighting shifts in sentiment.
optimism, future quality of life, Ipsos, expectation, country sentiment, 2025, outlook, survey, global confidence
Mixed Chart
IPSOS
Saved
Pie charts displaying time allocation across various media, accompanied by an image of a person using a smartphone at a concert.
Market Analysis and Trends
Media & Entertainment
The slide discusses the distribution of consumer attention across various digital and traditional media, highlighting the dominance of mobile usage.
digital marketing, consumer attention, media time allocation, mobile usage
Multiple Chart
PwC/Strategy&
Saved
This slide features multiple images, icons, and a pie chart. It visually represents different sectors like energy, technology, and real estate through icons. The design is clear and informative with a focus on significant achievements.
Investment Analysis
Financial Services
Highlights financial contributions and key achievements of Macquarie Capital. It serves as an investment summary and a strategic overview of the company’s performance across various sectors, emphasizing their leading position in global infrastructure and energy financing.
Infrastructure, Investments, Energy, Real Estate, Financial Advising
Mixed Chart
Goldman Sachs
Saved
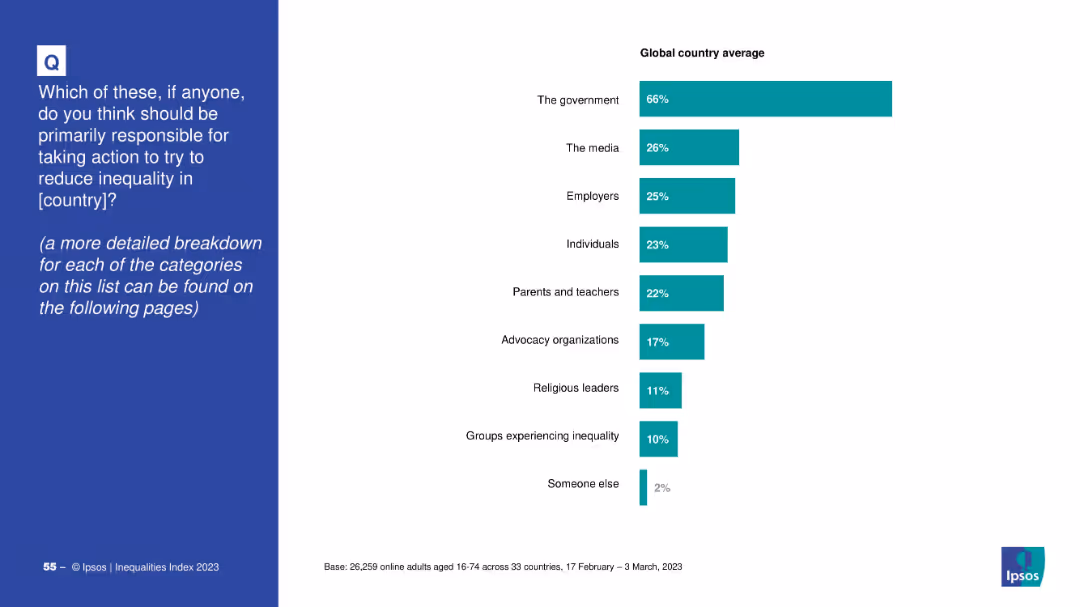
Split slide: left side has question text in a blue box; right side is a horizontal bar chart with global averages.
Market Analysis and Trends
Government & Public Sector
This slide presents global public opinion on who should be primarily responsible for reducing inequality. A horizontal bar chart shows that 66% believe the government should lead, followed by media, employers, and individuals.
inequality, responsibility, government, media, employers, public opinion, global survey, Ipsos, 2023, bar chart
Mixed Chart
IPSOS
Saved
This slide shows a title, two column charts displaying trial lengths for FCoA and FCC, and a pie chart depicting reserved judgments delivery time. It uses red and orange hues with clear labels and a note on trial length comparison.
Regulatory and Compliance
Government & Public Sector
It breaks down the trial lengths for matters heard in FCoA and FCC, the percentage of reserved judgments delivered within three months, and highlights the significant difference in trial lengths between the two courts.
FCoA, FCC, trial lengths, reserved judgments, case management, legal proceedings
Multiple Chart
PwC/Strategy&
Saved
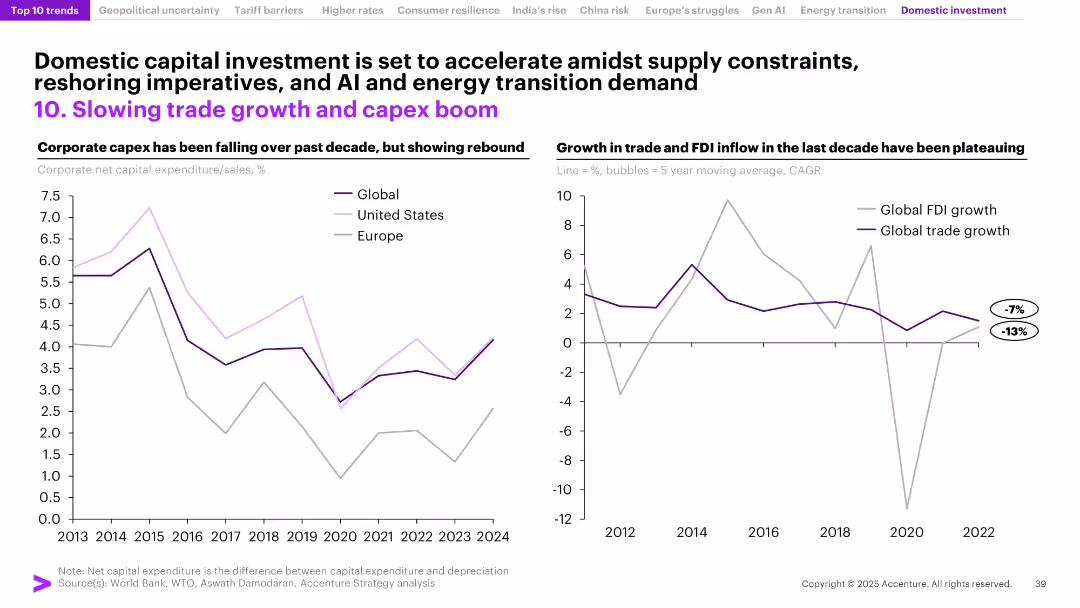
Split into two charts on a white background with black and purple fonts. Left chart shows corporate capex over time for Global, US, and Europe; right chart displays global trade and FDI growth. Title and subheaders are bold with accent color.
Market Analysis and Trends
Financial Services
The slide explores the decline in global trade growth and FDI inflows alongside a decade-long fall in corporate capex, followed by recent rebounds. It emphasizes the need for domestic investment amid global shifts in trade and capital deployment.
Capex, Trade Growth, FDI, Domestic Investment, Global Markets, Rebound, U.S., Europe, CAGR, Investment Trends
Multiple Chart
Accenture
Saved
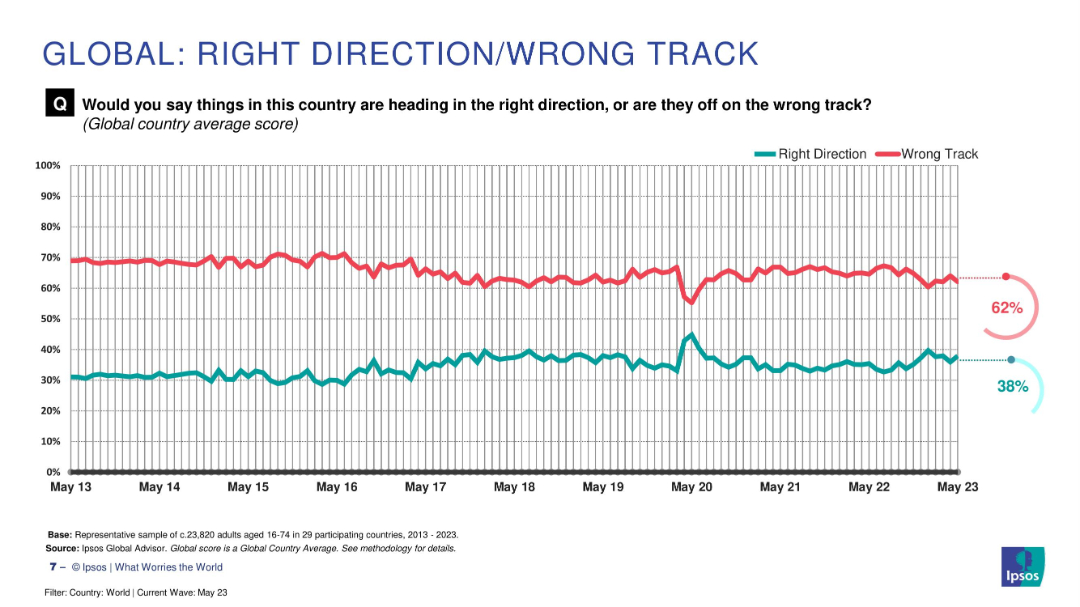
Longitudinal line graph from 2013 to 2023 comparing “Right Direction” vs. “Wrong Track” percentages
Market Analysis and Trends
Government & Public Sector
A long-term trend line illustrating global average perception of national direction over 10 years. "Wrong Track" has consistently remained higher than "Right Direction", although the latter shows recent modest gains. The gap has narrowed slightly but remains significant.
trend, decade, direction, sentiment, wrong track
Multiple Chart
IPSOS
Saved
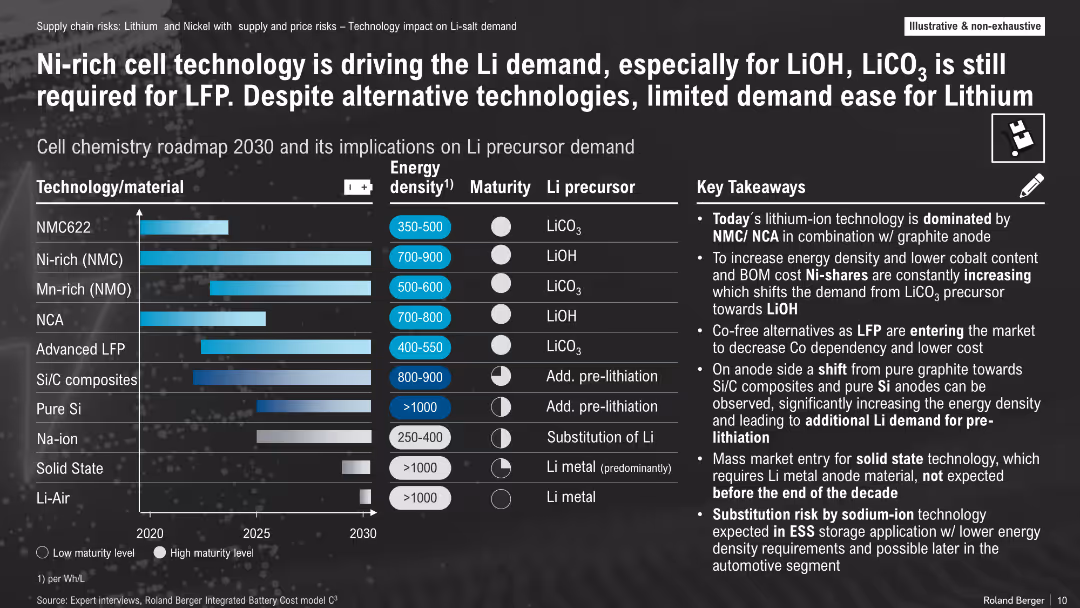
Matrix of technologies vs. energy density, maturity, and lithium precursor types; bulleted takeaways
Product and Service Analysis
Energy & Utilities
The slide analyzes Li-ion technologies by chemistry and lithium precursor dependency, with Ni-rich cells pushing demand for LiOH. Despite LFP and emerging solid-state/Na-ion alternatives, lithium demand remains high.
lithium precursor, NMC, LFP, LiOH, LiCO₃, battery chemistry, roadmap
Multiple Chart
Roland Berger
Saved
Contains a column chart showing responses from 2013-2018 regarding the economic outlook for industries in France, accompanied by quotes from industry leaders.
Market Analysis and Trends
Professional Services
Analyzes perceptions of economic outlook over time among professionals in France, showing more optimism in recent years despite global uncertainties.
economic outlook, France, industry analysis, business sentiment, global impact
Mixed Chart
Bain
Saved
Contains bar charts detailing macroeconomic concerns by region.
Risk Assessment and Management
Financial Services
Analyzes executive concerns about macroeconomic factors like inflation and supply chain disruptions, with a focus on differences across North America, Europe, and Asia.
macroeconomic, inflation, supply chain, concerns, regions
Multiple Chart
BCG
Saved
The slide contains a bar chart showing fixed income yields to maturity for different bond categories, divided into developed market government bonds, investment-grade bonds, high yield bonds, and Asia & emerging market bonds.
Financial Performance
Financial Services
This slide provides an overview of global fixed income yields and duration, highlighting yields to maturity for various bond categories. It is used for financial performance evaluation and fixed income strategy planning.
Global fixed income, yields, duration, bonds, investment-grade, high yield, emerging markets
Multiple Chart
JP Morgan
Saved
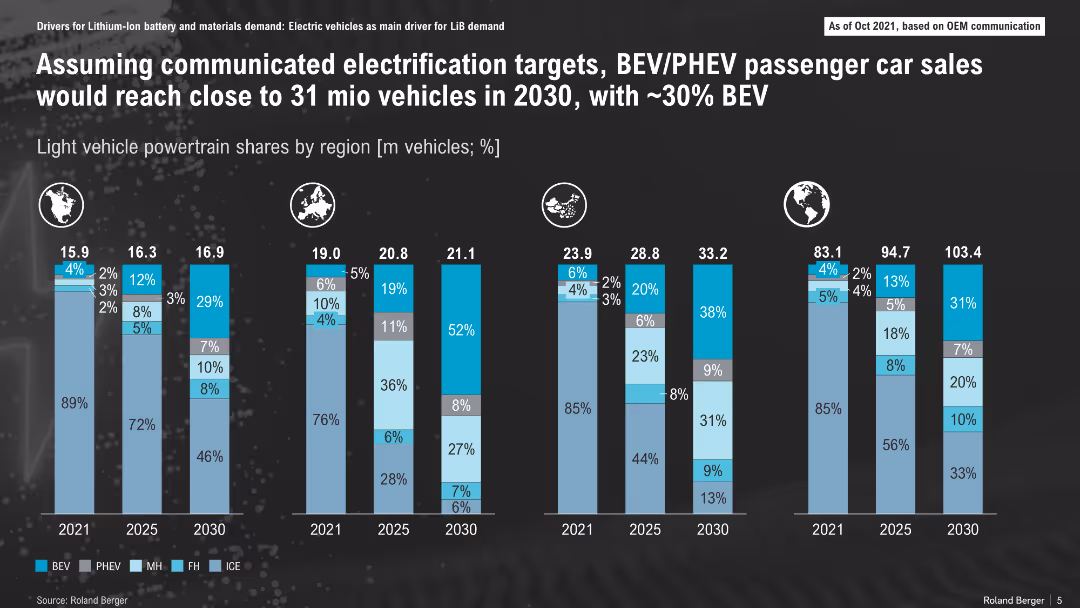
Multiple regional stacked bar charts showing EV powertrain mix forecast through 2030
Market Analysis and Trends
Transportation & Logistics
The slide forecasts EV adoption by region through 2030, indicating rising BEV and PHEV market shares, with BEV expected to hit ~30%. Europe leads in adoption while internal combustion engine (ICE) dominance continues in some regions through 2025.
BEV, PHEV, ICE, electrification, EV market, regional forecast, vehicle sales
Single Chart
Roland Berger
Saved
Previous
Next
If nothing, comes up, please save your slides first
Create a FREE account to continue browsing
Receive Instant Access to 1,000+ slides from companies like McKinsey, Google, and Goldman Sachs
First Name
Last Name
Email
Password
I agree to all
Terms & Privacy Policy
Thank you! Your submission has been received!
Oops! Something went wrong while submitting the form.
Have an account?
Sign in
Column Chart
Heatmap
Chevron
Org Chart
Infographic
Callouts
Timeline
List
Graphic
Picture
Process Flow
Diagram
Paragraph
Map
Table
Framework
Subtitle
Takeaway Box
Icon
Other Chart
Radar Chart
Waterfall Chart
Mekko Chart
Pie Chart
Scatter Plot
Line Chart
Bar chart
Bullet points