My Account
My Slides
Search by Category
Templates
Leave Feedback
Login
Logout
Get Started
Browse all Slides
Browse all Slides
Create a FREE Account
Instant access to 1,000+ real slides from top companies like McKinsey, BCG, Goldman Sachs, Google and many more!
First Name
Last Name
Email
Password
I agree to all
Terms & Privacy Policy
Thank you! Your submission has been received!
Oops! Something went wrong while submitting the form.
Have an account?
Sign in
Saved Slides
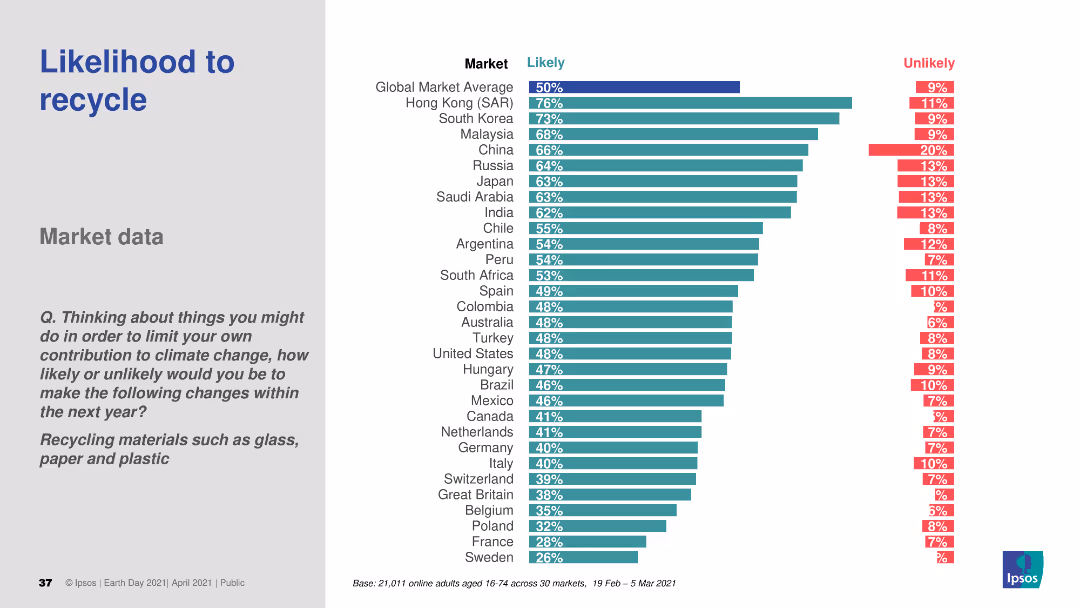
A bar chart (horizontal) illustrating the likelihood of recycling behaviors across various countries. Different colors represent likely and unlikely responses.
Market Analysis and Trends
Environmental Services & Sustainability
This slide provides a comparative analysis of consumer recycling behaviors. It highlights the likelihood of recycling materials like glass, paper, and plastic, offering insights into environmental awareness and practices.
recycling, consumer behavior, sustainability, environmental awareness, comparative data
Multiple Chart
IPSOS
Saved
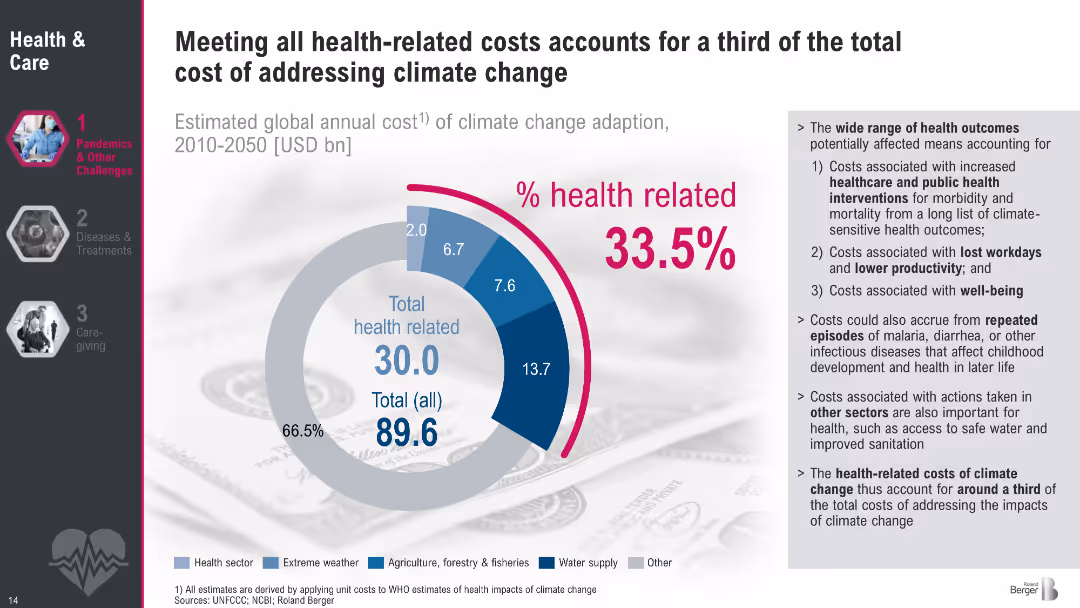
Donut chart showing health-related costs as part of climate change adaptation. Sidebar lists sources of health-related costs.
Strategic Planning
Healthcare & Pharmaceuticals
This slide presents a financial analysis of health-related costs within the broader climate adaptation budget. It reveals that health-related interventions comprise 33.5% of total adaptation costs from 2010–2050. It breaks down contributing factors such as healthcare interventions, productivity loss, and indirect costs from repeated infectious diseases and sanitation issues.
Health spending, climate adaptation, costs, interventions, sanitation, productivity, global health
Mixed Chart
Roland Berger
Saved
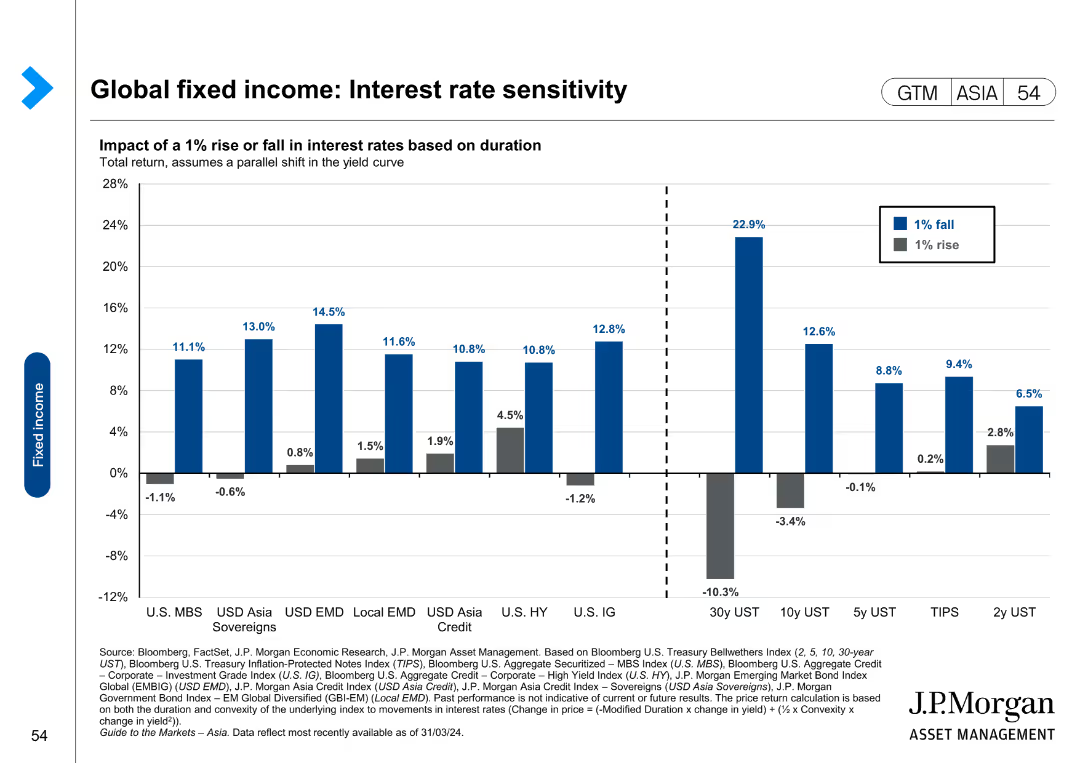
The slide features a bar chart showing the impact of a 1% rise or fall in interest rates on total return across various fixed income categories.
Risk Assessment and Management
Financial Services
This slide analyzes interest rate sensitivity for global fixed income investments, illustrating the impact of interest rate changes on total returns. It is used for risk assessment and management.
Global fixed income, interest rate sensitivity, total return, risk assessment, management
Single Chart
JP Morgan
Saved
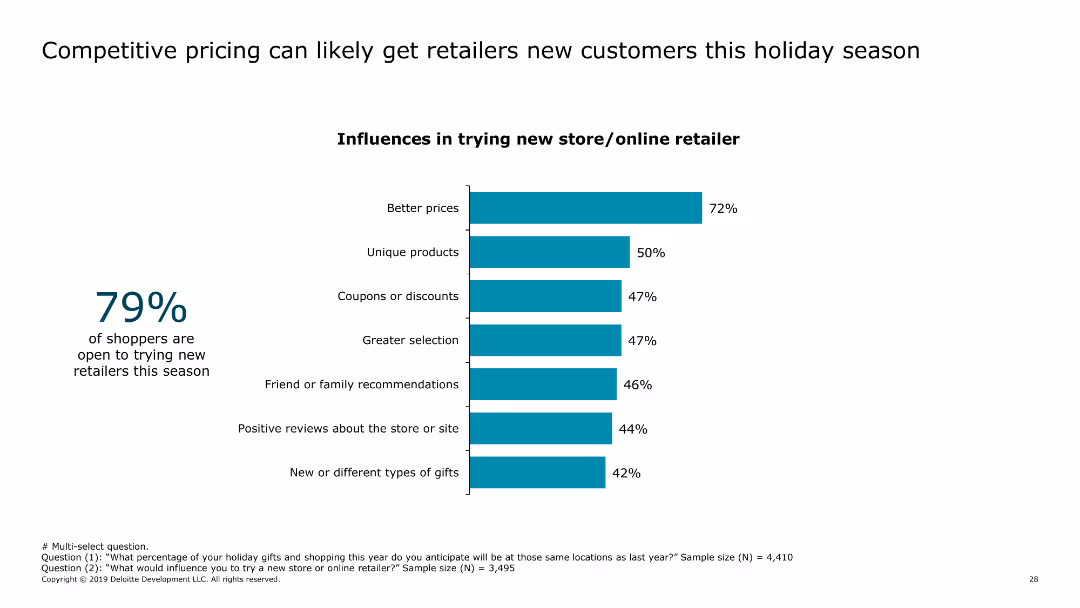
The slide contains a column chart showing factors that influence consumers to try new stores or online retailers, such as better prices, unique products, coupons or discounts, and greater selection.
Market Analysis and Trends
Retail & E-commerce
The slide emphasizes the impact of competitive pricing and unique product offerings on attracting new customers, particularly during the holiday season.
competitive pricing, consumer attraction, new customers, holiday shopping, retail strategy
Mixed Chart
Deloitte
Saved
The slide features a red background with white text on the left, and two pie charts with accompanying text on the right. The layout includes a quote at the bottom right. The pie charts use red and gray colors to highlight key statistics.
Risk Assessment and Management
Financial Services
The slide discusses the low levels of cyber risk maturity among companies and highlights key statistics and quotes to emphasize the importance of improving cyber risk management.
cyber risk, maturity, companies, statistics, management, improvement, challenges, future, growth
Multiple Chart
PwC/Strategy&
Saved
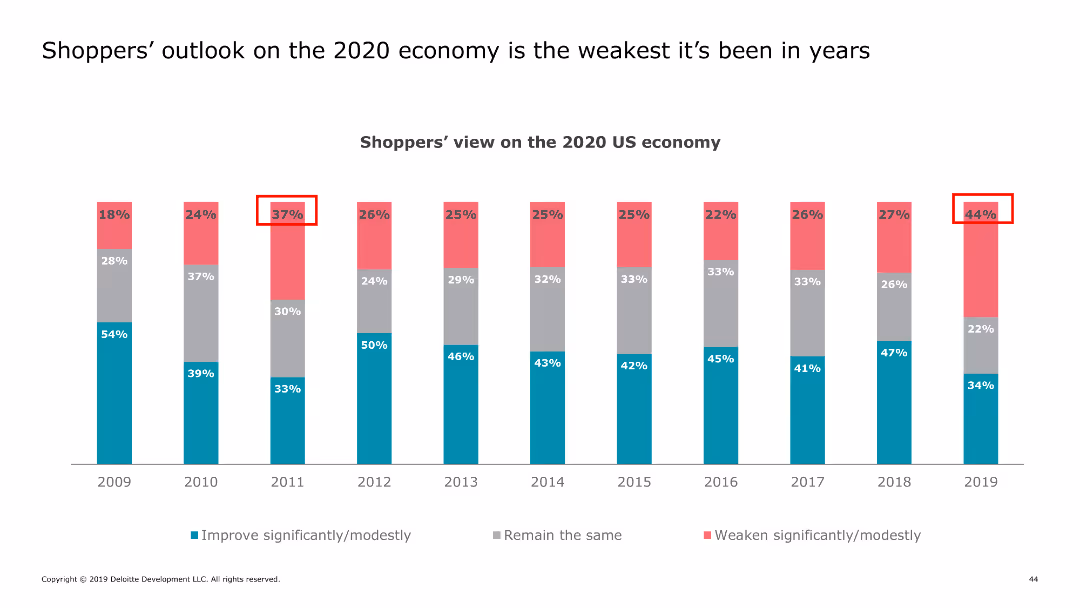
This slide presents a column chart tracking shoppers' views on the US economy over multiple years, with emphasis on the 2020 outlook. Different colors represent different levels of optimism.
Market Analysis and Trends
Retail & E-commerce
It reviews the declining optimism of shoppers regarding the US economy for the year 2020, compared to previous years, indicating a weak economic outlook.
economy, outlook, shoppers, US, trends
Single Chart
Deloitte
Saved
A scatter plot similar to the IT intensity slide, but focused on cloud intensity. It compares IT spending per employee and value-added per employee, with countries grouped and color-coded.
Market Analysis and Trends
Technology & Software
The slide evaluates cloud intensity by country, comparing IT spending on cloud services to the economic value added per employee, useful for understanding global cloud adoption.
Cloud Intensity, Country Analysis, Cloud Spending, Economic Value, International Comparison
Single Chart
Gartner
Saved
Provides insights into digital advertising strategies with column charts showing growth rates in digital communication spending across different industries, focusing on social media and video platforms.
Market Analysis and Trends
Media & Entertainment
Explores how different industries are uniquely increasing their digital advertising efforts, particularly through social media and video, highlighting the universal shift towards these platforms.
digital advertising, industry trends, social media, video platforms, marketing strategies
Mixed Chart
Bain
Saved
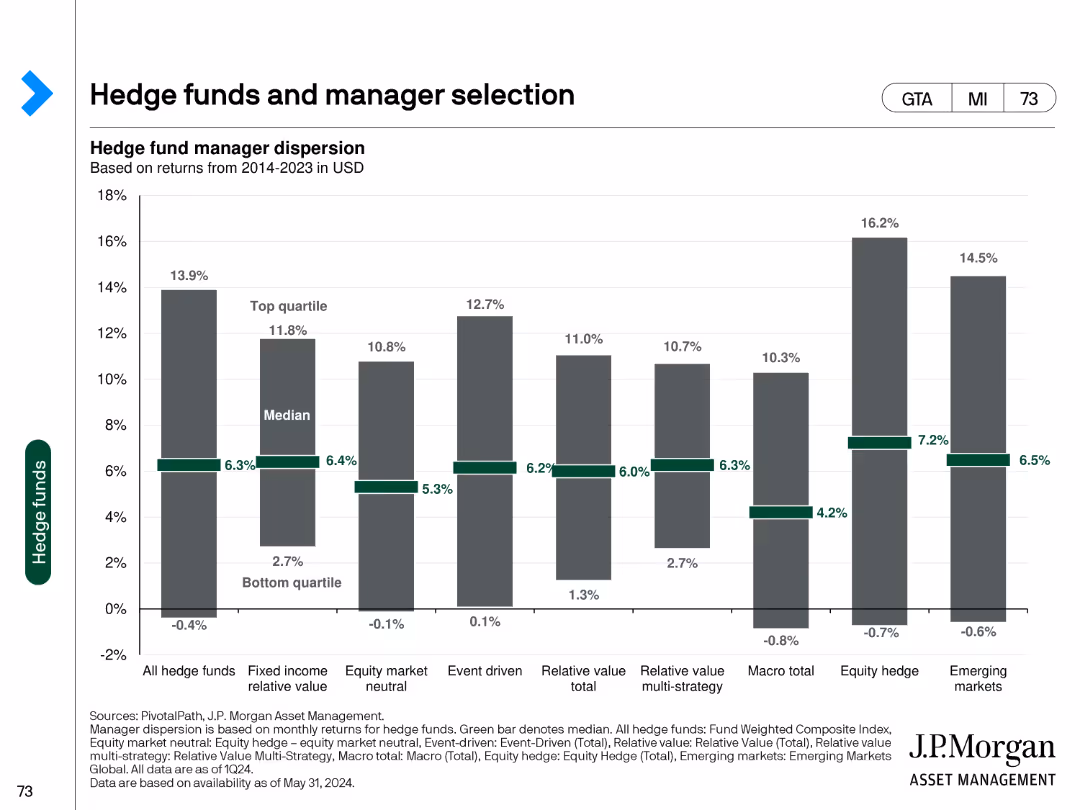
This slide features a column chart showing hedge fund manager dispersion based on returns from 2014-2023 in USD. It compares the performance of top quartile, median, and bottom quartile managers across different hedge fund strategies.
Investment Analysis
Financial Services
The slide examines hedge fund performance dispersion, providing a comparative analysis of returns across various hedge fund strategies over a multi-year period.
hedge funds, manager selection, returns, performance, dispersion
Single Chart
JP Morgan
Saved
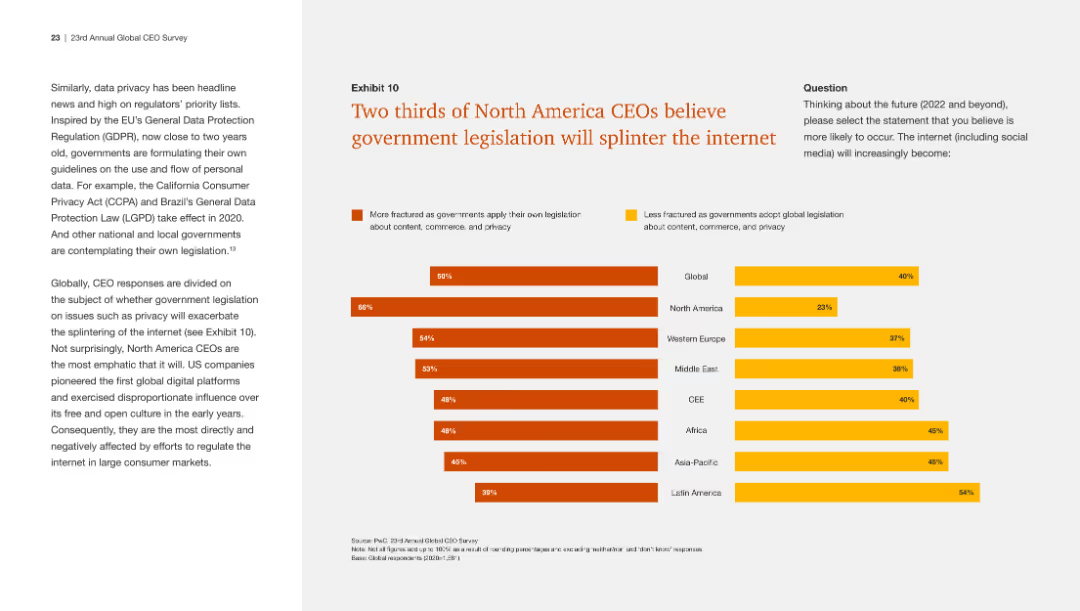
This slide features a bar chart showing regional differences in CEO opinions on whether government legislation will fracture the internet. It is detailed and visually organized.
Regulatory and Compliance
Technology & Software
The slide indicates that a significant portion of North American CEOs believe government legislation will lead to a fragmented internet, compared to other regions.
Internet, legislation, North America, CEO opinions, government
Multiple Chart
PwC/Strategy&
Saved
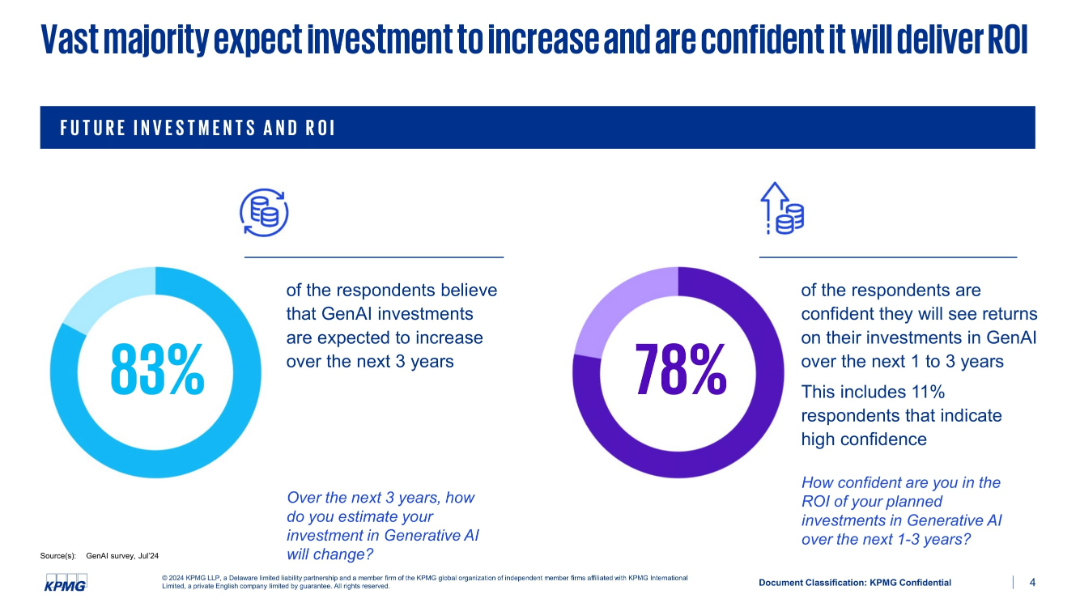
Dual pie chart-style graphics with brief explanations; simple layout with bold percentage visuals; header emphasizes future expectations.
Investment Analysis
Artificial Intelligence
Presents optimism surrounding GenAI investments. 83% believe investments will increase over 3 years; 78% are confident in achieving ROI. Shows growing strategic confidence in the value proposition of GenAI amid rising enterprise focus.
GenAI investment, ROI, future planning, strategic confidence, AI return, tech funding, survey results
Single Chart
KPMG
Saved
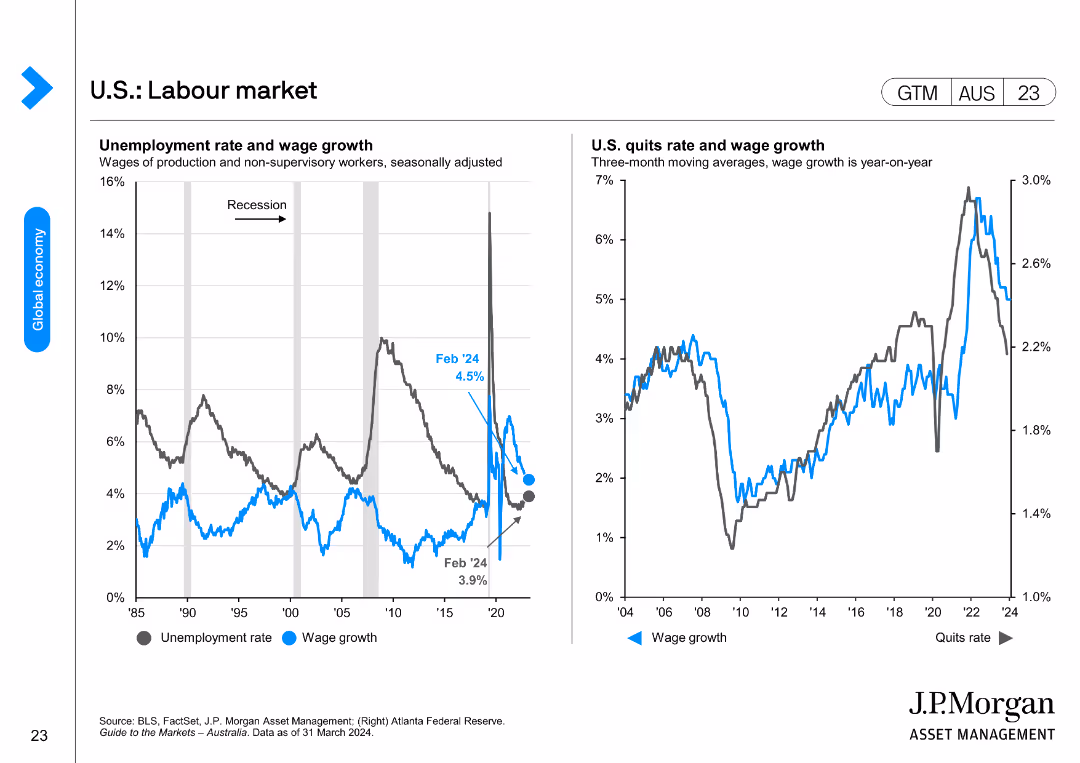
The slide contains two line charts. The left chart shows the U.S. unemployment rate and wage growth from 1985 to 2024. The right chart depicts the U.S. quits rate and wage growth year-on-year from 2004 to 2024.
Market Analysis and Trends
Financial Services
This slide analyzes the U.S. labor market by examining unemployment, wage growth, and quits rate, providing insights into employment trends and economic conditions.
Labor Market, Unemployment, Wage Growth, U.S., Trends
Multiple Chart
JP Morgan
Saved
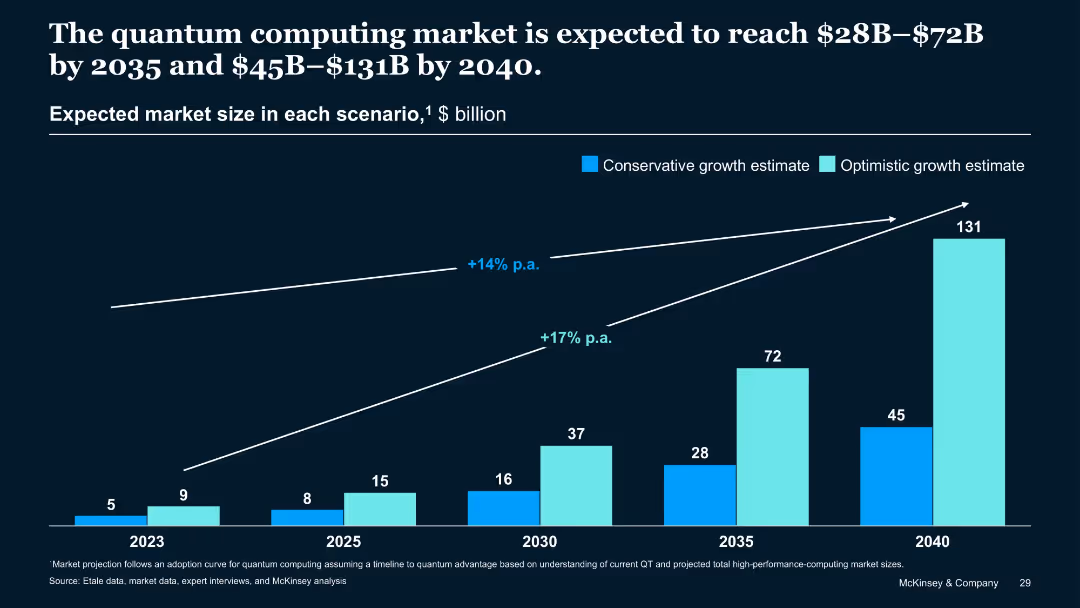
Line and bar graph tracking expected market size in billions through 2040
Market Analysis and Trends
Artificial Intelligence
The graph projects quantum computing market growth from 2023 to 2040 under two scenarios. The optimistic case reaches $131B by 2040, while the conservative path ends at $45B, with annual growth rates of 14–17%.
Quantum Computing, Market Growth, Forecast, Investment Scenarios, Trends
Single Chart
McKinsey
Saved
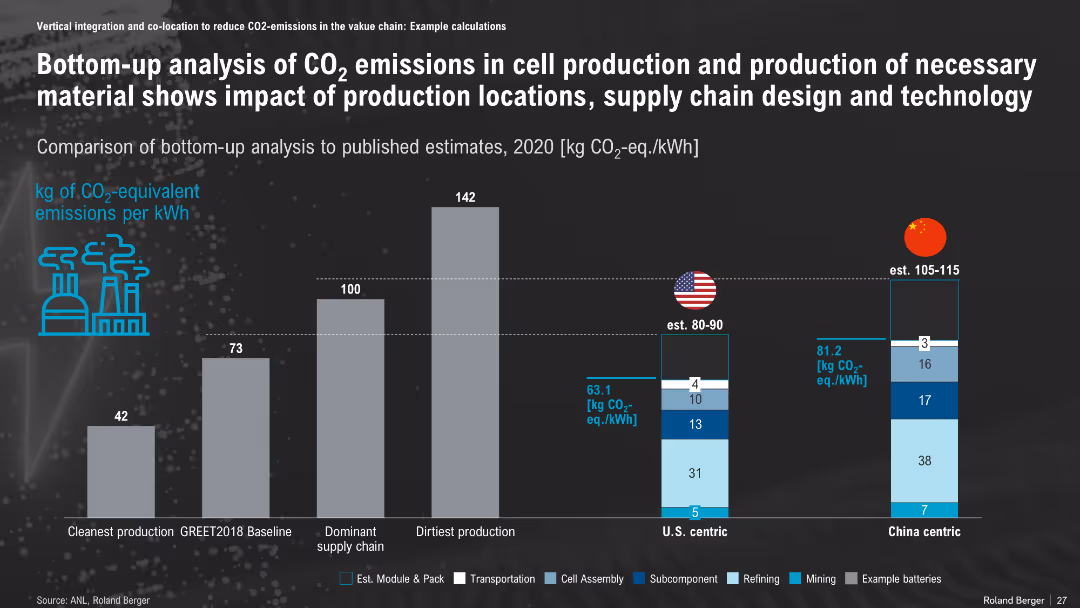
Vertical bar comparison of CO₂ emissions across scenarios; includes breakdown by activity (e.g., mining, refining); iconography emphasizes environmental impact
Risk Assessment and Management
Environmental Services & Sustainability
This slide compares CO₂ emissions across battery production supply chains, showing lower emissions in U.S.-centric vs. China-centric or worst-case scenarios. It supports environmentally conscious production planning by highlighting regional impact variations.
CO₂ Emissions, Battery Production, Supply Chain, U.S., China, Emission Breakdown, Climate Impact
Single Chart
Roland Berger
Saved
Combination of bar charts, textual data, and statistical outlines, highlighting various performance and demographic metrics, including an engagement index and gender distribution in hiring.
Strategic Planning
Professional Services
Provides a detailed look at key performance and operational statistics for a consultancy, including engagement, audit outcomes, and employee demographics.
key statistics, performance, demographics, bar chart
Multiple Chart
PwC/Strategy&
Saved
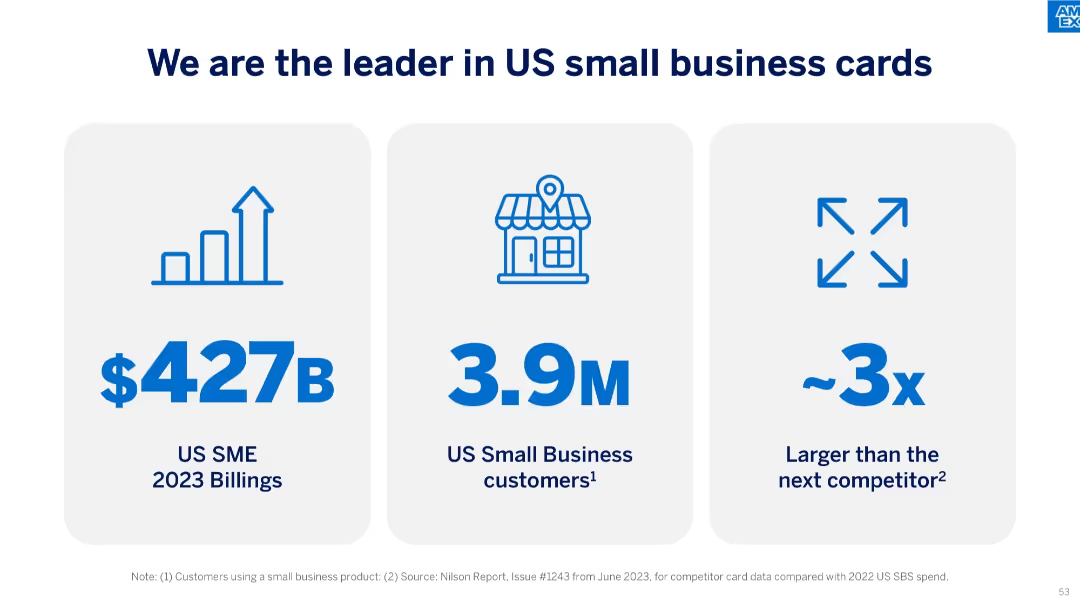
A 3-column layout using icons and large text, showing 2023 US SME billings, customer count, and scale vs. competition.
Strategic Planning
Financial Services
This slide emphasizes American Express’ leadership in the small business card sector, highlighting $427B in 2023 billings, 3.9M customers, and being roughly three times larger than the next competitor.
leadership, SME, billings, customer base, scale advantage, US market, credit cards, strategic positioning
Pillar
McKinsey
Saved
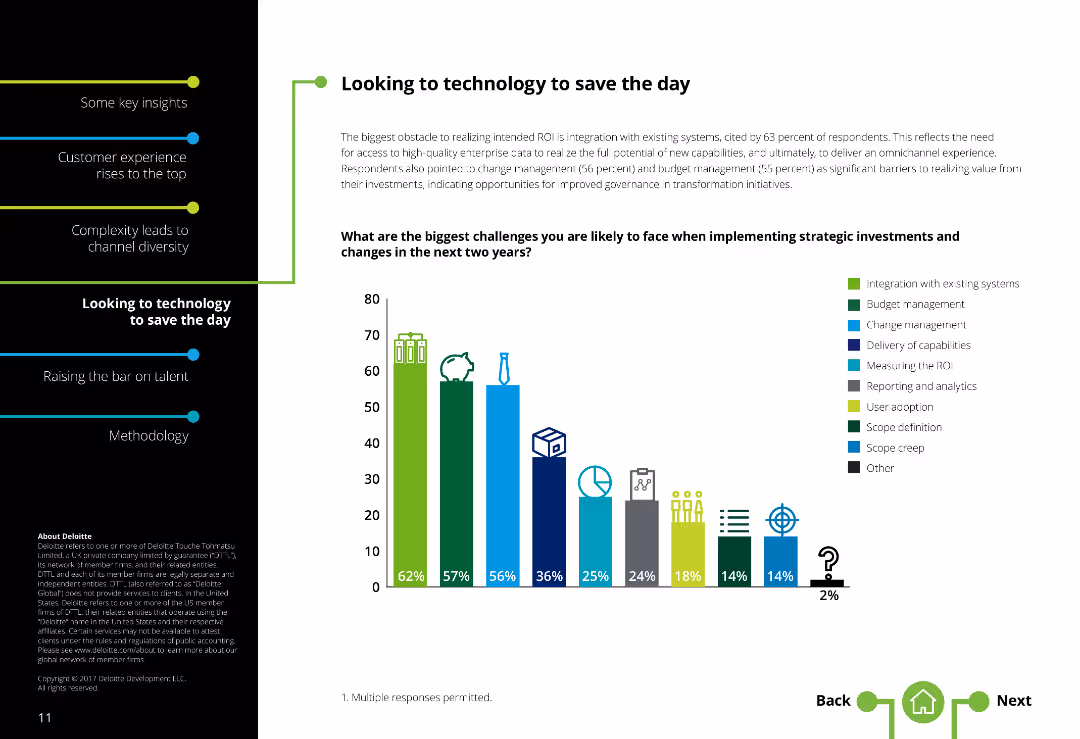
Two-column layout with text on the left and a column chart illustrating challenges on the right. There is moderate text density.
Market Analysis and Trends
Technology & Software
Highlights challenges in implementing strategic investments in contact centers, such as system integration, change management, and budget constraints.
Technology challenges, Contact centers, System integration, Change management, Budget constraints, Strategic investments
Single Chart
Deloitte
Saved
Multiple small column charts integrated with a world map, color-coded to indicate different regions. Includes icons and labels for external factors affecting market growth.
Market Analysis and Trends
Transportation & Logistics
Predicts a 60% worldwide market share for battery electric vehicles by 2035 with regional differences. Factors like legislation, subsidies, and infrastructure development are highlighted as influences on market growth.
BEV, market share, 2035, global, electric vehicles
Multiple Chart
BCG
Saved
Displays a map with overlaid proportional circles representing the population of major cities in 2020 and projected for 2035.
Market Analysis and Trends
Government & Public Sector
Focuses on population growth in major cities, particularly in Asia, to discuss urban infrastructure needs.
megacities, Asia, population growth, 2035, infrastructure
Graphic
Roland Berger
Saved
The slide includes bar charts comparing on-farm storage costs and capacity in Australia, Canada, and Ukraine, along with contextual notes.
Operational Efficiency
Agriculture & Food Production
The slide highlights Australia's limited on-farm storage capacity compared to Canada and Ukraine, discussing the cost advantages and market impacts of this limitation.
On-farm storage, Australia, Canada, Ukraine, storage costs, storage capacity, agriculture, food production, operational efficiency
Multiple Chart
LEK
Saved
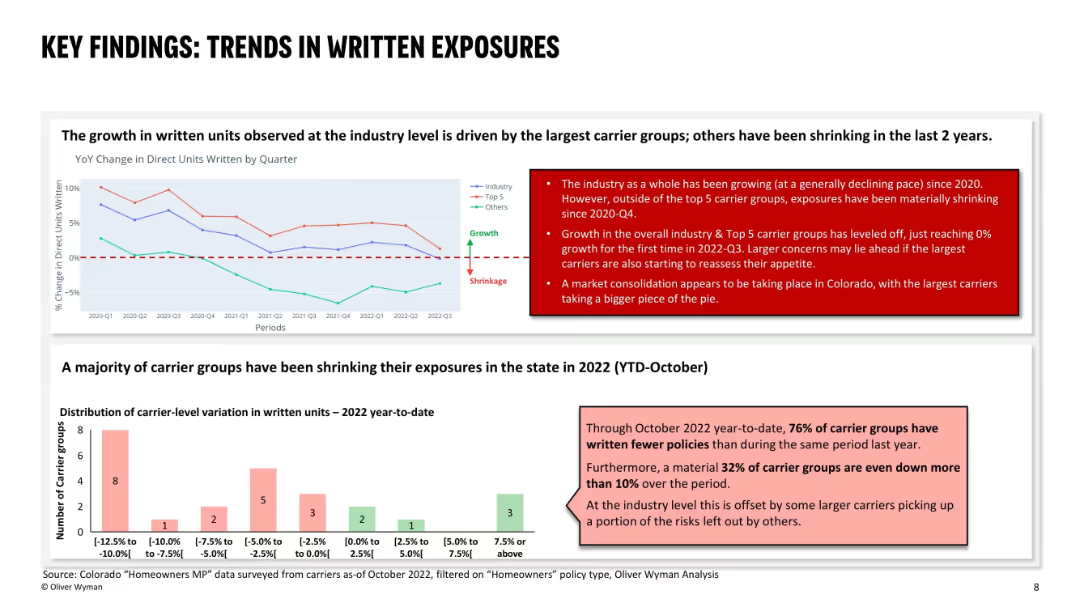
Two main graphs: upper section shows YoY % change in written units by quarter; lower section is a bar chart showing distribution of changes in carrier activity; red text boxes call out key messages; uses line graphs to compare industry, top 5, and others.
Customer and Market Segmentation
Financial Services
The slide identifies shrinking exposures by most carriers in Colorado, despite slight overall industry growth driven by the top 5 groups. Since late 2020, non-top carriers have notably reduced exposure, suggesting market consolidation. 76% of carrier groups wrote fewer policies in 2022 than in 2021.
written exposures, carrier groups, policy volume, segmentation, Colorado, market shrinkage, insurance, homeowners, consolidation
Multiple Chart
Oliver Wyman
Saved
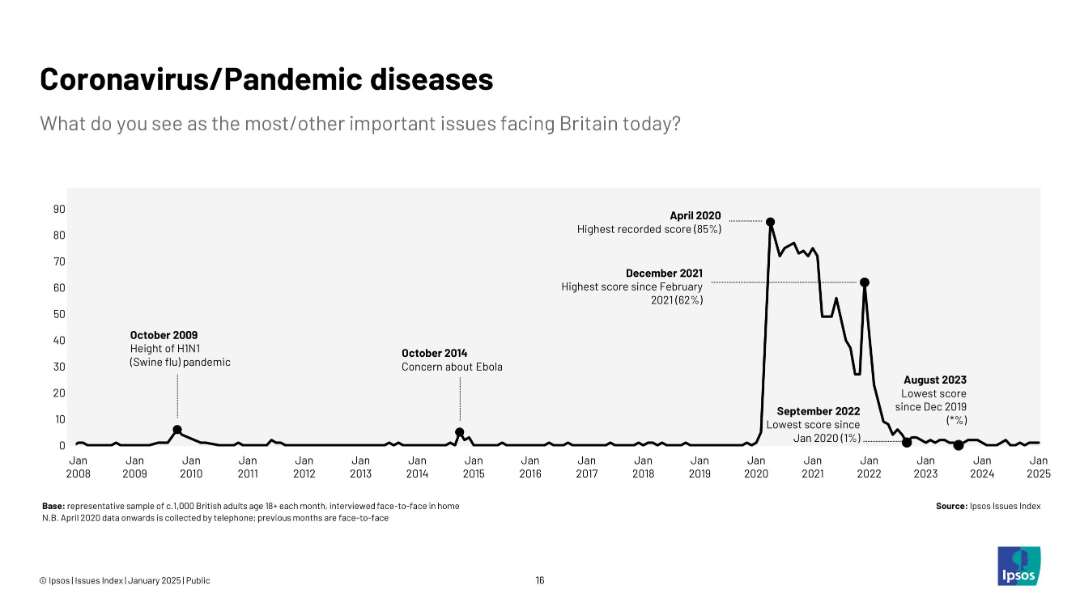
Sharp spike chart showing concern during COVID-19; 2008–2025 timeline; significant peaks labeled (e.g., April 2020, Dec 2021).
Risk Assessment and Management
Healthcare & Pharmaceuticals
Highlights the surge in concern during COVID-19 with peak concern in April 2020. Shows rapid decline by 2023 with minimal ongoing concern.
COVID-19, pandemic, virus, healthcare, UK, Ipsos, public concern, risk
Single Chart
IPSOS
Saved
Detailed descriptions of seven key priorities for people management in the new reality post-COVID-19, including smarter work models and health initiatives.
Human Resources and Talent Management
Professional Services
Provides insights into how businesses can adapt their people management strategies to the post-pandemic world, focusing on health, flexibility, and new skills.
new reality, people management, health, flexibility, skills
Header Vertical
BCG
Saved
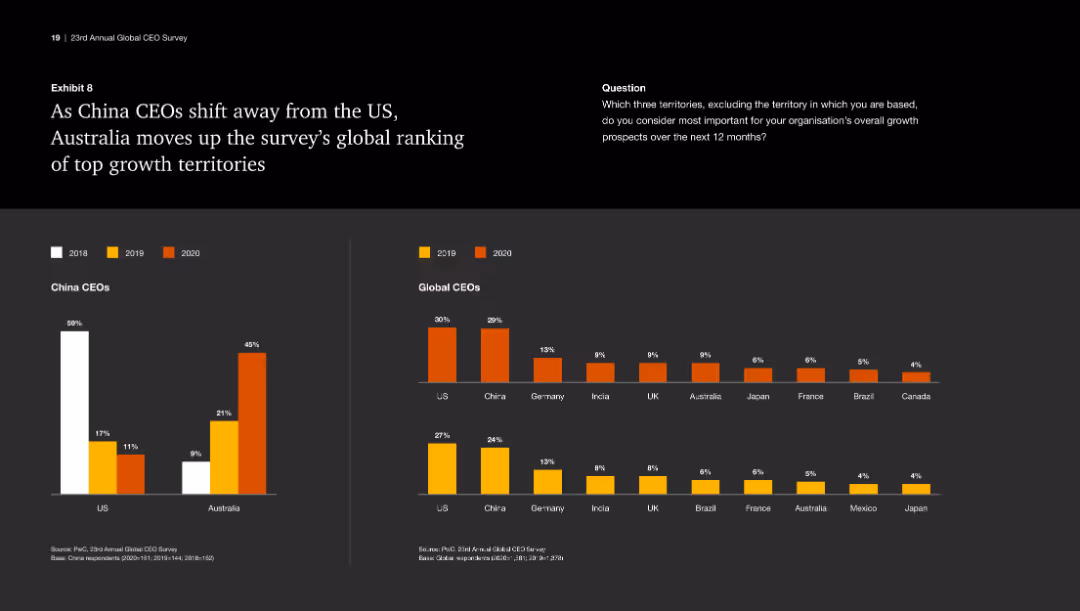
This slide features a column chart showing the ranking of US and Australia in terms of attractiveness to China CEOs from 2018 to 2020. It uses color to differentiate each year.
Market Analysis and Trends
Industrial & Manufacturing
The slide highlights the shift of China CEOs' preference from the US to Australia as a top growth territory, showcasing the rankings and changes over the years.
Growth territories, China CEOs, Australia, US, ranking
Multiple Chart
PwC/Strategy&
Saved
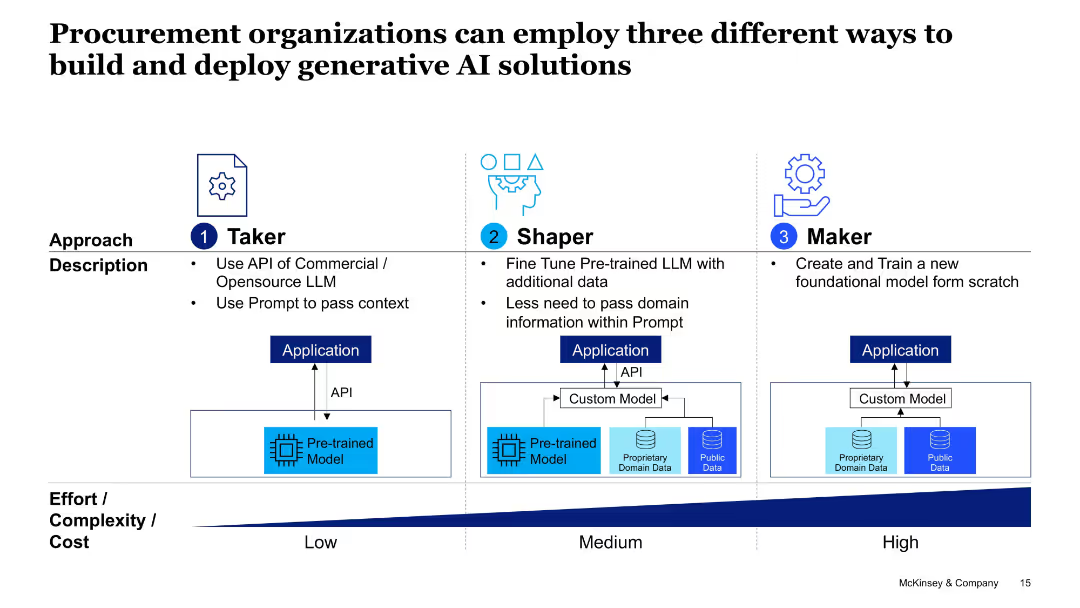
Visual comparison of 3 models (Taker, Shaper, Maker) using application flowcharts; effort/cost axis at bottom.
Technology and Digital Transformation
Professional Services
This slide categorizes three implementation strategies for Gen AI in procurement—using APIs (Taker), fine-tuning models (Shaper), and building models from scratch (Maker)—with increasing complexity and customizability.
GenAI deployment, Taker, Shaper, Maker, LLM, procurement, application model, complexity
Table
McKinsey
Saved
Previous
Next
If nothing, comes up, please save your slides first
Create a FREE account to continue browsing
Receive Instant Access to 1,000+ slides from companies like McKinsey, Google, and Goldman Sachs
First Name
Last Name
Email
Password
I agree to all
Terms & Privacy Policy
Thank you! Your submission has been received!
Oops! Something went wrong while submitting the form.
Have an account?
Sign in
Column Chart
Heatmap
Chevron
Org Chart
Infographic
Callouts
Timeline
List
Graphic
Picture
Process Flow
Diagram
Paragraph
Map
Table
Framework
Subtitle
Takeaway Box
Icon
Other Chart
Radar Chart
Waterfall Chart
Mekko Chart
Pie Chart
Scatter Plot
Line Chart
Bar chart
Bullet points