My Account
My Slides
Search by Category
Templates
Leave Feedback
Login
Logout
Get Started
Browse all Slides
Browse all Slides
Create a FREE Account
Instant access to 1,000+ real slides from top companies like McKinsey, BCG, Goldman Sachs, Google and many more!
First Name
Last Name
Email
Password
I agree to all
Terms & Privacy Policy
Thank you! Your submission has been received!
Oops! Something went wrong while submitting the form.
Have an account?
Sign in
Saved Slides
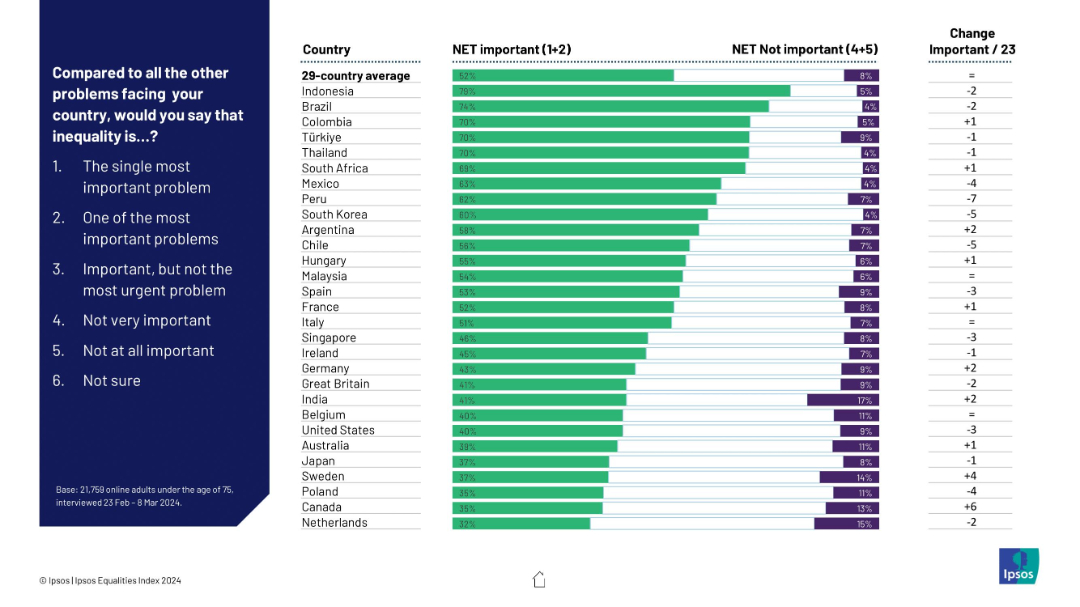
Horizontal bar chart on right, ranking countries by how many say inequality is important; color-coded bars (green = important, purple = not important); question and answer scale on left.
Market Analysis and Trends
Government & Public Sector
This slide presents country-by-country perceptions on the importance of inequality as a national problem. It compares the net percentage of people who consider it important vs. not important, highlighting changes over time and country averages.
inequality, global opinion, country ranking, importance scale, perceptions, Ipsos, net important, comparative chart, public opinion
Mixed Chart
IPSOS
Saved
The slide includes a network diagram illustrating the split of New South Wales into sub-regions or zones, with connectors and node labels.
Operational Efficiency
Energy & Utilities
Details the modeling choices for New South Wales transmission forecasts, including the creation of sub-regions and application of dynamic loss equations.
transmission, New South Wales, sub-regions, network flows, dynamic loss, connectors, modeling
Graphic
EY
Saved
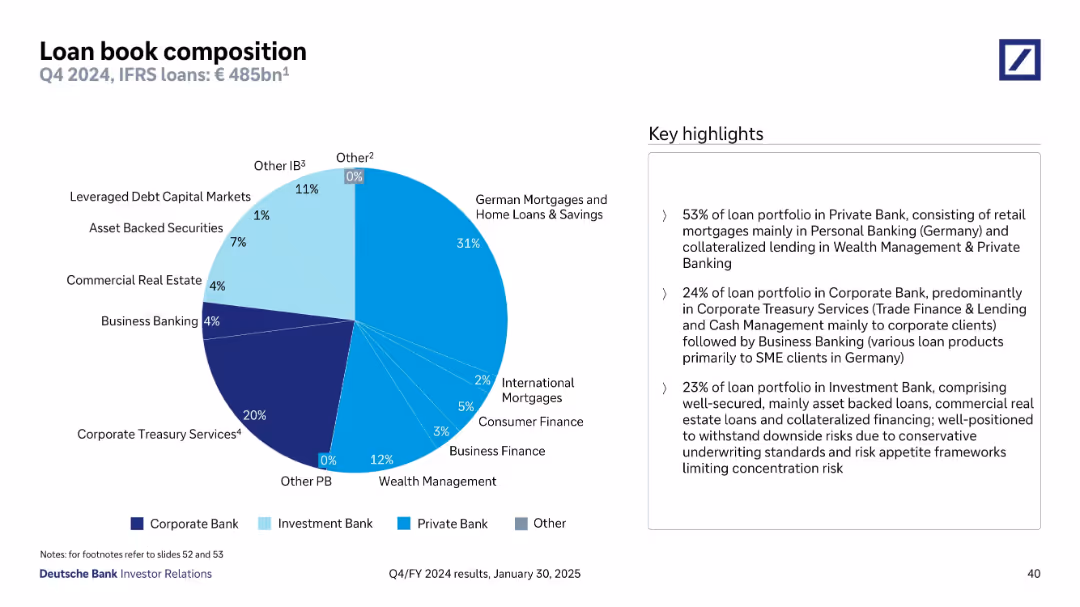
Pie chart of Q4 2024 loan book composition by business unit; key highlights in box on right
Product and Service Analysis
Financial Services
Illustrates the distribution of the €485bn loan portfolio across business units. The Private Bank holds the majority with 53%, mostly retail mortgages. Corporate Treasury Services and Investment Bank also contribute, highlighting a diversified and risk-managed portfolio across sectors and geographies.
loan portfolio, Private Bank, Investment Bank, diversification, Q4 2024
Mixed Chart
Deutsche Bank
Saved
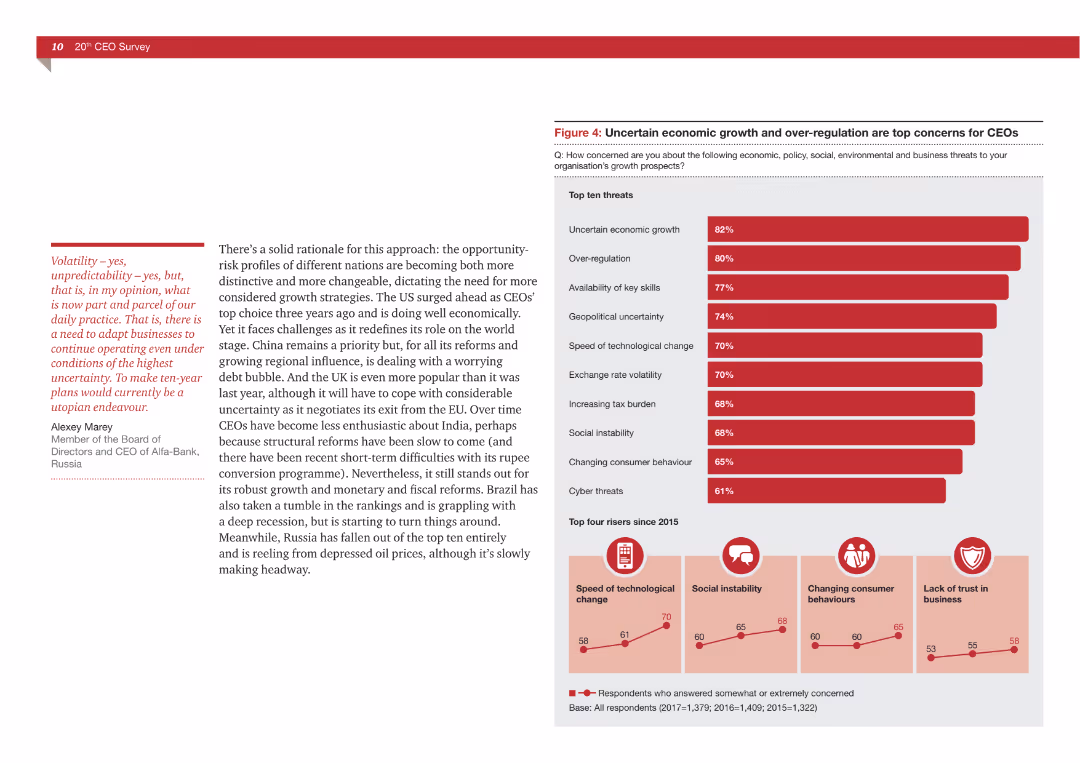
Text and a bar chart showing top concerns for CEOs, with economic and regulatory issues being predominant.
Risk Assessment and Management
Professional Services
The slide details the primary threats CEOs perceive for business growth, emphasizing economic and regulatory challenges.
CEO concerns, economic growth, regulatory issues, risk management, business threats
Multiple Chart
PwC/Strategy&
Saved
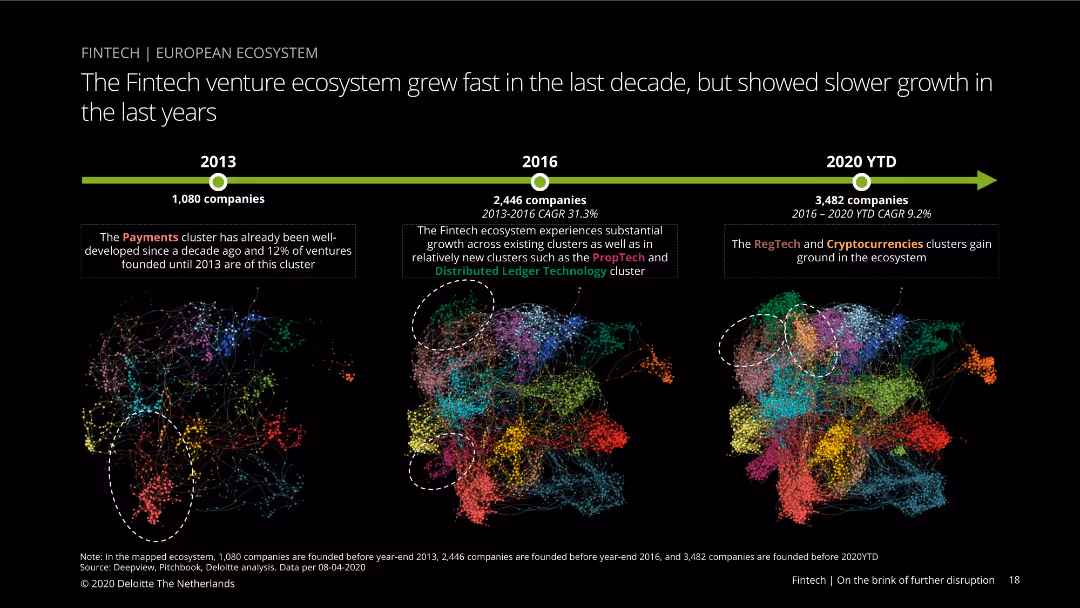
Diagram slide with three visual maps showing the growth of the fintech venture ecosystem in Europe from 2013 to 2020, with clusters representing different fintech sectors.
Market Analysis and Trends
Financial Services
Tracks the growth of the fintech venture ecosystem in Europe over the past decade, highlighting the increase in ventures and the recent slowdown, with sector-specific growth analysis.
fintech, ecosystem, Europe, venture growth, clusters, 2013-2020, market analysis, sector growth, RegTech, cryptocurrencies
Linear Flow
Deloitte
Saved
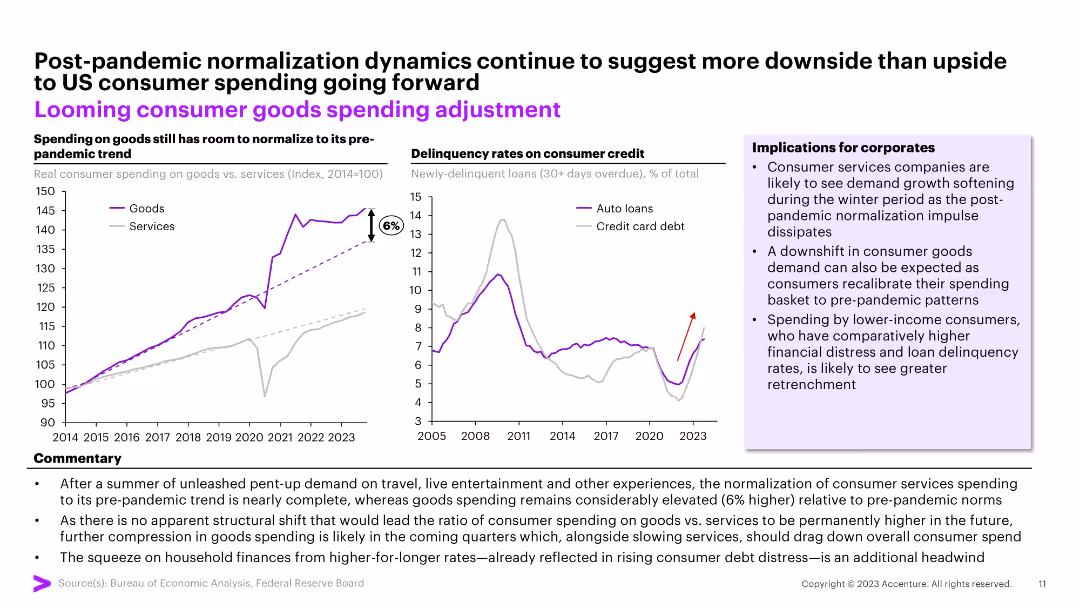
The slide features two line charts comparing real consumer spending on goods vs. services and delinquency rates on consumer credit. Commentary and implications for corporates are included.
Market Analysis and Trends
Consumer Goods
The slide analyzes post-pandemic consumer spending trends and delinquency rates. It forecasts potential adjustments in consumer goods spending and implications for businesses.
consumer spending, credit delinquency, market trends, post-pandemic, financial analysis
Multiple Chart
Accenture
Saved
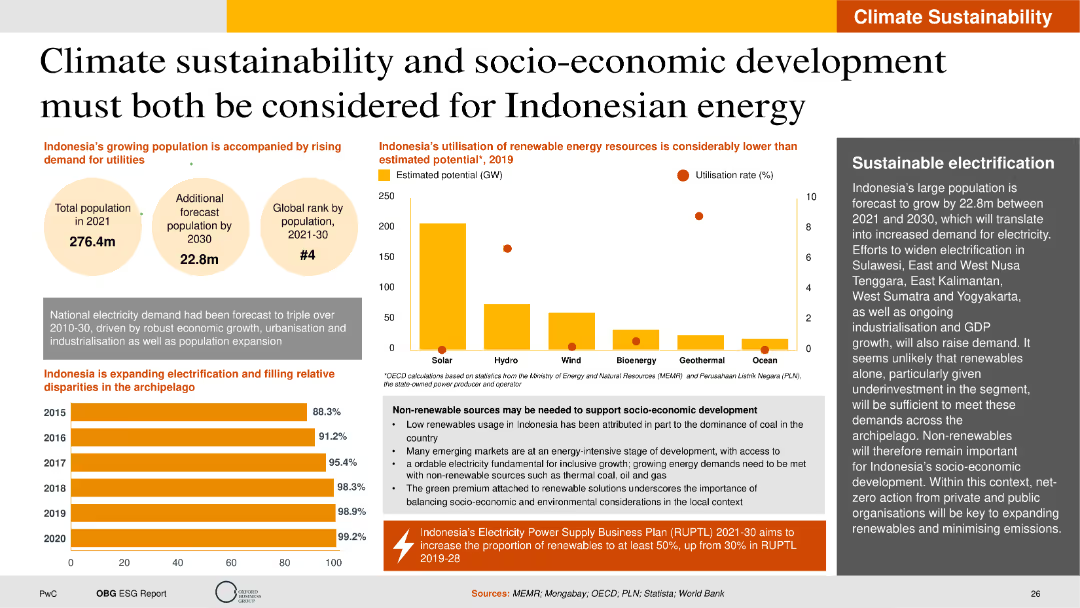
The slide includes column charts, bubble charts, and text descriptions. It is visually detailed with data on energy resource utilization, population growth, and electrification rates.
Strategic Planning
Energy & Utilities
The slide highlights the balance between climate sustainability and socio-economic development in Indonesia's energy sector. It discusses the potential and utilization rates of various renewable energy sources, the forecasted population growth, and the expansion of electrification. The slide also addresses the need for non-renewable sources to support socio-economic development and the importance of sustainable electrification strategies.
Climate sustainability, renewable energy, socio-economic development, electrification
Multiple Chart
PwC/Strategy&
Saved
The slide features a diamond-shaped diagram with AI at the center, surrounded by four quadrants labeled Social & Search Data, Consumer Needs, Expressions & Trends, Survey Data, and Digital Behavioral Data.
Market Analysis and Trends
Technology & Software
The slide outlines how IPSOS will leverage unique, high-quality data from various sources like social and search data, consumer trends, and survey data to gain a competitive advantage.
IPSOS, data, quality, AI, social, search, consumer trends, survey, behavioral, alternative
Diagram
IPSOS
Saved
Two donut charts showing the buy types for podcast ads in 2017 and 2018 with color coding and detailed percentages.
Market Analysis and Trends
Media & Entertainment
Examines the purchasing patterns of podcast ads, noting an increase in programmatic buying from 2017 to 2018.
Podcast, Advertising, Buying Patterns, Programmatic, Quarterly, 2017, 2018
Multiple Chart
PwC/Strategy&
Saved
The slide contains four colored boxes with lists, headlines in blue, and subtext. A header sentence spans the top, with a footer sentence below.
Industry Overview
Financial Services
Presents four pillars of a diversified business model, positioning for market outperformance, and foundational principles.
Diversified franchise, client franchises, principles, shareholder value, business practices
Table
JP Morgan
Saved
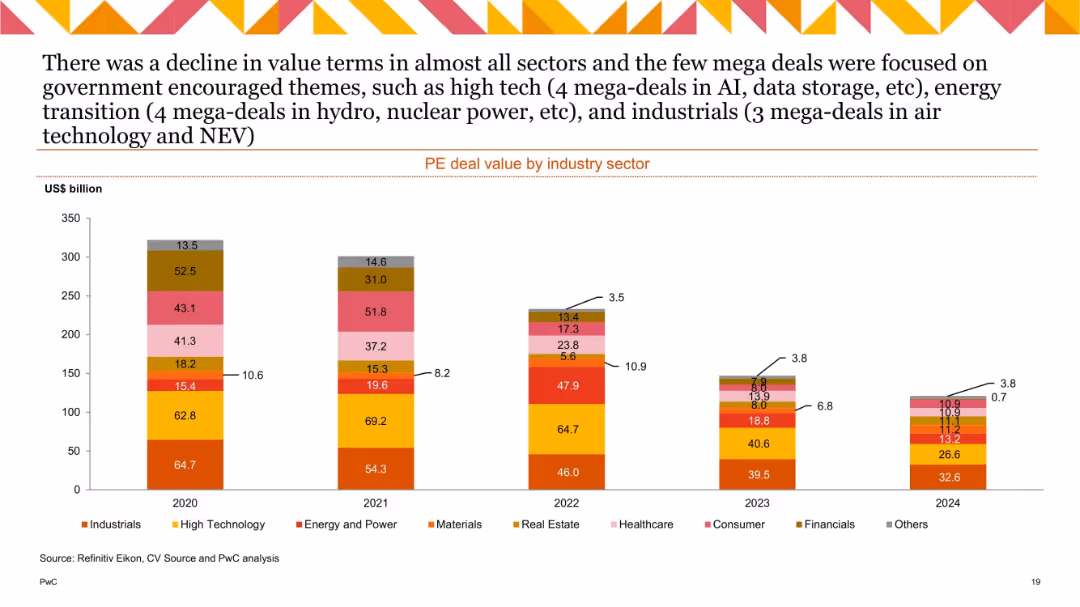
Stacked bar chart with 5 bars (2020–2024), segmented by industry and labeled with US$ billion values.
Financial Performance
Financial Services
This slide depicts the total value of private equity deals by industry from 2020 to 2024. A notable decline in value is observed across all sectors, with some mega-deals in industrials, energy, and high tech standing out due to government support themes such as AI and energy transition.
PE deal value, industry breakdown, mega-deals, AI, energy transition, decline trend, annual data
Single Chart
PwC/Strategy&
Saved
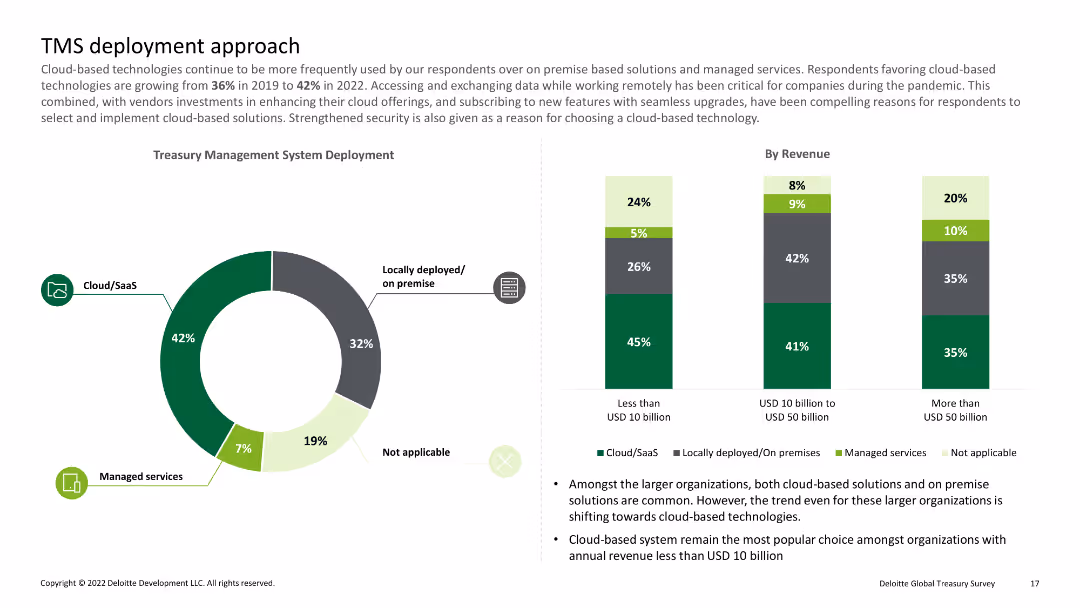
Pie chart showing percentages of cloud/SaaS, locally deployed, and managed services; bar charts detailing deployment by revenue
Technology and Digital Transformation
Financial Services
Discusses the shift towards cloud-based treasury management systems and their deployment among organizations of varying revenue sizes.
Cloud, SaaS, deployment, revenue, treasury
Multiple Chart
Deloitte
Saved
Slide includes multiple column charts presenting financial data like revenue CAGR and CET1 ratio development across various banking divisions.
Performance Metrics and KPIs
Financial Services
Analyzes Deutsche Bank’s key performance metrics such as revenue growth, cost/income ratio, and liquidity, comparing current data with previous fiscal years.
performance, revenue, financial metrics, banking, growth
Multiple Chart
Deutsche Bank
Saved
Contains a circular diagram with three sections labeled "Composable Tech," "Cloud," and "Collaboration," each with relevant icons and descriptions in purple. The background is light with minimal distractions.
Operational Efficiency
Technology & Software
Provides best practices for improving interoperability. It emphasizes leveraging cloud technology, using composable tech, and fostering collaboration to compress transformation and improve efficiency.
interoperability, best practices, cloud, collaboration, tech
Framework
Accenture
Saved
Column chart show migration volumes between and within regions, using contrasting colors for clarity.
Market Analysis and Trends
Government & Public Sector
Analyzes regional and interregional migration patterns, highlighting European mobility.
migration, Europe, interregional, patterns, analysis
Mixed Chart
Roland Berger
Saved
Slide features a column chart showing the CET1 ratio over time, with additional notes on capital allocation and a side panel for strategic progress, all in a blue and white theme.
Financial Performance
Financial Services
This slide emphasizes a strong capital position with a focus on how capital is allocated to support growth and returns. It's used to illustrate financial stability and strategic capital management, providing reassurance to investors and stakeholders.
capital position, CET1 ratio, growth, strategy
Mixed Chart
Goldman Sachs
Saved
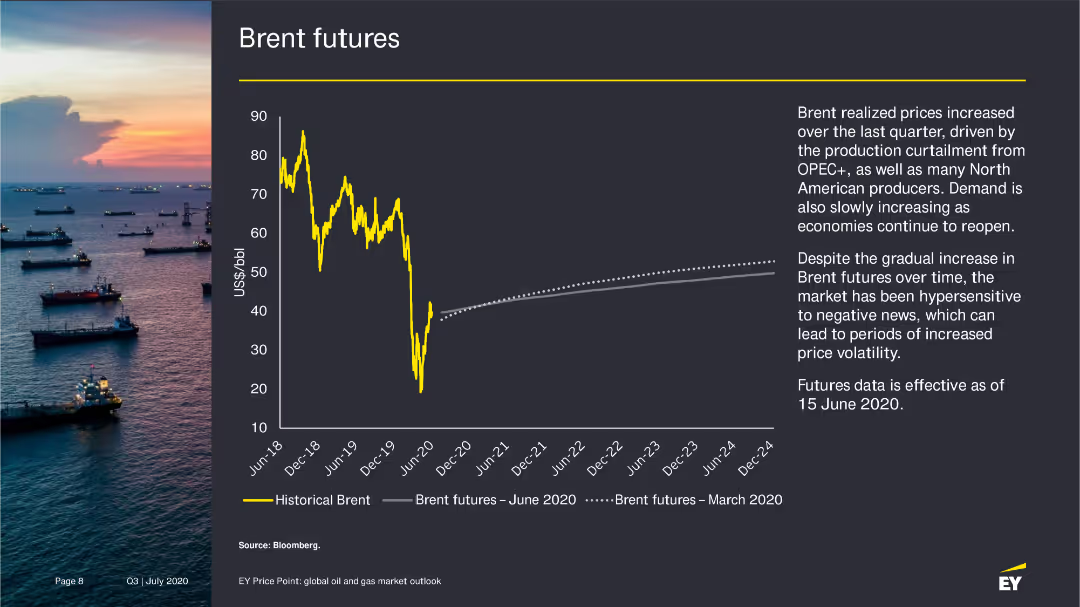
The slide presents a line chart showing historical Brent prices and Brent futures as of June 2020, with an accompanying narrative on the factors influencing these trends.
Market Analysis and Trends
Energy & Utilities
Analyzes the increase in Brent futures prices due to production cuts and rising demand, with projections for future price trends.
Brent futures, oil prices, market trends, 2020
Mixed Chart
EY
Saved
The slide uses column charts to show the growth of investment values in Indonesia from 2012 to 2017, illustrating exponential increases.
Market Analysis and Trends
Financial Services
Provides an analysis of the rapid growth in Indonesia’s investment values, showing significant increases from 2012 to mid-2017.
Indonesia, Investment, Growth, Trends
Multiple Chart
Kearney
Saved
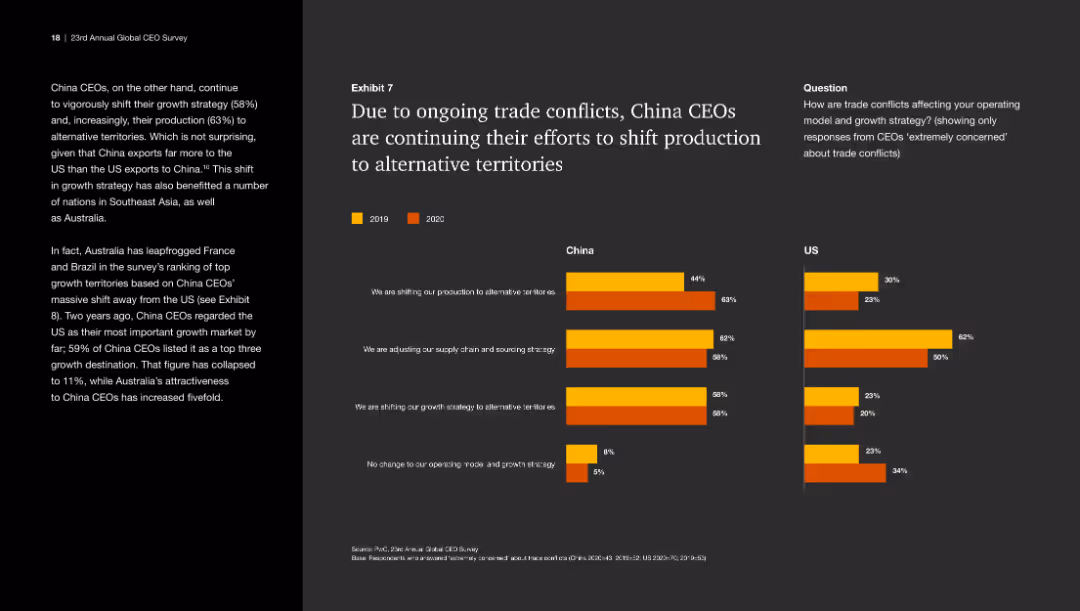
This slide includes a bar chart comparing responses from China and US CEOs in 2019 and 2020. The bar chart uses different colors to represent the years and is moderately complex.
Risk Assessment and Management
Industrial & Manufacturing
The slide discusses how trade conflicts are influencing China CEOs to shift production to alternative territories and adjust supply chain strategies.
Trade conflicts, production shift, China CEOs, US CEOs, supply chain
Multiple Chart
PwC/Strategy&
Saved
Two columns of bulleted lists, contrasting elements of a strategy on the left and its impacts on the right.
Strategic Planning
Professional Services
Explains a strategic growth plan and its operational, technical, and market impacts.
Strategy, growth, performance, innovation, talent retention, market expansion
Header Horizontal
Booz Allen Hamilton
Saved
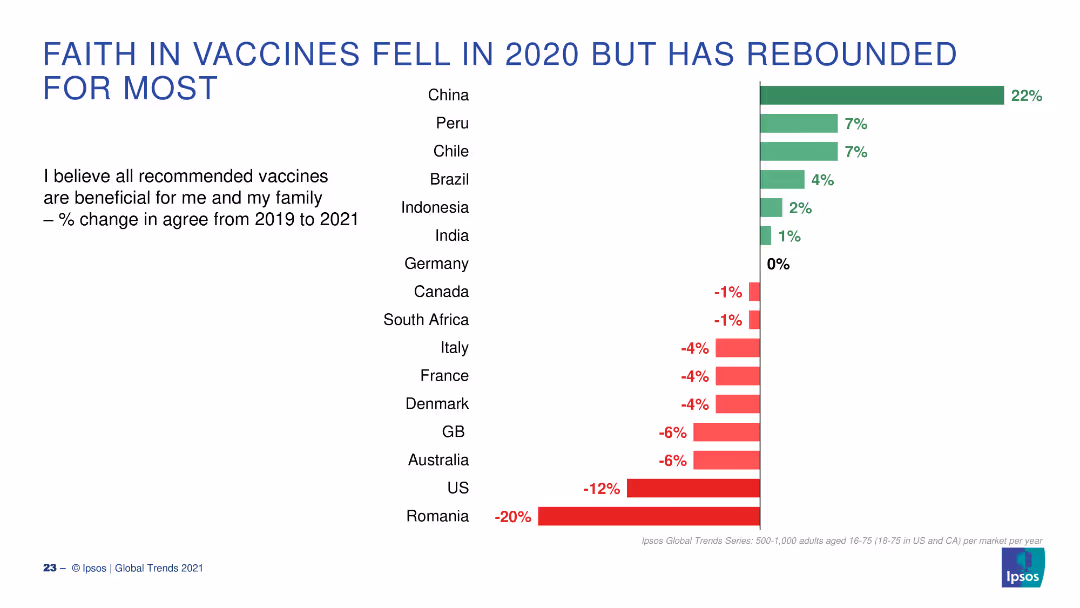
A bar chart displaying changes in faith in vaccines across various countries from 2019 to 2021. Green bars indicate positive change, red negative.
Market Analysis and Trends
Healthcare & Pharmaceuticals
The slide shows the percentage change in belief in the benefits of vaccines for various countries, highlighting changes between 2019 and 2021.
Vaccines, Belief, Change, 2019-2021, Countries
Single Chart
IPSOS
Saved
Shows a column chart depicting the growth of green bond activity from 2014 to 2019 YTD, along with text highlights about sustainable transition bonds and IPO activity.
Strategic Planning
Financial Services
The slide focuses on the growth of green bonds and sustainable finance initiatives, showcasing significant increases in green bond activity and strategic ESG goals.
Green Bonds, Sustainable Finance, ESG, Growth, IPO Activity
Mixed Chart
Credit Suisse
Saved
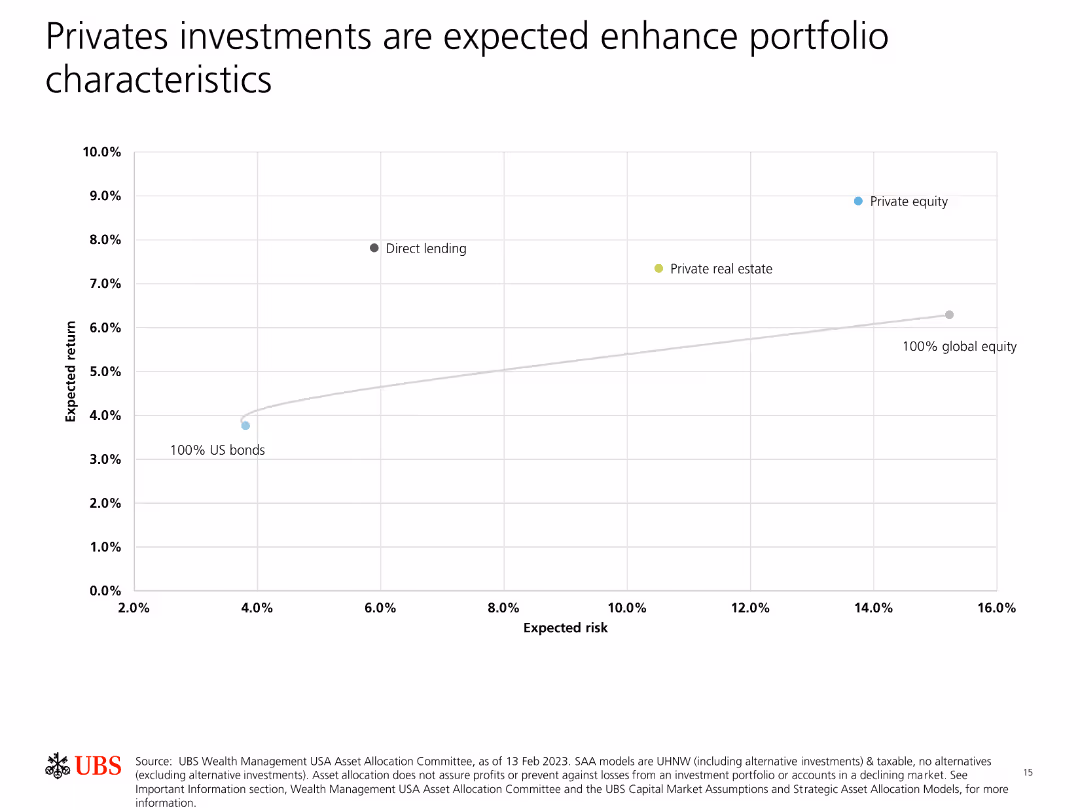
Contains a scatter plot showing expected return vs. expected risk for different asset classes, highlighting private equity and direct lending.
Investment Analysis
Financial Services
Demonstrates how private investments like private equity and direct lending can enhance portfolio returns relative to risk, compared to traditional asset classes.
Private investments, portfolio, expected return, expected risk, enhancement
Single Chart
UBS
Saved
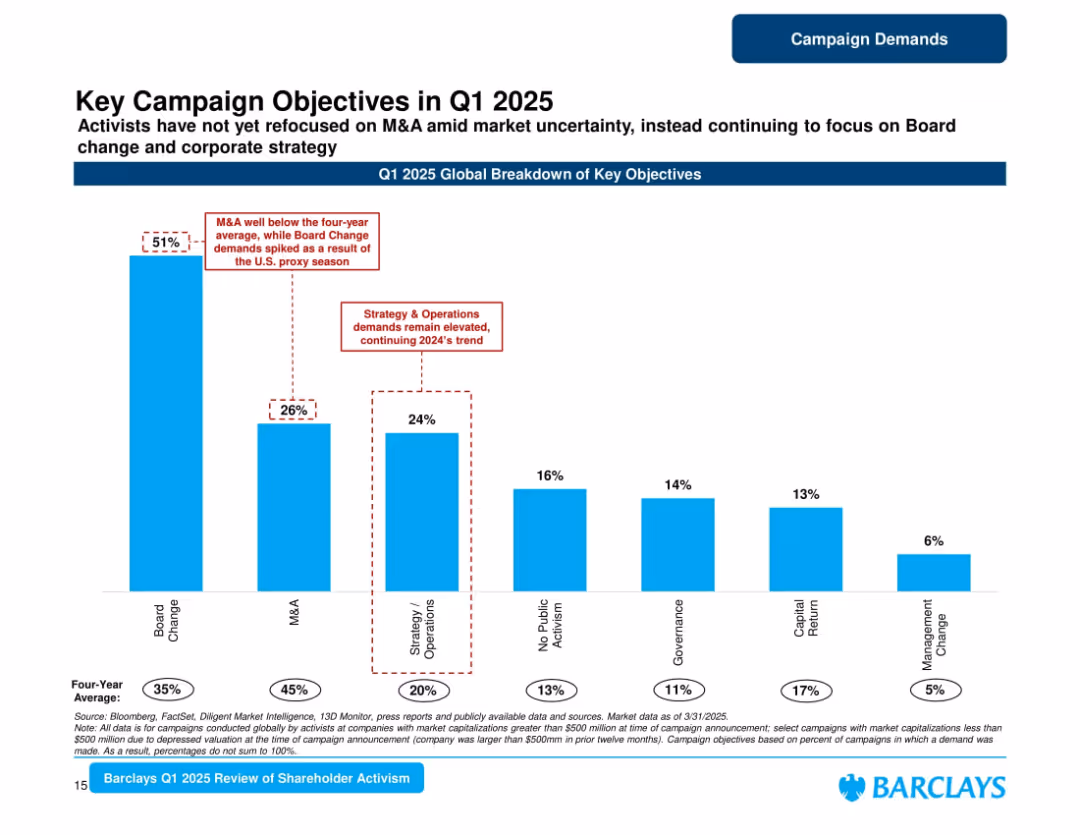
Tall vertical bar chart with annotated highlights and color-coded categories. Sparse layout with white background.
Strategic Planning
Financial Services
Highlights global activist campaign objectives in Q1 2025, with Board Change leading at 51%. M&A is down compared to average. Strategy & Operations and other categories are also tracked, with comparison to historical averages.
Campaigns, Objectives, Board Change, M&A, Strategy, Governance, 2025, Shareholder, Activism
Single Chart
Barclays
Saved
This slide consists of column charts showing assets under supervision over a five-year period, and long-term fee-based net inflows. The graphics are complemented by bullet points outlining key figures and statements.
Financial Performance
Financial Services
It shows the growth of assets under supervision and long-term fee-based net inflows, indicating a strategic focus on balancing growth through various investment management divisions.
Investment Management, Assets, Growth, Fee-Based, Net Inflows, GSAM, PWM, Ayco, Balanced Growth, Client Coverage
Multiple Chart
Goldman Sachs
Saved
Previous
Next
If nothing, comes up, please save your slides first
Create a FREE account to continue browsing
Receive Instant Access to 1,000+ slides from companies like McKinsey, Google, and Goldman Sachs
First Name
Last Name
Email
Password
I agree to all
Terms & Privacy Policy
Thank you! Your submission has been received!
Oops! Something went wrong while submitting the form.
Have an account?
Sign in
Column Chart
Heatmap
Chevron
Org Chart
Infographic
Callouts
Timeline
List
Graphic
Picture
Process Flow
Diagram
Paragraph
Map
Table
Framework
Subtitle
Takeaway Box
Icon
Other Chart
Radar Chart
Waterfall Chart
Mekko Chart
Pie Chart
Scatter Plot
Line Chart
Bar chart
Bullet points