My Account
My Slides
Search by Category
Templates
Leave Feedback
Login
Logout
Get Started
Browse all Slides
Browse all Slides
Create a FREE Account
Instant access to 1,000+ real slides from top companies like McKinsey, BCG, Goldman Sachs, Google and many more!
First Name
Last Name
Email
Password
I agree to all
Terms & Privacy Policy
Thank you! Your submission has been received!
Oops! Something went wrong while submitting the form.
Have an account?
Sign in
Saved Slides
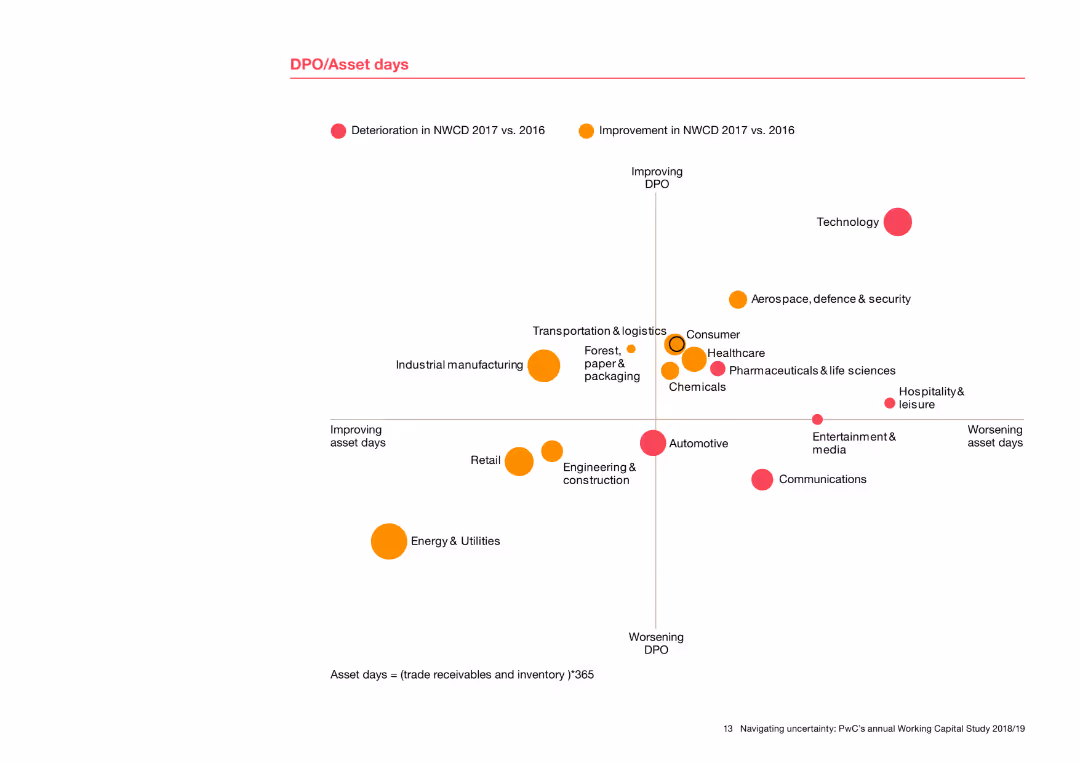
The slide includes a scatter plot showing DPO (Days Payable Outstanding) against asset days for various industries. Dots are color-coded to indicate improvement or deterioration from 2016 to 2017. Industries are labeled around the dots, providing a clear comparison of performance.
Risk Assessment and Management
Financial Services
This slide presents a detailed analysis of DPO and asset days across industries, showing trends in payables and asset management. The scatter plot visualizes how different sectors have improved or worsened in these metrics, offering insights into risk management and operational efficiency.
DPO, asset days, scatter plot, industry comparison, performance trends, risk management
Single Chart
PwC/Strategy&
Saved
A laptop screen displaying a dashboard with a pie chart and list of financial data, mostly in white and gray colors.
Financial Performance
Financial Services
The slide demonstrates a workbench for relationship managers, showcasing client information, asset allocation, and portfolio details.
Relationship manager, dashboard, financial data, pie chart, portfolio
Mixed Chart
Credit Suisse
Saved
Horizontal bar chart by country; stacked by “Important” vs “Not important”; presented on navy background
Customer and Market Segmentation
Government & Public Sector
This slide visualizes global views on whether being part of a religious majority is essential to national identity. Agreement is highest in Thailand and India and lowest in Japan and the Netherlands, reflecting cultural and religious diversity impacts.
religion, national identity, majority, beliefs, country comparison, Ipsos, culture, survey responses, belonging
Mixed Chart
IPSOS
Saved
This slide presents a line chart showing the organic growth in emerging markets from 2013 to 2022, and a small group of circle charts representing 10-year average growth comparisons between emerging markets and Nestlé Group.
Market Analysis and Trends
Consumer Goods
The slide highlights Nestlé's organic growth trends in emerging markets over a decade, emphasizing the impact of pricing and volume on overall growth. It serves to compare historical performance and forecast future potential in these markets.
organic growth, emerging markets, Nestlé, pricing, RIG
Single Chart
Deutsche Bank
Saved
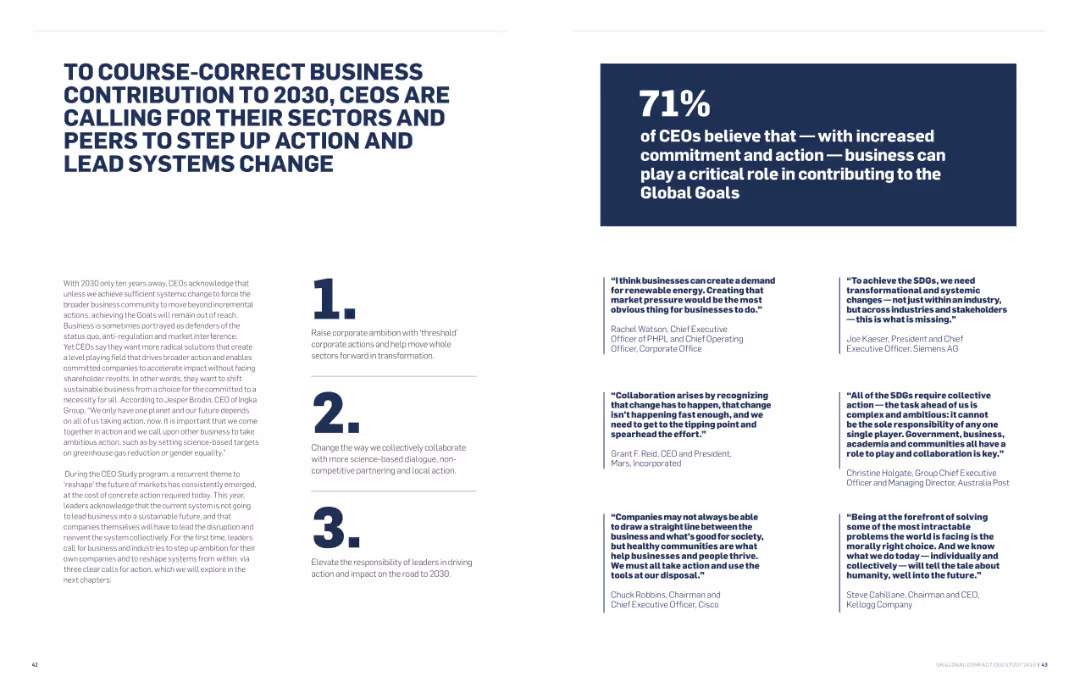
The slide includes a combination of text and highlighted numbers and points. It also features quotes from various CEOs.
Strategic Planning
Government & Public Sector
The slide emphasizes the need for increased commitment and action from businesses to meet the global goals by 2030, highlighting key areas of focus and CEO perspectives.
Business Contribution, 2030 Goals, Strategic Planning, System Change, CEO Perspectives, Government
Header Horizontal
Accenture
Saved
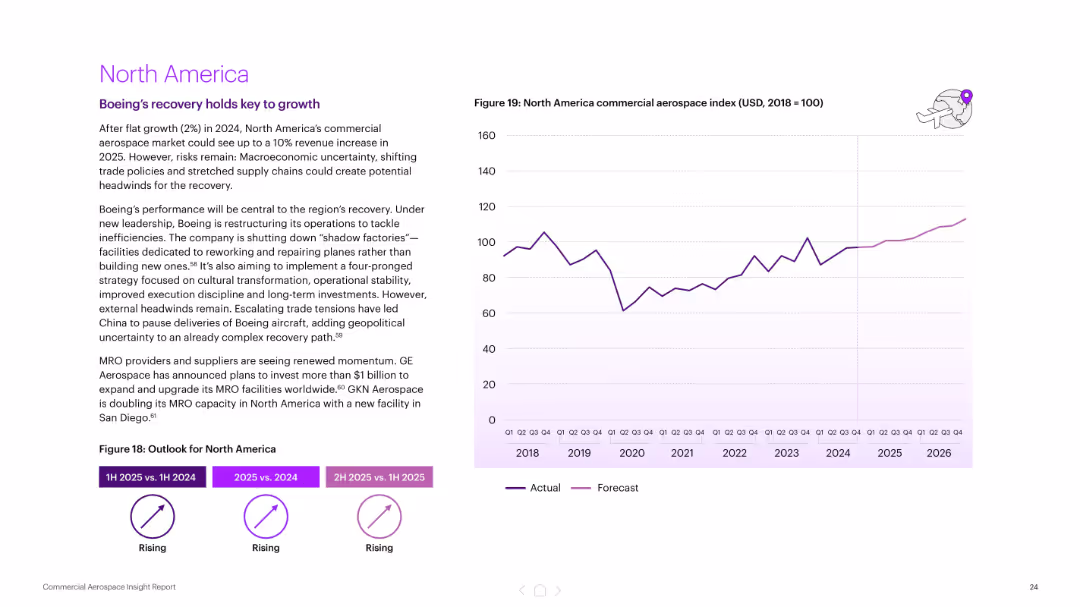
Left text with outlook and summary; right features a line chart (actual and forecast) of commercial aerospace index (2018–2026). Purple highlights.
Market Analysis and Trends
Industrial & Manufacturing
Describes North America’s modest recovery in aerospace, driven by Boeing's restructuring and renewed MRO investment. Notes risks from macroeconomics and trade. Forecasted 10% revenue growth for 2025.
North America, aerospace index, Boeing, recovery, forecast, MRO investment, commercial aviation, trade risks
Mixed Chart
Accenture
Saved
Contains a map of the U.S. highlighting market expansion, two column charts contrasting new account openings and deposit balances by source, and explanatory text.
Market Analysis and Trends
Financial Services
Highlights the expansion and market penetration strategies of a financial service provider, showing early results in new markets and overall growth in customer balances.
Market Expansion, Banking, New Accounts, Customer Balances, Growth Strategy
Multiple Chart
JP Morgan
Saved
Features a column chart listing reasons for purchasing crypto investment funds, including safety and diversification.
Market Analysis and Trends
Financial Services
The slide outlines reasons Canadians purchase crypto investment funds, emphasizing financial motivations like safety, diversification, and speculative investment, and notes demographic differences in these reasons.
Crypto funds, purchase reasons, investment
Multiple Chart
IPSOS
Saved
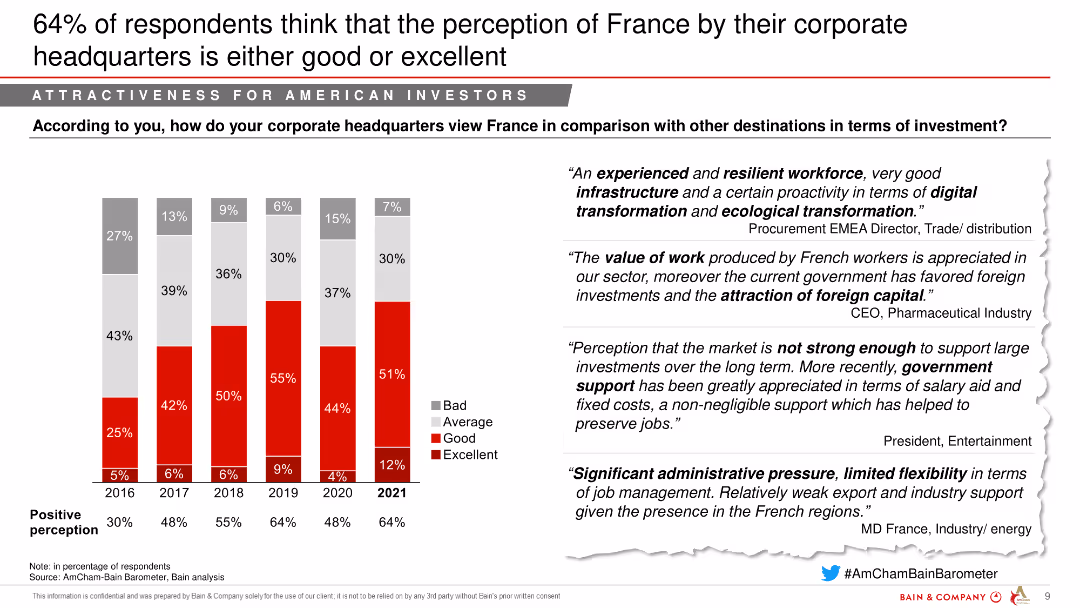
The slide includes a column chart showing the perception of France's investment attractiveness from 2016 to 2021, segmented into bad, average, good, and excellent. Quotes from industry leaders are on the right.
Market Analysis and Trends
Financial Services
The slide shows an improving perception of France by corporate headquarters, indicating good or excellent ratings from a majority of respondents.
Perception, Investment attractiveness, Corporate headquarters, Financial services
Mixed Chart
Bain
Saved
A single column chart depicts the increase in mobile gaming revenue per gamer from 2015 to 2025, with key growth drivers listed.
Market Analysis and Trends
Media & Entertainment
The slide centers on the revenue per mobile gamer in SEA, highlighting a 3.6x increase and mobile gaming's share of total gaming revenue.
mobile gaming, revenue, SEA, growth
Multiple Chart
Bain
Saved
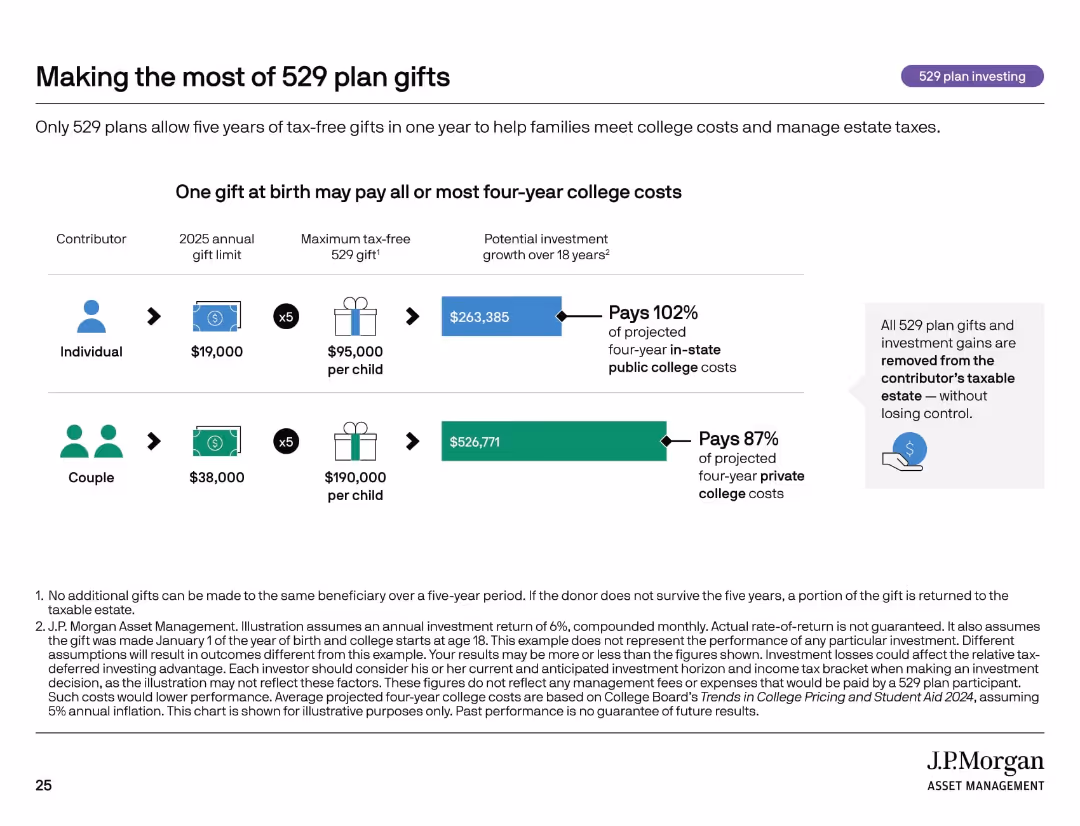
Icon row, side-by-side comparisons of individual vs. couple contributions with gift limits and investment projections.
Investment Analysis
Financial Services
This slide shows how front-loading 529 plan gifts can significantly fund future college expenses while reducing estate taxes. It compares the financial impact of individual vs. couple contributions and demonstrates how a lump sum at birth can cover nearly all four-year public college costs.
estate planning, 529 gifting, college savings, compound growth, tax-free
Mixed Chart
JP Morgan
Saved
This slide displays percentages and bullet points detailing the increase in usage of digital services like online retail, digital wallets, and streaming services. Each chart is accompanied by explanatory text.
Technology and Digital Transformation
Technology & Software
Explores the surge in digital tool adoption among consumers, driven by the pandemic, and compares it to historical trends such as the SARS outbreak. Highlights the increased dependence on digital platforms and services.
Digital Adoption, COVID-19, E-commerce, Streaming
Header Horizontal
BCG
Saved
A comparative chart illustrates sector shares between venture capital investing and equity market capitalisation. The visual elements highlight the disproportionate share attracted by the technology sector.
Investment Analysis
Technology & Software
This slide offers a comparative analysis between the venture investing and equity market capitalization across various sectors from 2013 to 2017. It underscores the technology sector's ability to attract a larger share of venture investments relative to its market capitalization, suggesting a higher investment activity within the sector.
venture capital, technology sector, market share, investment, equity capitalization
Mixed Chart
Oliver Wyman
Saved
The slide features a bar chart with horizontal bars representing survey data on employer performance in various areas important to Millennials and Gen Z. It includes comparative data and a textual analysis on the left side.
Market Analysis and Trends
Professional Services
The slide provides insights into Millennials' and Gen Z's expectations from employers, emphasizing areas like diversity, community impact, and support during the pandemic. It compares employer performance across these areas, offering a clear view of what younger generations value in their workplaces.
Employer, Millennials, Gen Z, Expectations, Performance
Multiple Chart
Deloitte
Saved
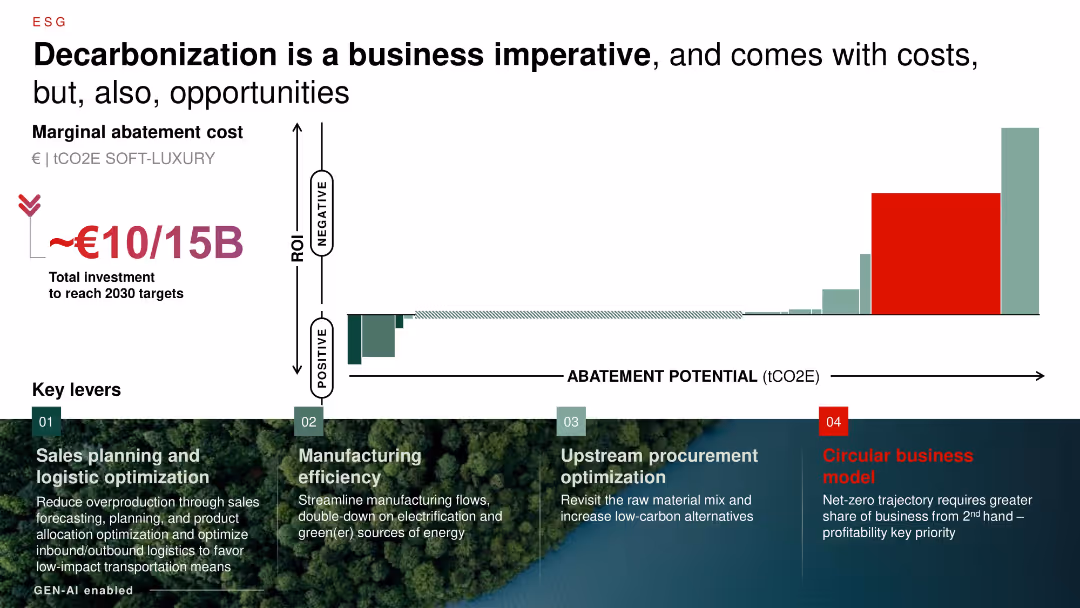
Bar chart showing marginal abatement costs (horizontal axis), ROI (vertical axis), and total investment; green/eco-themed visual section at bottom with 4 levers.
Regulatory and Compliance
Environmental Services & Sustainability
Emphasizes need for €10–15B investment in soft luxury sector to reach 2030 decarbonization targets. Highlights levers such as logistics, manufacturing, procurement, and circular business models. ROI varies with abatement potential.
ESG, decarbonization, investment, abatement, circular economy, manufacturing, logistics
Mixed Chart
Bain
Saved
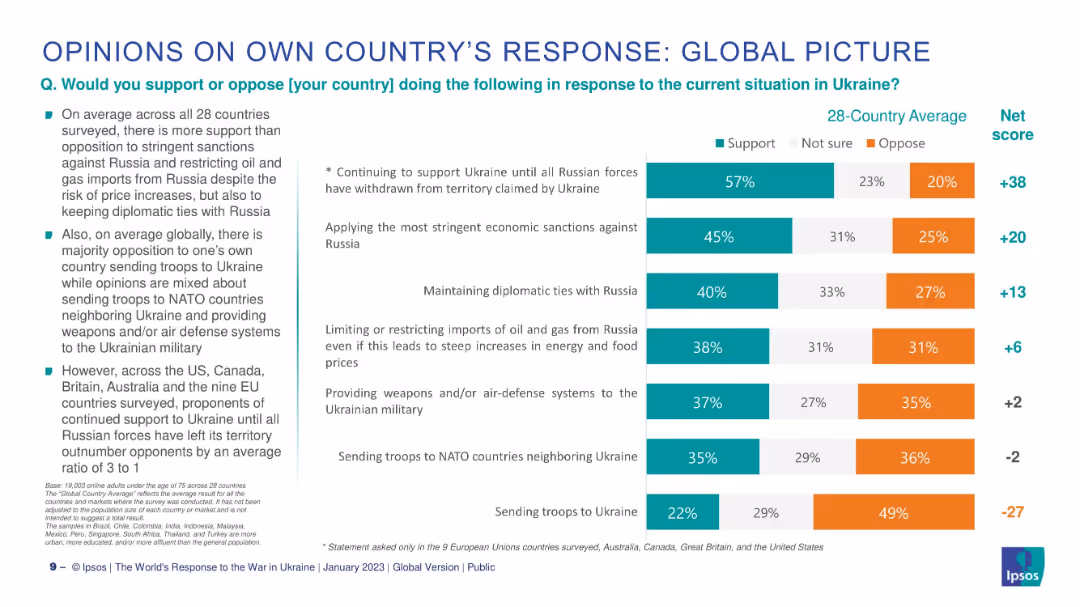
Horizontal bar chart with segmented bars (support/unsure/oppose), accompanied by key highlights in bullets.
Strategic Planning
Government & Public Sector
This slide explores global opinion on how citizens want their own governments to respond to the Ukraine conflict. It breaks down support, opposition, and uncertainty on actions like military aid, economic sanctions, and diplomatic relations.
response, sanctions, military, aid, opinion, support, oppose, Ipsos, Ukraine
Mixed Chart
IPSOS
Saved
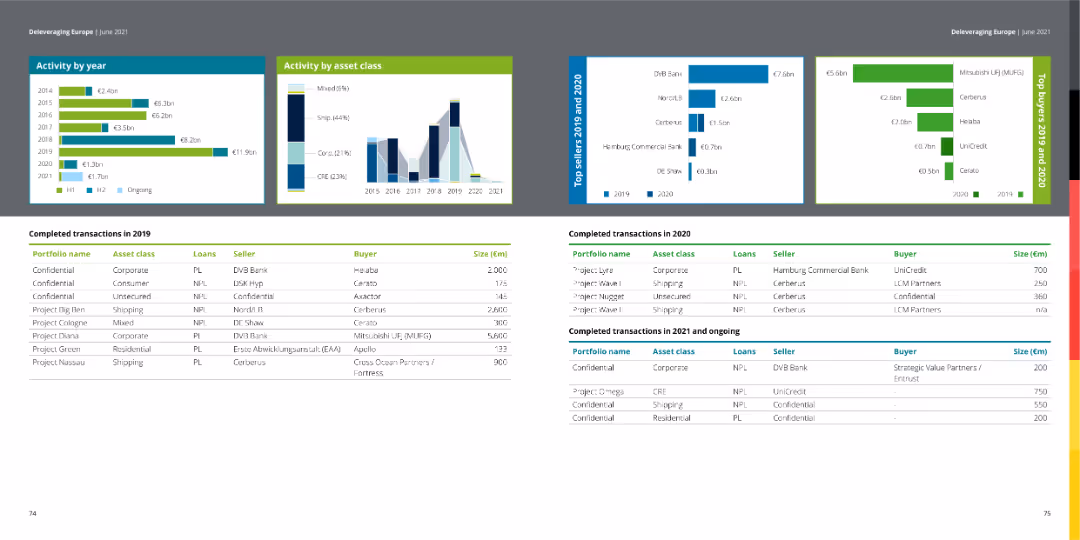
The slide shows column charts of activity by year and asset class, with tables listing completed transactions in 2019 and 2020.
Financial Performance
Financial Services
This slide details completed transactions in 2019, displaying activity by year and asset class in a financial context.
transactions, financial services, column chart, asset class, activity
Multiple Chart
Deloitte
Saved
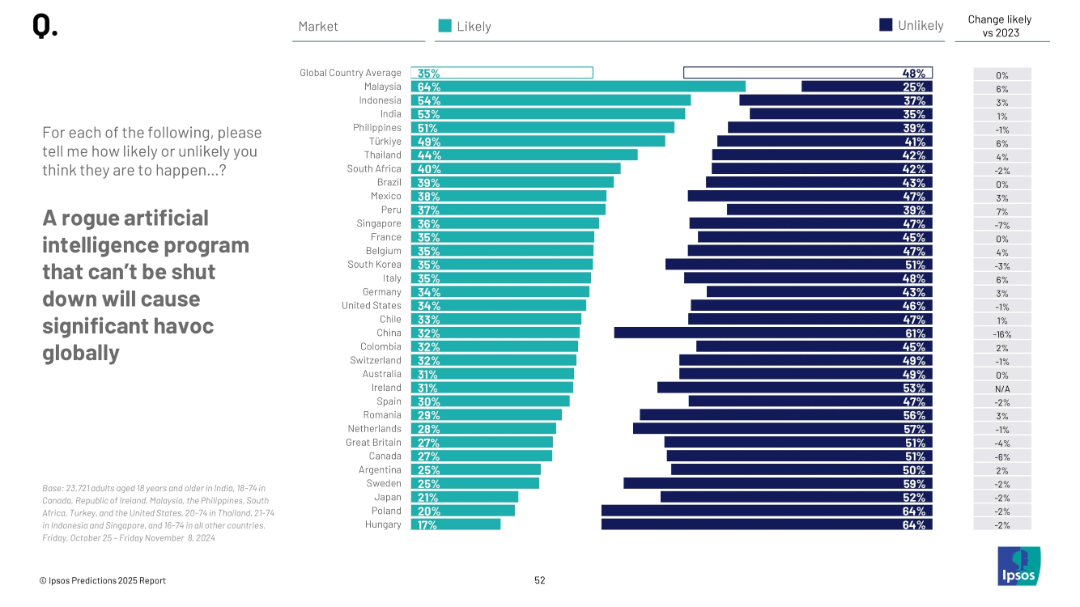
Horizontal bar chart with country-wise opinions; teal and navy color scheme; clean, grid-aligned layout
Risk Assessment and Management
Artificial Intelligence
This slide measures global concern over uncontrolled AI. It displays the percentage of respondents by country who believe such an AI program could cause global chaos, indicating rising or falling concern vs. 2023.
AI risk, rogue AI, global concern, public opinion, technology, survey, perceptions, threat, international views
Mixed Chart
IPSOS
Saved
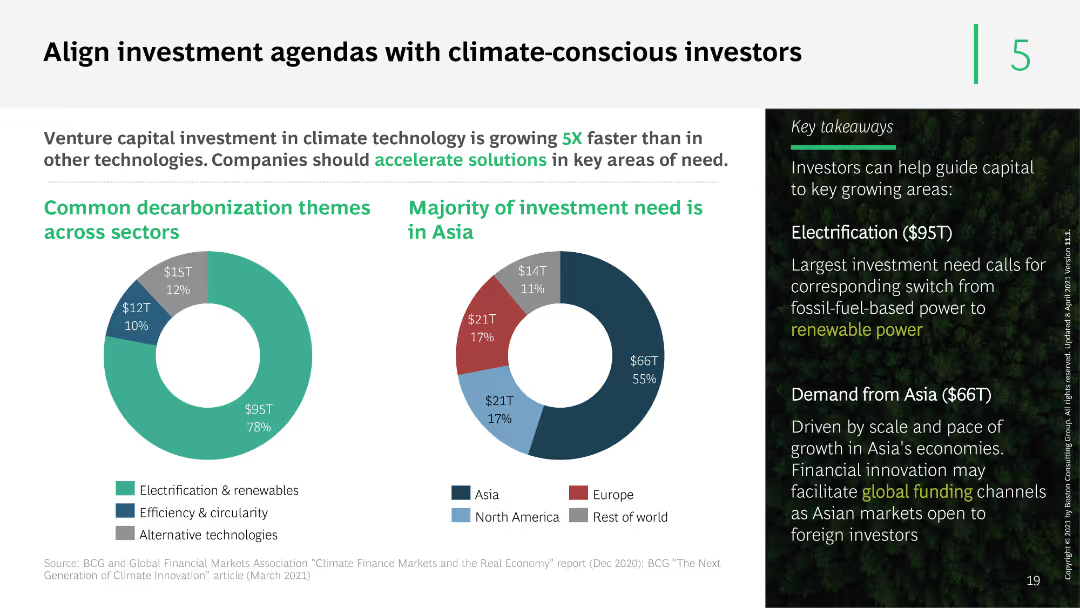
The slide includes two pie charts showing common decarbonization themes and the geographical distribution of investment needs. It uses distinct color segments and a side panel with key takeaways to enhance understanding.
Investment Analysis
Financial Services
The slide advises aligning investment agendas with climate-conscious investors, showing that a significant portion of investment needs is in Asia. It highlights common decarbonization themes and emphasizes the growth in venture capital for climate tech.
investment agendas, climate-conscious, decarbonization, venture capital, Asia
Multiple Chart
BCG
Saved
The slide juxtaposes text with images of diverse ecosystems and landscapes, employing a balanced layout. Portrays headers that succinctly present data points and summaries.
Strategic Planning
Environmental Services & Sustainability
Summarizes key challenges and actions necessary to scale the green economy, highlighting incentives, risk levers, and the importance of regional collaboration and financial strategies in SEA.
Green economy, decarbonization, SEA, financial strategies, regional collaboration
Text Only
Bain
Saved
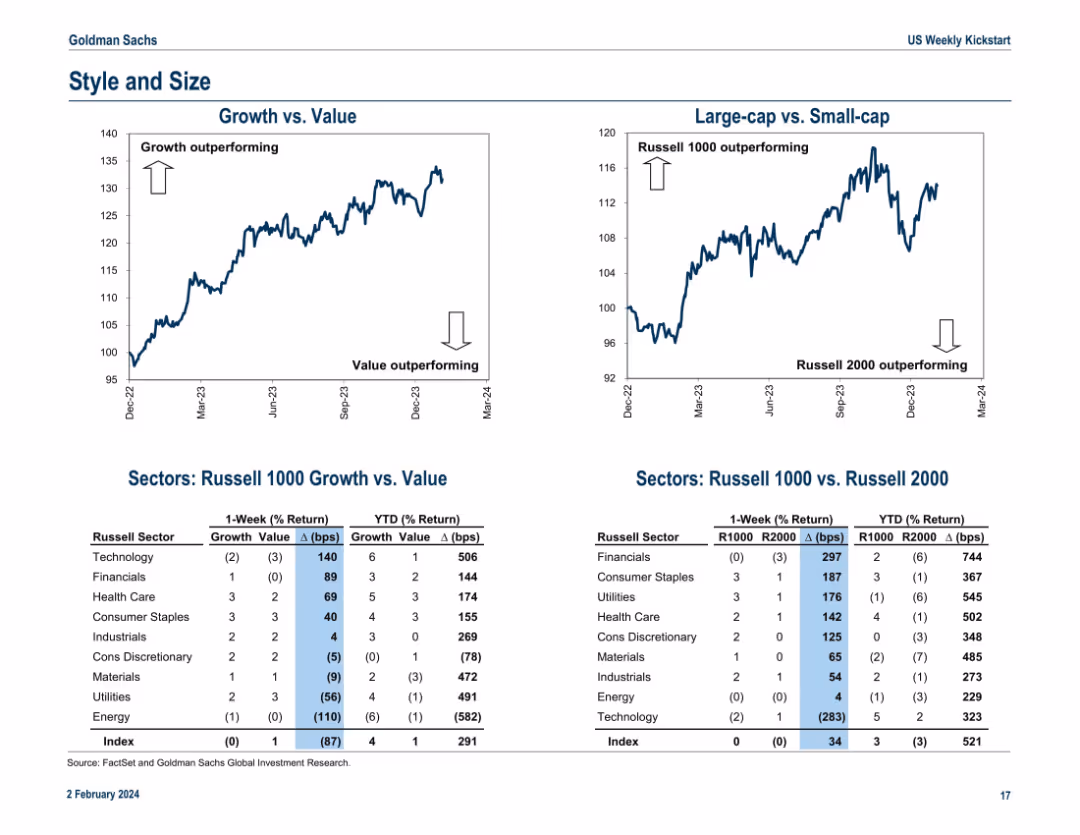
Dual line charts at the top for “Growth vs. Value” and “Large-cap vs. Small-cap.” Tables below show Russell sector performance by style (growth/value) and size (Russell 1000/2000) including 1-week and YTD % returns and basis point spreads.
Performance Metrics and KPIs
Financial Services
This slide analyzes style (growth vs. value) and size (large-cap vs. small-cap) performance. Growth stocks and large-caps are outperforming YTD. The lower tables quantify returns for various sectors by style and size exposure, offering a more nuanced performance assessment. It helps investors understand capital flow dynamics and market sentiment around size and value/growth preferences.
growth vs. value, large-cap, small-cap, Russell 1000, Russell 2000, sector returns, basis points, YTD performance, market style
Multiple Chart
Goldman Sachs
Saved
Features a column chart tracking the dividend per share over several years with special highlights on loyalty bonuses and recent increases, depicted in pink and red hues.
Financial Performance
Consumer Goods
Showcases the growth of L'Oréal's dividends over time, emphasizing the loyalty bonus for long-term shareholders, reflecting shareholder value and financial stability.
dividends, shareholder value, loyalty bonus, L'Oréal
Single Chart
Deutsche Bank
Saved
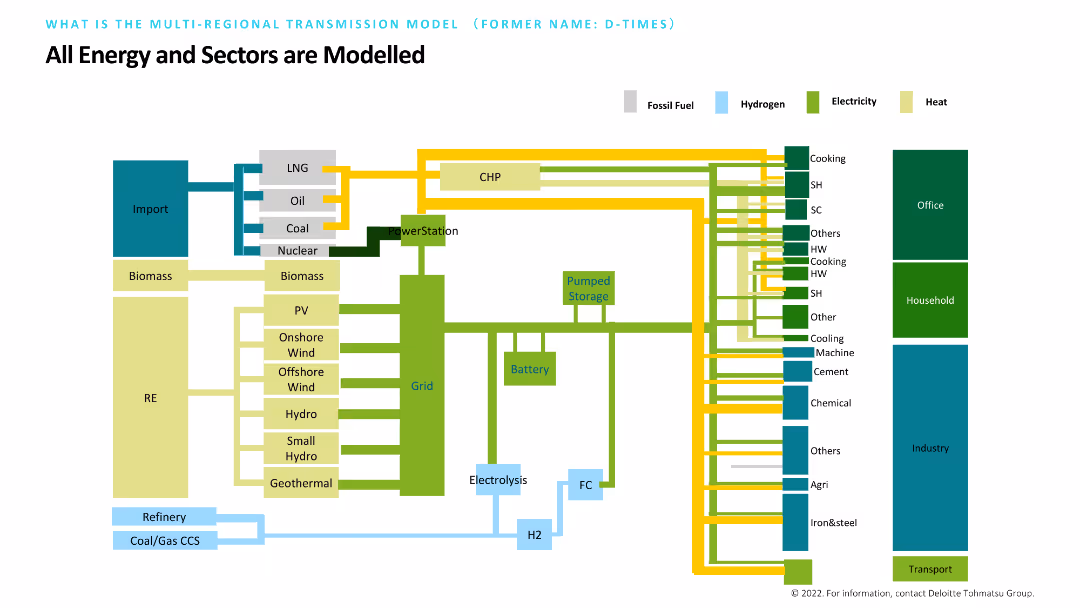
Features a detailed diagram with various energy sources and their connections to different sectors like household, industry, and transport. Each type of energy (fossil fuel, hydrogen, electricity, heat) is color-coded. The slide aims to model all energy and sector interactions comprehensively.
Market Analysis and Trends
Energy & Utilities
Provides a comprehensive model of how different energy sources interact with various sectors. The diagram helps in understanding the flow and impact of energy within households, industries, and transportation, aiming for a holistic view of energy modeling.
Energy, Sectors, Model, Fossil Fuel, Hydrogen
Diagram
Deloitte
Saved
The slide features a detailed case study on the stakeholders and regulations in the energy-from-waste sector in the UK, including a value chain diagram, production cost analysis, and key regulations and policies.
Client Case Studies
Energy & Utilities
This slide examines the stakeholders and regulatory environment of the energy-from-waste sector in the UK, highlighting the value chain, production costs, and key regulations that support and govern waste-to-energy initiatives.
energy from waste, UK, case study, stakeholders, regulations, value chain, production cost, policy
Mixed Chart
Kearney
Saved
The slide features an area chart showing global energy sector CO2 emission reductions by measure (technology performance, electrification, etc.) up to 2070. The chart is color-coded and has a detailed legend.
Strategic Planning
Energy & Utilities
This slide emphasizes that CCUS technologies need to be combined with other solutions like electrification and technology improvements to decarbonize the energy sector effectively.
CCUS, decarbonization, energy sector, emission reductions, technology solutions
Mixed Chart
Kearney
Saved
Previous
Next
If nothing, comes up, please save your slides first
Create a FREE account to continue browsing
Receive Instant Access to 1,000+ slides from companies like McKinsey, Google, and Goldman Sachs
First Name
Last Name
Email
Password
I agree to all
Terms & Privacy Policy
Thank you! Your submission has been received!
Oops! Something went wrong while submitting the form.
Have an account?
Sign in
Column Chart
Heatmap
Chevron
Org Chart
Infographic
Callouts
Timeline
List
Graphic
Picture
Process Flow
Diagram
Paragraph
Map
Table
Framework
Subtitle
Takeaway Box
Icon
Other Chart
Radar Chart
Waterfall Chart
Mekko Chart
Pie Chart
Scatter Plot
Line Chart
Bar chart
Bullet points


![To be a [RELIGIOUS MAJORITY]](https://cdn.prod.website-files.com/654e70fb59937215cac87b19/6899bb1de44404f6f3c2da5a_90hoBWGU4Gu7-ZejW5r9InVHbDZ_qwHcyS-P8KthWT4.jpeg)