My Account
My Slides
Search by Category
Templates
Leave Feedback
Login
Logout
Get Started
Browse all Slides
Browse all Slides
Create a FREE Account
Instant access to 1,000+ real slides from top companies like McKinsey, BCG, Goldman Sachs, Google and many more!
First Name
Last Name
Email
Password
I agree to all
Terms & Privacy Policy
Thank you! Your submission has been received!
Oops! Something went wrong while submitting the form.
Have an account?
Sign in
Saved Slides
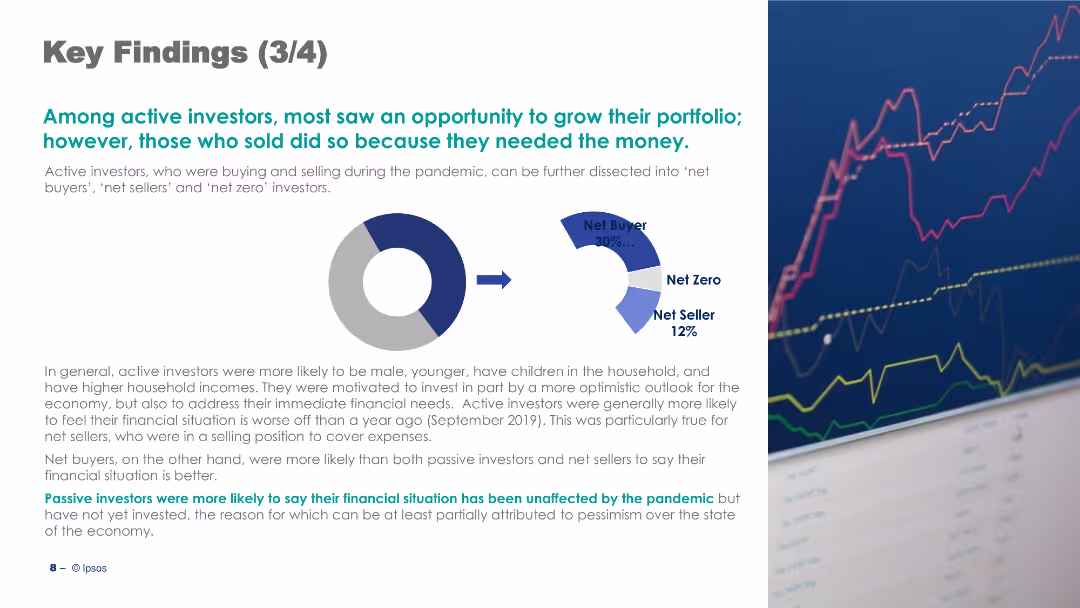
The slide features a pie chart and text, discussing active investors' behaviors during the pandemic with key statistics.
Strategic Planning
Financial Services
It summarizes the behaviors of active investors during the pandemic, highlighting motivations and financial impacts.
Key Findings, Active Investors, Pandemic, Behavior, Financial, Investment, Pie Chart, Text, Image, Strategic Planning
Mixed Chart
IPSOS
Saved
Features a circular diagram with six segments representing different stakeholder groups involved in Chile's hydrogen market, paired with key considerations for engaging these stakeholders.
Strategic Planning
Energy & Utilities
Focuses on the roles of various stakeholders in developing the Chilean hydrogen ecosystem, including off-takers, ecosystem builders, and financiers, emphasizing coordinated action for market growth.
stakeholders, hydrogen, market, ecosystem
Framework
McKinsey
Saved
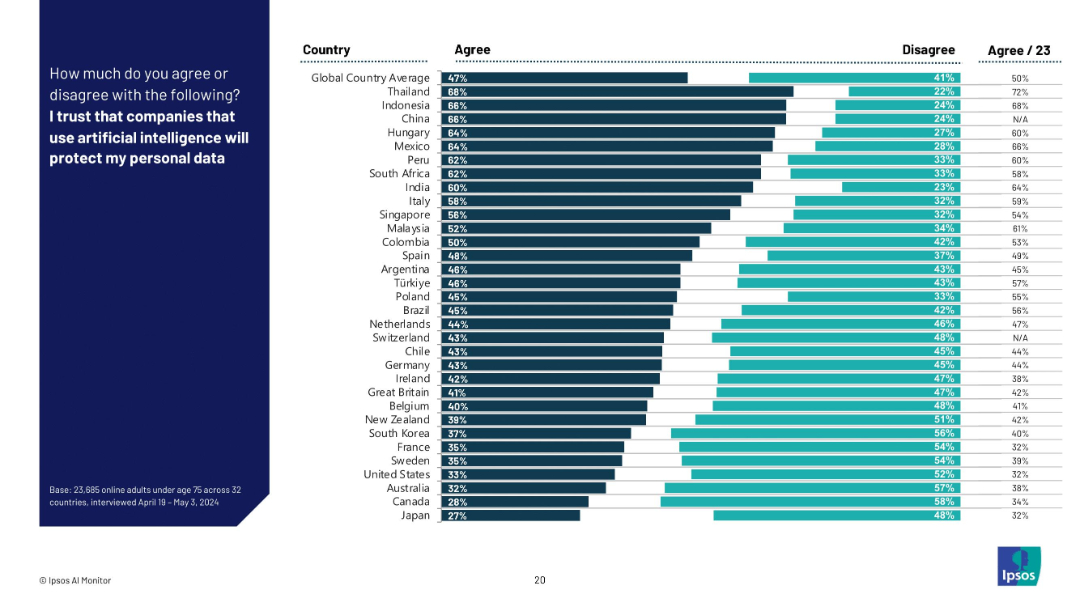
Horizontal bar chart ranked by agreement across countries; includes agree/disagree bars with global comparison.
Risk Assessment and Management
Artificial Intelligence
This chart evaluates consumer trust in companies using AI with respect to protecting personal data. It highlights differences in trust levels between nations, shedding light on privacy concerns and public confidence in data governance.
data privacy, AI trust, consumer sentiment, cybersecurity, Ipsos, global comparison, corporate ethics, AI security
Mixed Chart
IPSOS
Saved
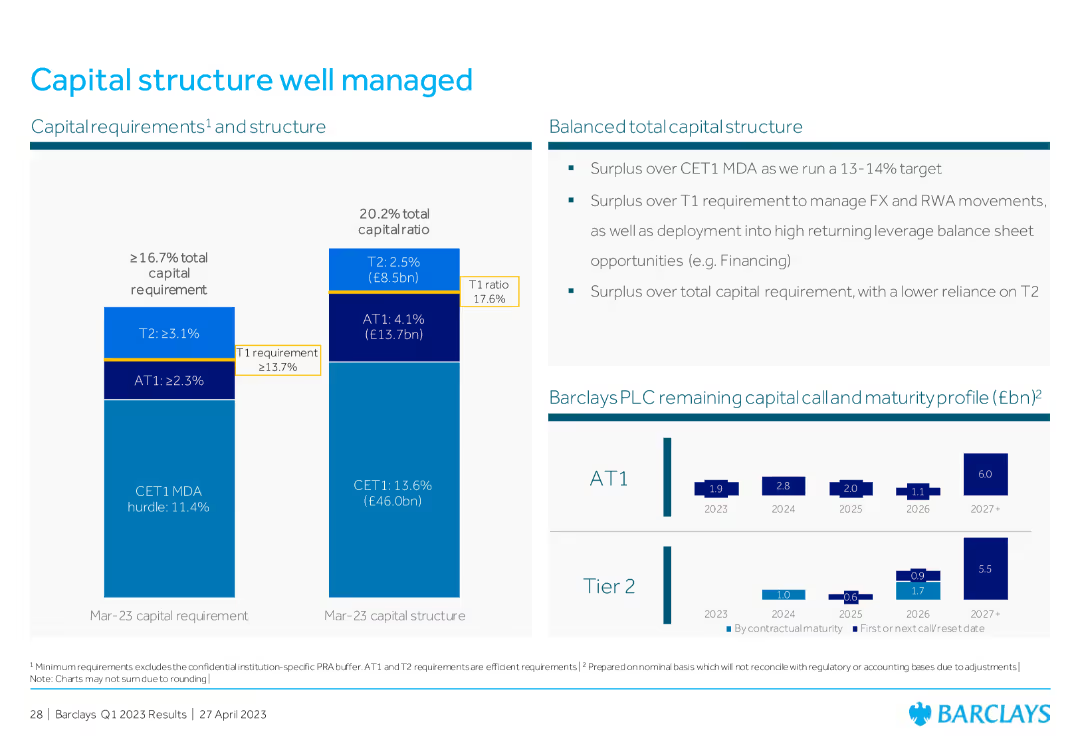
The slide contains multiple bar charts and graphical elements depicting capital structure requirements and surplus metrics, along with maturity profiles.
Strategic Planning
Financial Services
This slide illustrates the capital structure, showing total capital ratios, specific tier requirements, and the maturity profile of remaining capital calls. It emphasizes balanced capital management and future financial planning.
capital structure, surplus, maturity profile, tier
Multiple Chart
Barclays
Saved
The slide features a large image of an hourglass against a calendar background on the left. On the right, three column charts show firm operation years for total, hedge fund, and private equity.
Market Analysis and Trends
Financial Services
This slide presents data on how long firms have been in operation, divided into total, hedge fund, and private equity categories, with years of operation segmented in a column chart.
operation, firm, hedge fund, private equity, years
Multiple Chart
EY
Saved
A vibrant abstract image paired with a centered, bold numbered heading and descriptive text below.
Strategic Planning
Technology & Software
Discusses the shift to as-a-service models in the high-tech industry, highlighting the need for customer-centric, integrated experiences.
as-a-service, high-tech, customer experience, industry shift, integrated experiences
Title
Accenture
Saved
Featuring pie charts and column charts, this slide presents the geographical distribution and loan composition of Citigroup's credit portfolio. Different segments like 'ICG', 'PBWM', and 'Legacy Franchises' are detailed with color-coded charts for clear visual separation.
Risk Assessment and Management
Financial Services
Analyzing Citigroup's credit portfolio distribution and composition, this slide is key for risk assessment and management discussions. It visually conveys the diversification of loans across various regions and business segments, providing insights into credit risk profiles and financial stability.
Credit Portfolio, Citigroup, Risk Management, Geographical Distribution, Loan Composition, Diversification
Multiple Chart
Citigroup
Saved
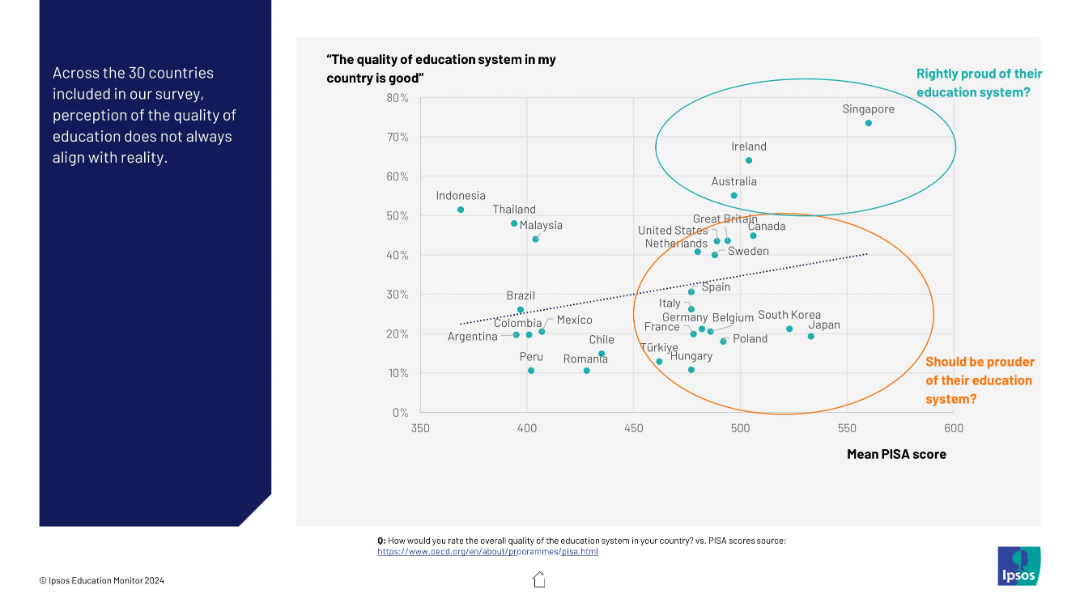
Scatter plot comparing countries’ self-rated education quality against their mean PISA scores, with regions circled to distinguish perception-reality mismatches.
Performance Metrics and KPIs
Education & Training
This visual compares public perception of education system quality with actual performance using PISA scores. Countries are grouped to highlight those underestimating or overestimating their system’s effectiveness.
education, PISA, perception, quality, comparison, countries, Ipsos, chart
Mixed Chart
IPSOS
Saved
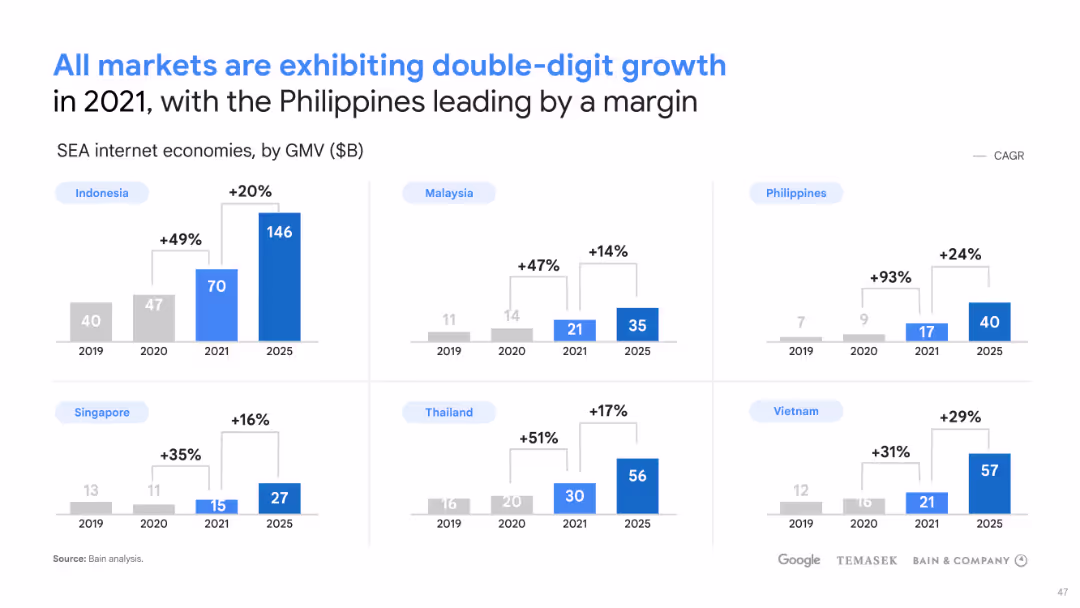
This slide displays column charts for internet economy sizes by country with projected growth. Colored bars represent different years.
Financial Performance
Financial Services
The slide shows historical and projected growth in Gross Merchandise Volume (GMV) for Southeast Asian internet economies. It highlights the Philippines' significant lead in growth, indicating a potential focus area for market investment and expansion strategies.
SEA, GMV, Growth, Internet, Economy
Multiple Chart
Bain
Saved
Features column charts and bullet points detailing key economic impacts and applications of Copernicus in forestry.
Industry Overview
Environmental Services & Sustainability
Explores the benefits of Earth Observation data for forestry, emphasizing improvements in forest management and economic benefits.
Forestry, Earth Observation, Management, Economic Benefits, Sustainability
Mixed Chart
PwC/Strategy&
Saved
The slide features a line chart showing wheat production volumes for Canada, Australia, and Ukraine, with annotations explaining the volatility and growth rates.
Market Analysis and Trends
Agriculture & Food Production
The slide explains the volatility in Australian wheat production compared to Canada and Ukraine, emphasizing the factors contributing to slower growth in Australia.
Wheat production, volatility, Australia, Canada, Ukraine, growth rate, agriculture, food production, market trends
Mixed Chart
LEK
Saved
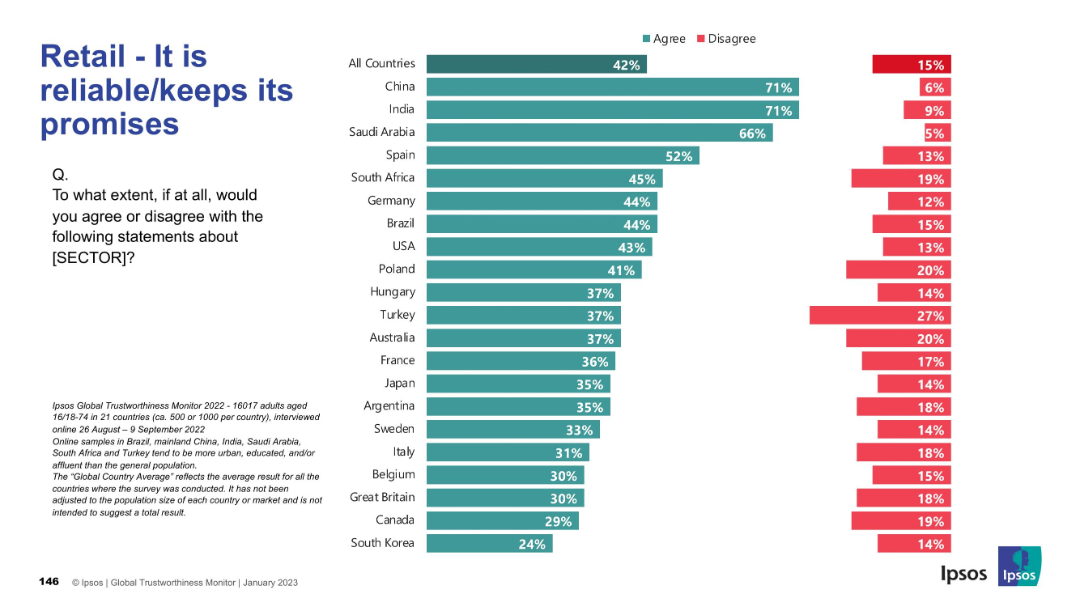
Similar horizontal bar chart, agree/disagree by country; dark teal and red color-coded bars.
Market Analysis and Trends
Retail & E-commerce
Evaluates whether consumers trust retail companies to keep their promises. India and China lead again, while countries like South Korea and Canada score lower.
reliability, promises, customer trust, perception, retail, countries, Ipsos
Mixed Chart
IPSOS
Saved
This slide includes two sets of column charts comparing the impact of energy prices and macroeconomic factors on investments in France versus other European countries, with executive commentary on energy costs and economic policies.
Investment Analysis
Financial Services
Discusses the economic influences affecting business investments in France, highlighting the adverse impacts of energy prices and macroeconomic factors like inflation and interest rates from 2022 to 2023.
investments, France, energy costs, inflation, interest rates, economic impact, business environment, European comparison, macroeconomic factors, corporate investment
Multiple Chart
Bain
Saved
Bar charts depicting the percentage difference between R&D and marketing budgets across different company sizes and industries.
Market Analysis and Trends
Professional Services
Analyzes how companies allocate funds between R&D and marketing, highlighting industry-specific strategies. This slide is key for strategic financial decisions and understanding industry trends in investment priorities.
R&D, marketing, budgets, comparison, industry, strategy, allocation, trends
Multiple Chart
Deloitte
Saved
The slide is primarily textual with a header at the top. It includes a list titled 'Key Tenets of our Strategy' with three strategic points, and a line chart on the right depicting 'Target State' with a timeline and plotted points, illustrating the future direction of funding costs.
Strategic Planning
Financial Services
Aimed at outlining strategic approaches for diversifying funding and managing assets and liabilities, this slide provides insights into the future funding cost targets, suitable for financial strategists or management.
funding strategy, asset management, liability management, line chart, strategic planning, diversification, financial goals, cost targets, liquidity optimization, financial forecasting
Mixed Chart
Goldman Sachs
Saved
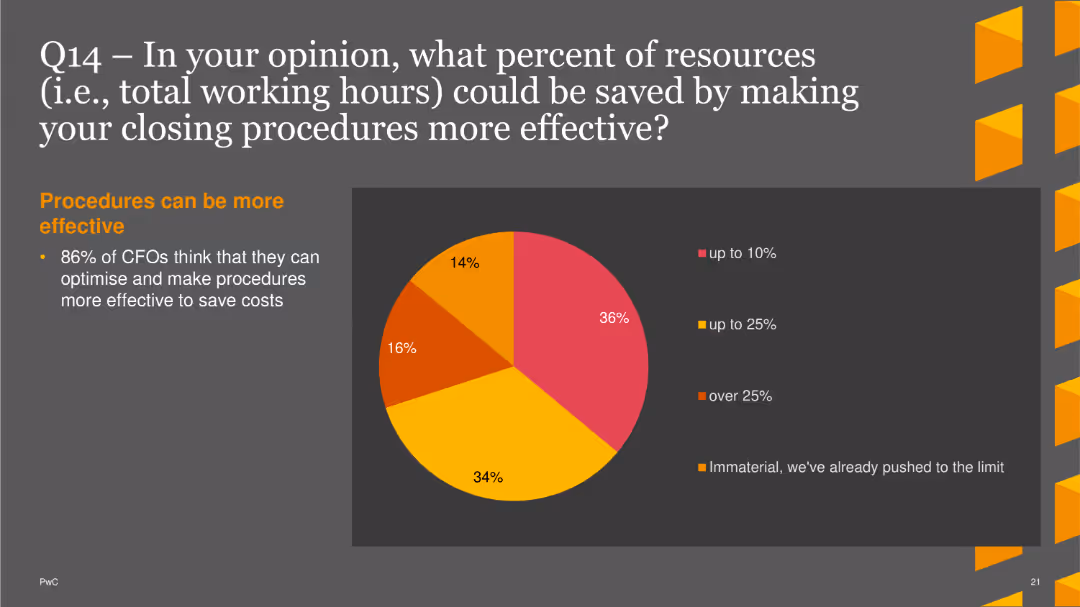
Four pie charts showing the current percentage of time spent on different tasks. Each chart is labeled with a task and its corresponding percentage
Operational Efficiency
Financial Services
This slide asks about current time allocation for tasks like data processing, analysis, forecasting, and decision-making within finance departments.
time allocation, data processing, analysis, forecasting, decision-making
Single Chart
PwC/Strategy&
Saved
A mix of text and illustrative graphics depicting seamless integration of sales channels with customer-first view and adaptive strategies, including examples.
Strategic Planning
Professional Services
Urges a customer-first approach in channel strategy, focusing on integrated experiences and continual experimentation for cross-channel success.
Channel Strategy, Customer Experience, Cross-Channel Integration, Seamless Experience
Header Horizontal
BCG
Saved
Features a combination of column charts showing dividend per share over time and a bar chart representing emission intensity reductions of operations.
Financial Performance
Financial Services
It's likely intended for investors, detailing dividend trends and corporate sustainability efforts.
Dividends, Emission Intensity, Sustainability, Financial, Investments, Shareholders, Trends
Multiple Chart
Goldman Sachs
Saved
The slide has column charts, text annotations, and percentage changes, with a clear separation between visual elements. The design is clean and data-oriented.
Financial Performance
Financial Services
Outlines significant growth and value delivered from 2012 to 2021 in card services. Ideal for retrospective financial reviews or historical performance analysis.
growth, value, financial review, historical performance, card services
Mixed Chart
JP Morgan
Saved
Slide with bullet points and checkboxes detailing strategies for businesses to consider in anticipation of returning to normal operations.
Strategic Planning
Professional Services
Provides a checklist for businesses on considerations and actions for transitioning back to normal operations after a crisis.
Return strategy, business preparedness, employee protection, customer reassurance
Vertical Flow
McKinsey
Saved
The slide features multiple bar charts and a bar chart, detailing changes in DE&I spending by company size, sales, and economic sectors. Colors are red and grey.
Market Analysis and Trends
Professional Services
Details DE&I spending trends across various company sizes and sectors, highlighting significant increases in B2C sectors and larger firms.
DE&I, marketing, trends, B2C, spending, company size, retail, communications, real estate, economic sector
Multiple Chart
Deloitte
Saved
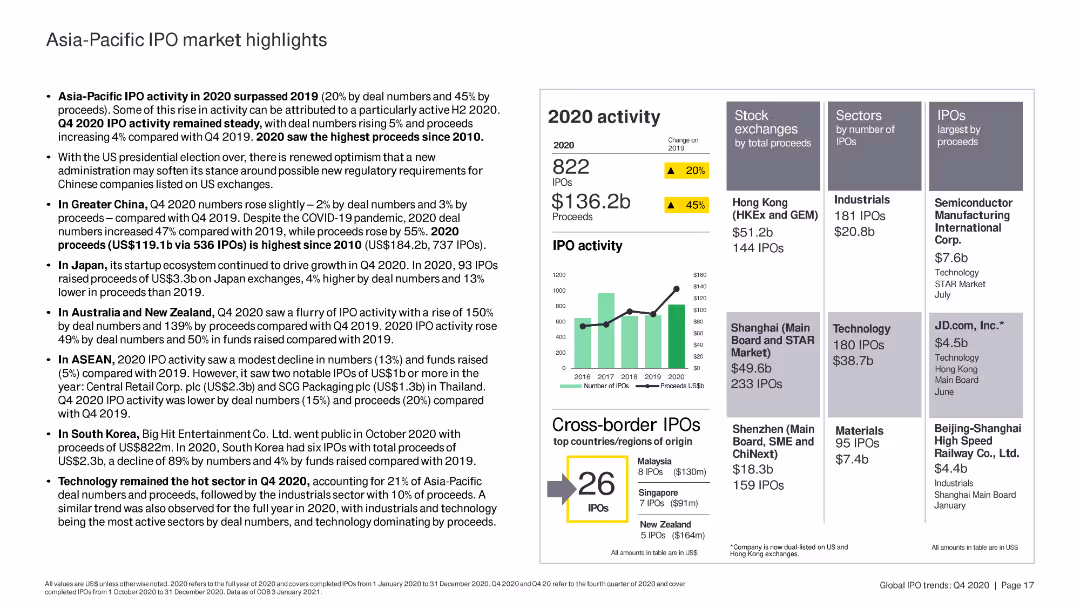
The slide features column charts and bar charts summarizing IPO activity in the Asia-Pacific region, highlighting key stock exchanges and sectors by proceeds.
Market Analysis and Trends
Financial Services
The slide provides an overview of IPO activity in the Asia-Pacific region in 2020, emphasizing key stock exchanges, sectors by proceeds, and cross-border IPOs.
Asia-Pacific, IPO, stock exchanges, sectors, 2020
Mixed Chart
EY
Saved
Includes pie charts and a column chart showcasing types of real estate and financial risk assessments. Detailed annotations aid in understanding.
Investment Analysis
Real Estate & Construction
Further analysis of the CRE investment risks and modifications for loan recovery, important for strategic real estate management.
CRE, investment risks, loan management, real estate, strategic planning
Multiple Chart
Deutsche Bank
Saved
Column chart comparing alignment over time with insights on factors influencing alignment in different sectors.
Strategic Planning
Professional Services
Highlights improvements in alignment between marketing and finance, discussing implications for strategic and financial planning.
alignment, marketing, finance, strategic planning, sector influence
Mixed Chart
Deloitte
Saved
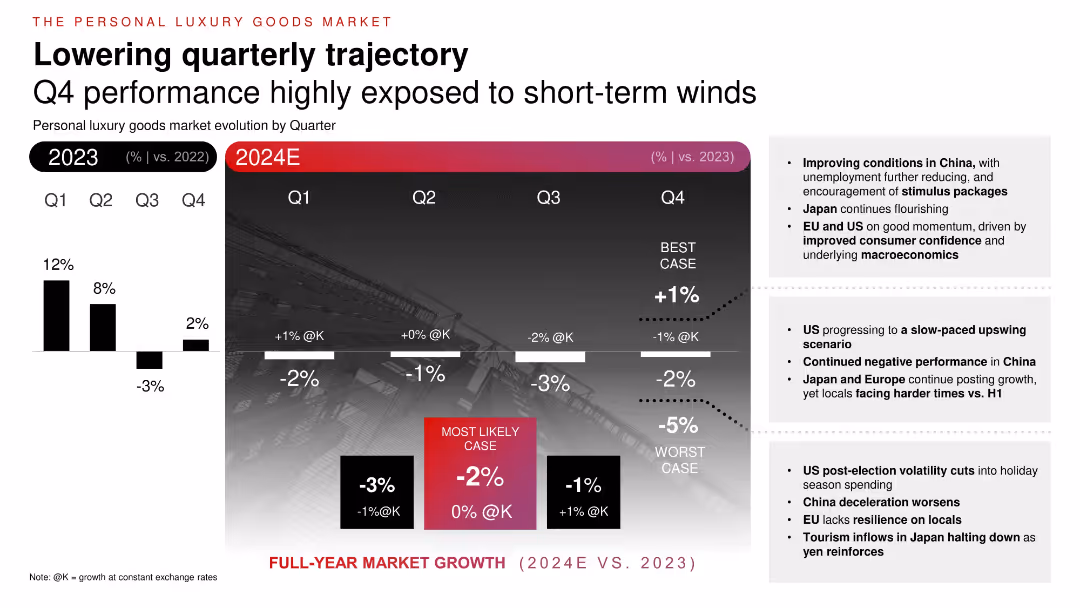
Two-part chart comparing 2023 quarterly growth with 2024 forecasts. Gradient background with projected performance ranges (best, worst, likely cases). Bullet insights on the right.
Financial Performance
Consumer Goods
Projects quarterly evolution of personal luxury goods in 2024. Shows decreasing growth throughout the year, with best-case and worst-case ranges. Factors include macroeconomic conditions, stimulus in China, and consumer confidence in the US and EU. Emphasizes H2 uncertainty and regional divergence in performance.
quarterly growth, luxury slowdown, projections, consumer sentiment, 2024, economic impact
Mixed Chart
Bain
Saved
Previous
Next
If nothing, comes up, please save your slides first
Create a FREE account to continue browsing
Receive Instant Access to 1,000+ slides from companies like McKinsey, Google, and Goldman Sachs
First Name
Last Name
Email
Password
I agree to all
Terms & Privacy Policy
Thank you! Your submission has been received!
Oops! Something went wrong while submitting the form.
Have an account?
Sign in
Column Chart
Heatmap
Chevron
Org Chart
Infographic
Callouts
Timeline
List
Graphic
Picture
Process Flow
Diagram
Paragraph
Map
Table
Framework
Subtitle
Takeaway Box
Icon
Other Chart
Radar Chart
Waterfall Chart
Mekko Chart
Pie Chart
Scatter Plot
Line Chart
Bar chart
Bullet points