My Account
My Slides
Search by Category
Templates
Leave Feedback
Login
Logout
Get Started
Browse all Slides
Browse all Slides
Create a FREE Account
Instant access to 1,000+ real slides from top companies like McKinsey, BCG, Goldman Sachs, Google and many more!
First Name
Last Name
Email
Password
I agree to all
Terms & Privacy Policy
Thank you! Your submission has been received!
Oops! Something went wrong while submitting the form.
Have an account?
Sign in
Saved Slides
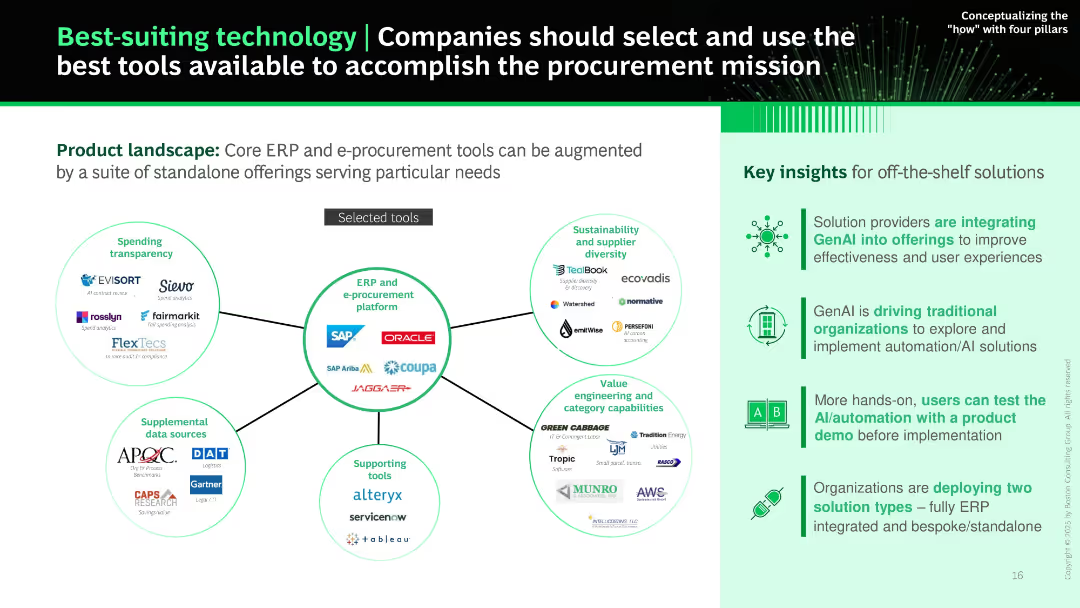
Central hub-and-spoke diagram surrounded by tool logos grouped by function (e.g., ERP, transparency, supplier diversity). Side panel summarizes key insights.
Product and Service Analysis
Technology & Software
Maps out the procurement technology landscape with core ERP platforms at the center and supplemental tools around them. Recommends selecting tools based on need and readiness for GenAI adoption. Insights include trends in ERP integration and standalone solution adoption.
ERP, procurement tools, technology selection, GenAI, software landscape, sourcing, AI tools
Boxed
BCG
Saved
Two comparative charts showing AI-enabled consumer intelligence platforms and marketing measurement and optimization solutions. One is in green shades, the other in blue.
Market Analysis and Trends
Technology & Software
This slide compares leading AI-enabled solutions in consumer intelligence and marketing measurement. It highlights strong performers and leaders in the market.
AI, Consumer Intelligence, Marketing, Optimization, Trends
Multiple Chart
IPSOS
Saved
Column chart of wheat export and consumption volumes by state, with accompanying text explaining export trends and domestic consumption patterns.
Market Analysis and Trends
Agriculture & Food Production
The slide examines Australian wheat export trends, noting that WA is the largest exporter, and explains the balance between domestic demand and export volumes.
wheat export, domestic demand, WA, export trends, consumption patterns
Mixed Chart
LEK
Saved
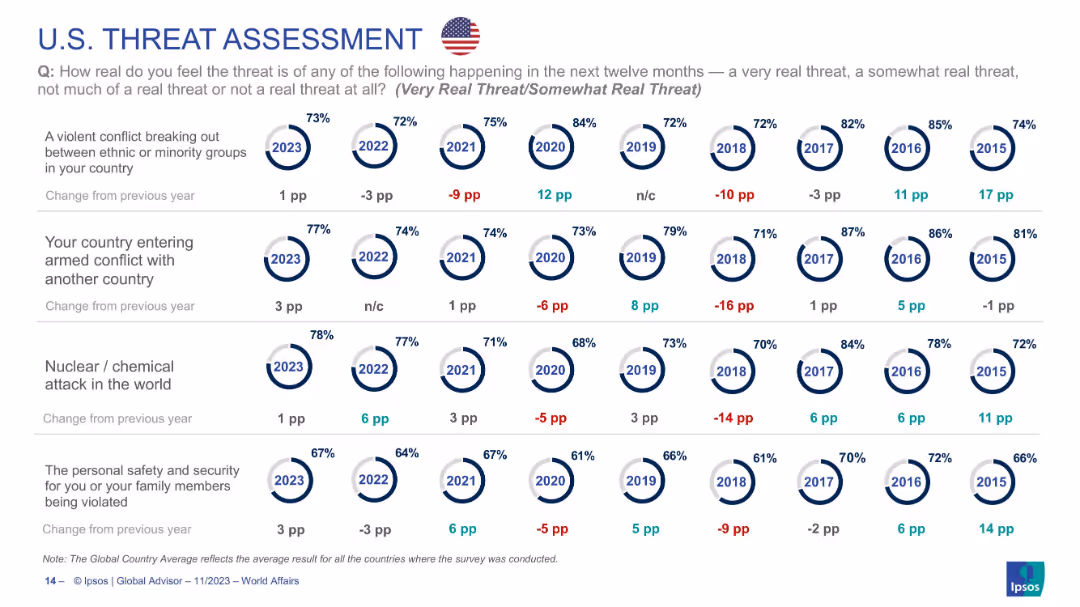
Continuation of U.S. threat data across four more categories; same visual style and layout as prior slides.
Risk Assessment and Management
Government & Public Sector
Explores U.S. threat perception regarding ethnic conflict, military conflict, nuclear/chemical attack, and personal safety. Shows general stability in concern, with slight increases in 2023. Presents longitudinal perspective on threat awareness in American society.
USA, terrorism, nuclear attack, personal security, public opinion, ethnic conflict, geopolitical tension
Single Chart
IPSOS
Saved
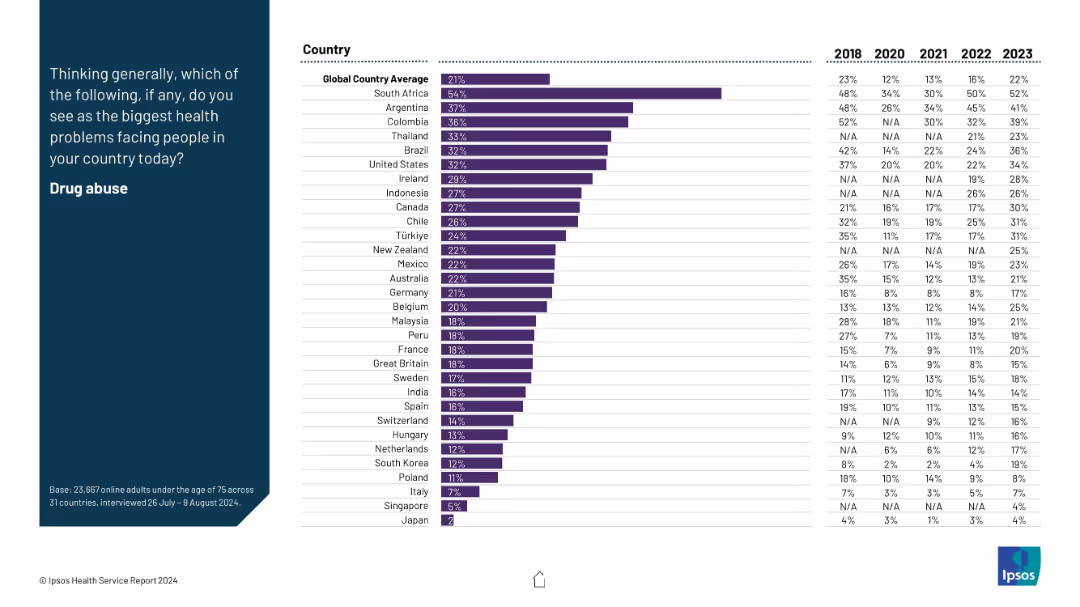
Horizontal bar chart on right with countries and multi-year data (2018–2023); prompt on the left.
Market Analysis and Trends
Healthcare & Pharmaceuticals
The slide displays country-level concern about drug abuse as a health issue. South Africa and Argentina rank highest. Time series data reveal increases in perceived severity in several regions. The global average is 21%, underscoring widespread concern.
drug abuse, addiction, health problem, global perception, survey
Mixed Chart
IPSOS
Saved
Comprises column charts illustrating the percentage of respondents focusing on growth actions from 2022 to 2023, segmented by region (North America, Europe, Asia), highlighting shifts in strategic focus.
Market Analysis and Trends
Financial Services
Discusses the strategic shifts in growth actions among C-suite executives across various regions from 2022 to 2023, focusing on the increased emphasis on growth despite economic uncertainties.
growth actions, C-suite strategies, economic uncertainty, regional focus
Multiple Chart
BCG
Saved
Slide with statistical data represented in charts, focused on mental and physical health concerns among women.
Technology and Digital Transformation
Healthcare & Pharmaceuticals
This slide examines critical concerns regarding women's mental and physical health, stressing the importance of well-being and the ability to switch off from work.
Health, Women, Mental Health, Physical Health, Data
Title
Deloitte
Saved
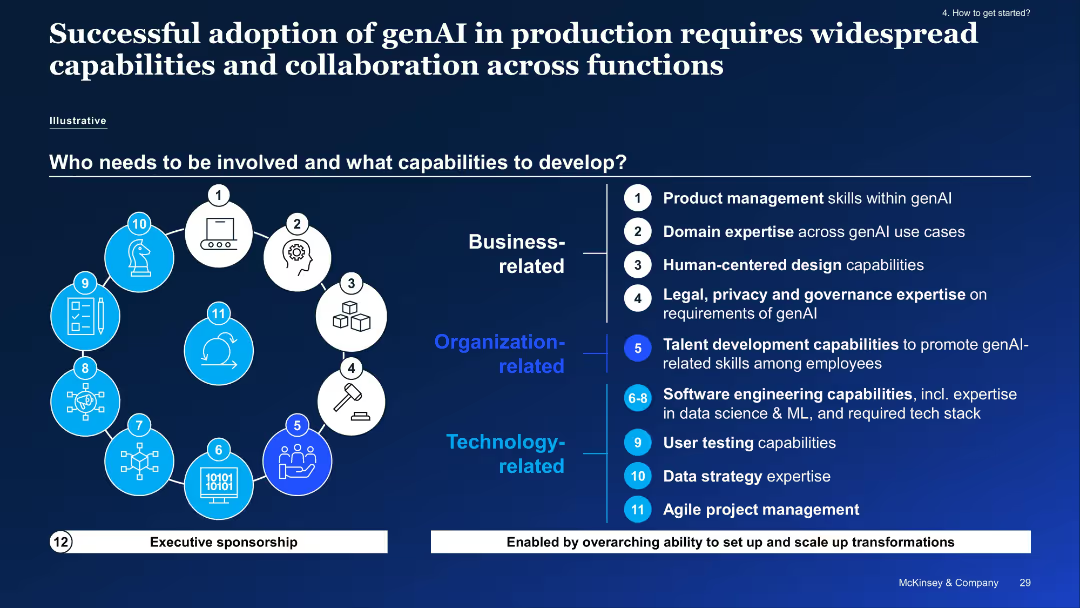
Visual icons with role-based capabilities split into business, organizational, and tech categories; key capabilities listed.
Organizational Structure and Change
Industrial & Manufacturing
Details cross-functional capabilities needed for successful genAI deployment, spanning PM skills, legal expertise, and agile project management, emphasizing executive sponsorship and transformation setup.
cross-functional, genAI, collaboration, governance, talent, data strategy, agile
Vertical Flow
McKinsey
Saved
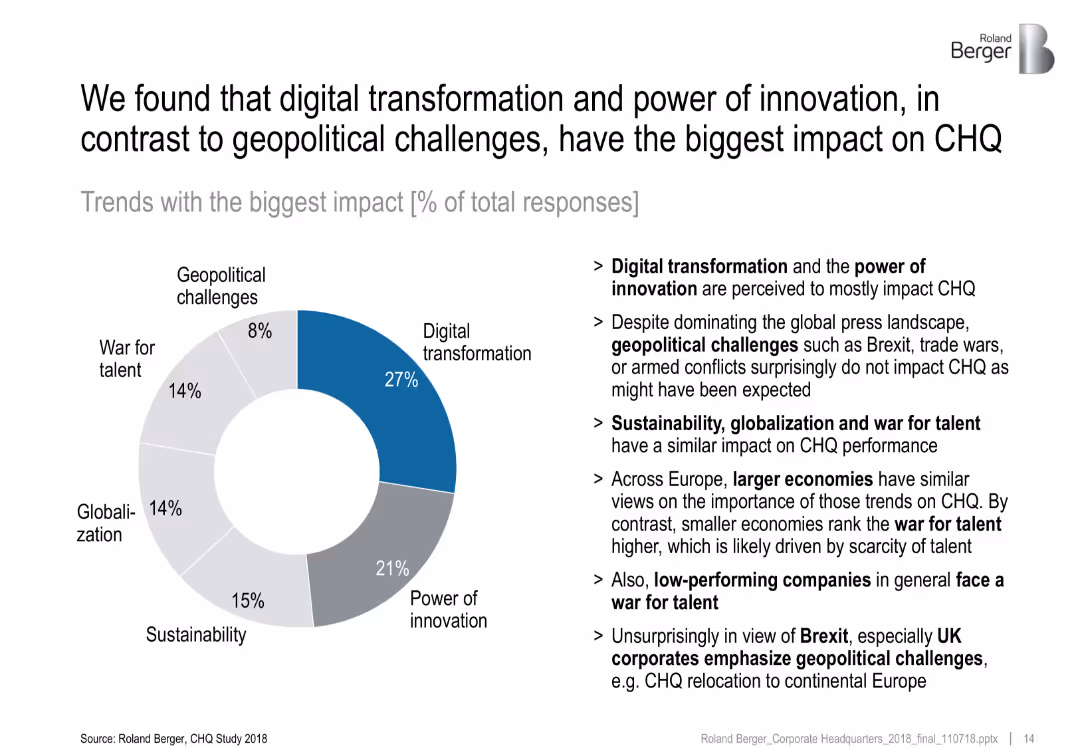
Donut chart with percentage shares of six megatrends; bullet points on the right provide insights
Market Analysis and Trends
Professional Services
This slide reveals survey results on which megatrends most impact CHQ. Digital transformation (27%) and innovation (21%) are dominant, while geopolitical issues score lowest (8%). Text insights interpret regional differences and performance-level correlations.
digital transformation, innovation, impact analysis, geopolitics, survey, CHQ
Mixed Chart
Roland Berger
Saved
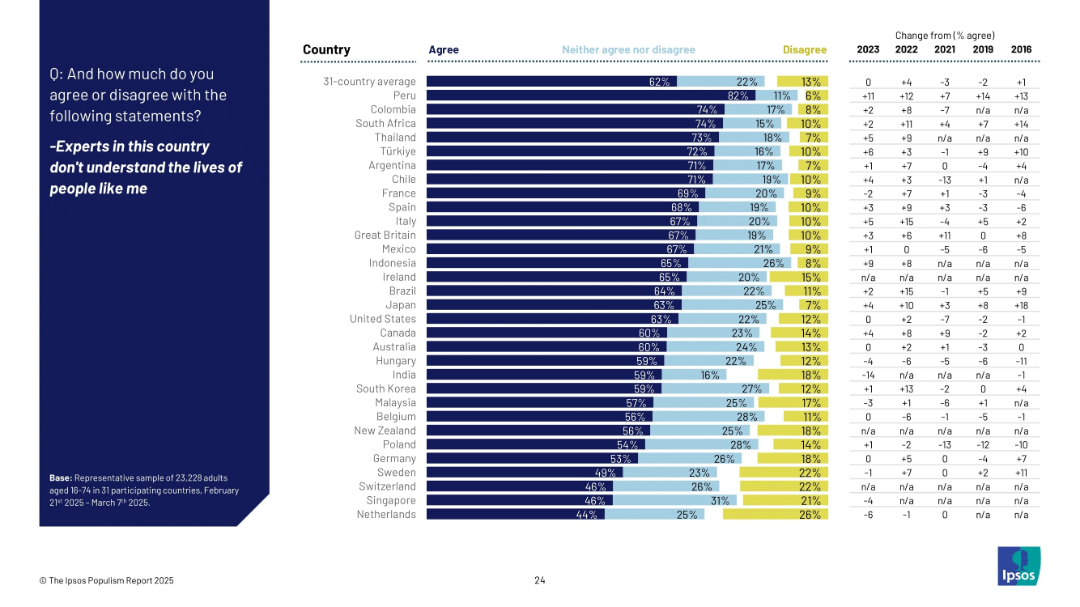
Full slide with horizontal bar chart by country showing % agree, neutral, and disagree, with right column showing change from past years.
Market Analysis and Trends
Government & Public Sector
The slide presents agreement levels with the statement that experts are disconnected from ordinary people's lives across 31 countries. Japan ranks mid-range, with notable increases in perception of disconnect in Italy and others.
experts, disconnect, public perception, agreement, international, trend, Ipsos, comparison, 2025, survey
Mixed Chart
IPSOS
Saved
The slide features multiple visualizations, including a line graph for daily exceptions, a pie chart for open exceptions per department, and various data tables showing exceptions by category and aging analysis.
Operational Efficiency
Energy & Utilities
The slide provides insights into managing business exceptions, displaying data on daily exceptions, departmental exceptions, and aging analysis of open exceptions, helping in operational decision-making.
Business, Exceptions, Management, Analysis, Operational
Multiple Chart
EY
Saved
Features combined column charts on demand, supply, and forecast of refined nickel with annotations on a dark background. Focuses on the discrepancy between supply and expected demand from 2021 to 2031.
Market Analysis and Trends
Energy & Utilities
Discusses the projected supply and demand for refined nickel, indicating a potential long-term shortage influenced by electric vehicle production, despite efforts to balance market pressures with alternative technologies.
nickel, supply demand, electric vehicles, shortage
Single Chart
McKinsey
Saved
Features two line graphs showing year-over-year industrial production growth in the U.S. and EU. The slide uses red and blue lines against a light green background for clarity.
Operational Efficiency
Industrial & Manufacturing
Discusses recent trends in manufacturing and industrial production in the U.S. and EU, highlighting changes in growth rates. This slide is beneficial for understanding sectoral health and economic conditions.
Manufacturing, Industrial Production, US, EU, Growth Rates
Single Chart
Deutsche Bank
Saved
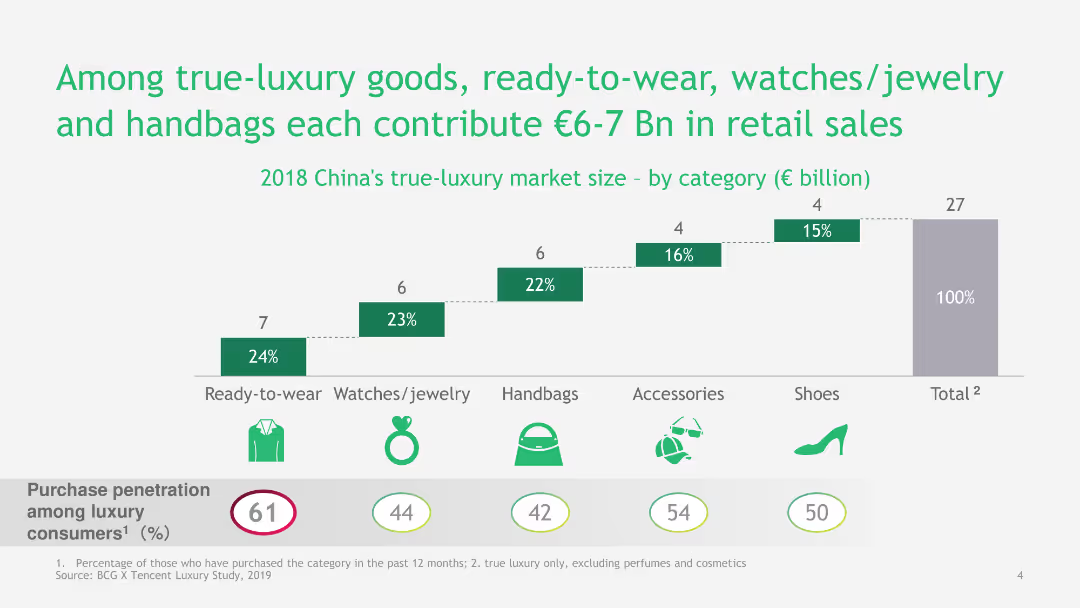
This slide includes a bar chart and infographics to detail the contribution of different luxury goods to retail sales in China. It uses icons and a clear, structured layout.
Market Analysis and Trends
Consumer Goods
The slide breaks down the contribution of various luxury goods categories to China's retail market, highlighting the market size and penetration rates for each category.
Luxury Goods, Ready-to-Wear, Watches, Jewelry, Handbags, Retail Sales, China, Market Size, Penetration Rates
Single Chart
BCG
Saved
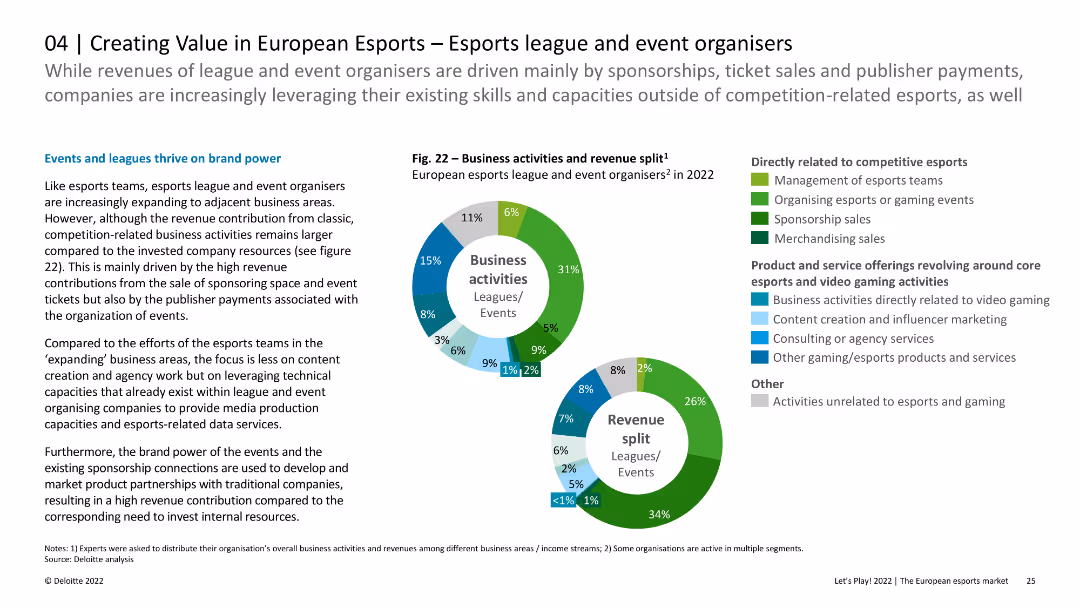
The slide presents a pie chart detailing business activities and revenue split for esports leagues and event organizers in 2022. Another pie chart shows revenue sources. Text explains trends and strategies.
Market Analysis and Trends
Media & Entertainment
This slide examines the revenue and business activities split for European esports leagues and event organizers in 2022. It discusses how brand power and sponsorship drive revenue, alongside strategies for growth and diversification.
esports, revenue, business activities, sponsorship, trends
Multiple Chart
Deloitte
Saved
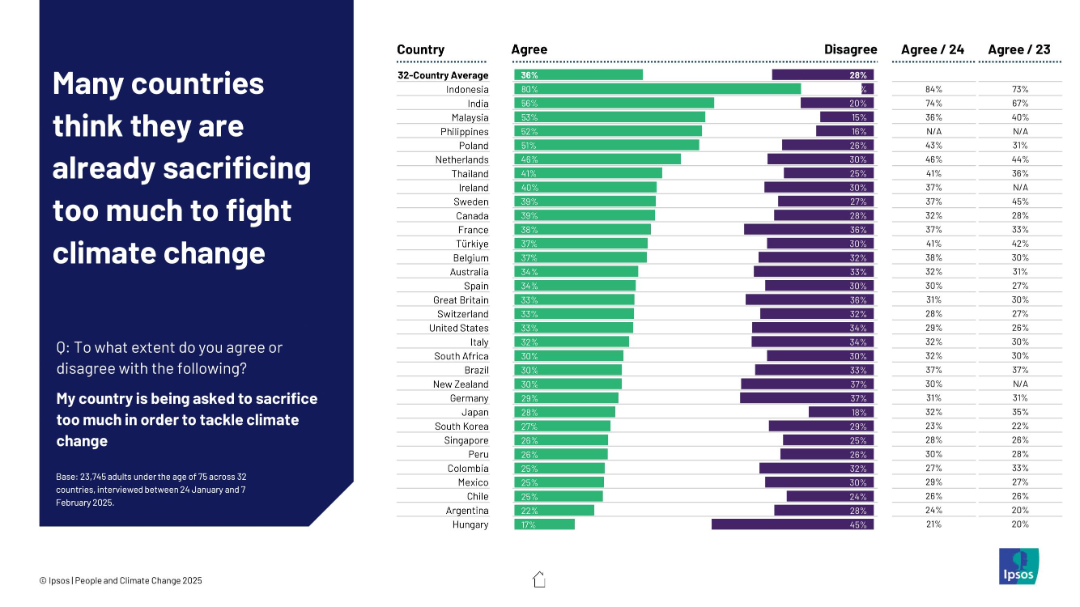
Left-aligned header on dark blue background; right side presents a horizontal bar chart ranking agreement by country with comparative historical data
Customer and Market Segmentation
Environmental Services & Sustainability
This slide shows that people in countries like Indonesia and India feel their nations are sacrificing too much to tackle climate change. The data is contextualized with agreement percentages from 2023 and 2024, indicating shifting attitudes over time.
sacrifice, climate change, public opinion, survey, Ipsos, 2025, international comparison, perception shift, sustainability
Mixed Chart
IPSOS
Saved
Features a flow diagram and text blocks assessing multiple scenarios based on vaccine characteristics and global response strategies.
Strategic Planning
Healthcare & Pharmaceuticals
Offers strategic insights into potential futures depending on vaccine and therapeutic developments, including impact on public health and policy decisions.
scenarios, vaccine, planning, COVID-19
Table
BCG
Saved
Continues from the previous slide, adding further technological innovations and their implications for various sectors.
Technology and Digital Transformation
Technology & Software
Continues to detail emerging space technologies, including laser communications, edge computing, and in-orbit servicing capabilities.
space technologies, communications, digital capabilities, deep-space exploration
Header Horizontal
McKinsey
Saved
The slide contains multiple column charts and a bar chart showing data on private equity dry powder, unrealized portfolio value, and fundraising activity.
Market Analysis and Trends
Financial Services
The slide discusses the positive outlook for sponsor dynamics in private equity, indicating continued activity into 2019, with supportive data.
sponsor dynamics, private equity, 2019, dry powder, portfolio value, fundraising, activity, market analysis
Multiple Chart
Credit Suisse
Saved
The slide contains two column charts. The left chart compares digital financial service usage between FinTech users and non-users. The right chart shows adoption by age bracket.
Customer and Market Segmentation
Financial Services
The slide analyzes preferences for digital financial solutions among FinTech users compared to non-users, and details FinTech adoption rates across different age groups.
FinTech, digital solutions, user preferences, age demographics, adoption
Multiple Chart
EY
Saved
Simple visual agenda with circular motif on left and 4-step linear agenda list on right side
Strategic Planning
Artificial Intelligence
Overview of presentation topics related to generative AI: introduction, use cases, Deutsche Telekom case, and steps to get started. The slide uses minimalist icons and a blue gradient background for clarity.
agenda, generative AI, introduction, strategy, presentation topics
Agenda
McKinsey
Saved
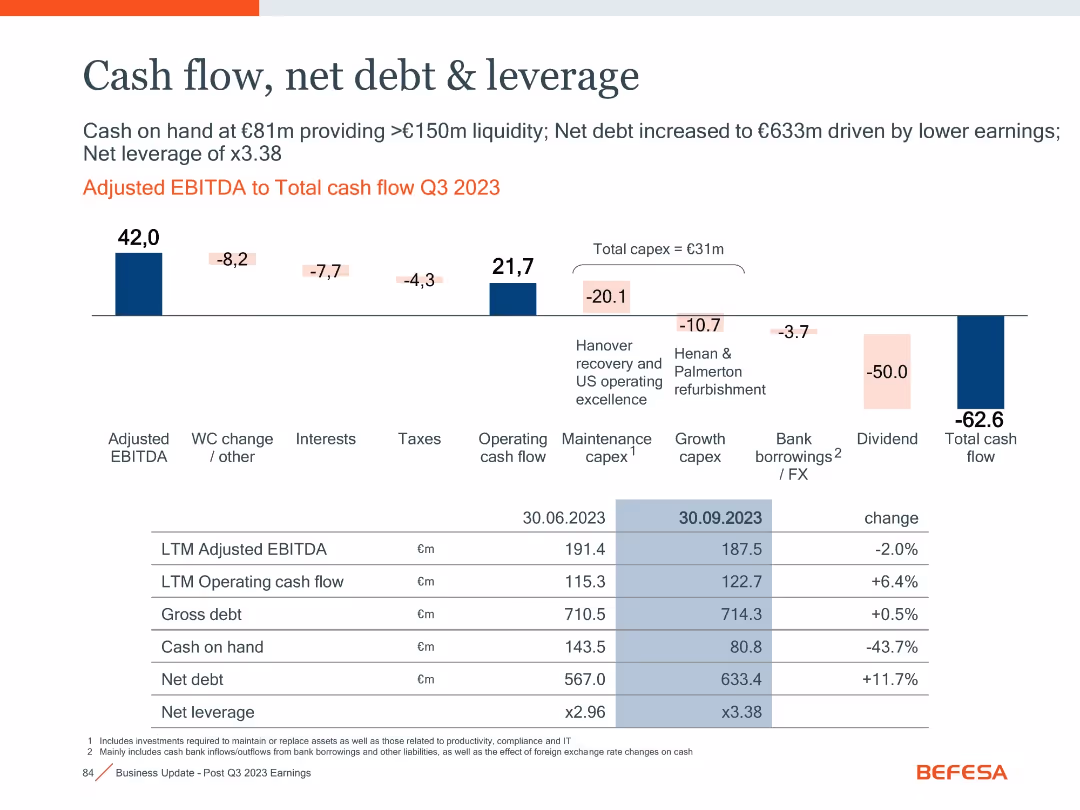
Horizontal waterfall chart and detailed financial metrics table
Financial Performance
Financial Services
The slide illustrates cash flow movement in Q3 2023, highlighting major components like capex, dividend payouts, and leverage metrics, with changes over time.
Cash Flow, Leverage, Net Debt, Capex, Dividend, EBITDA
Mixed Chart
Goldman Sachs
Saved
The slide has a white background with blue circles and lines outlining three triggers for regime changes: new solvency framework, new regulatory intervention level, and significant revisions to the existing framework. Each trigger is described with a brief explanation in blue text.
Regulatory and Compliance
Financial Services
This slide outlines the triggers for regime changes in the financial sector, including new solvency frameworks, regulatory intervention levels, and revisions to existing frameworks, providing a structured approach to understanding these changes.
regime change, triggers, solvency, regulatory, compliance
Framework
Oliver Wyman
Saved
A content slide featuring text on the left and a column chart on the right. The chart shows expected changes in FTE risk management professionals over the next five years.
Human Resources and Talent Management
Financial Services
The slide discusses the projected increase in risk management resources in banks' first and second lines of defense, highlighting expected headcount changes.
resources, FTE, risk management, first line, second line
Multiple Chart
EY
Saved
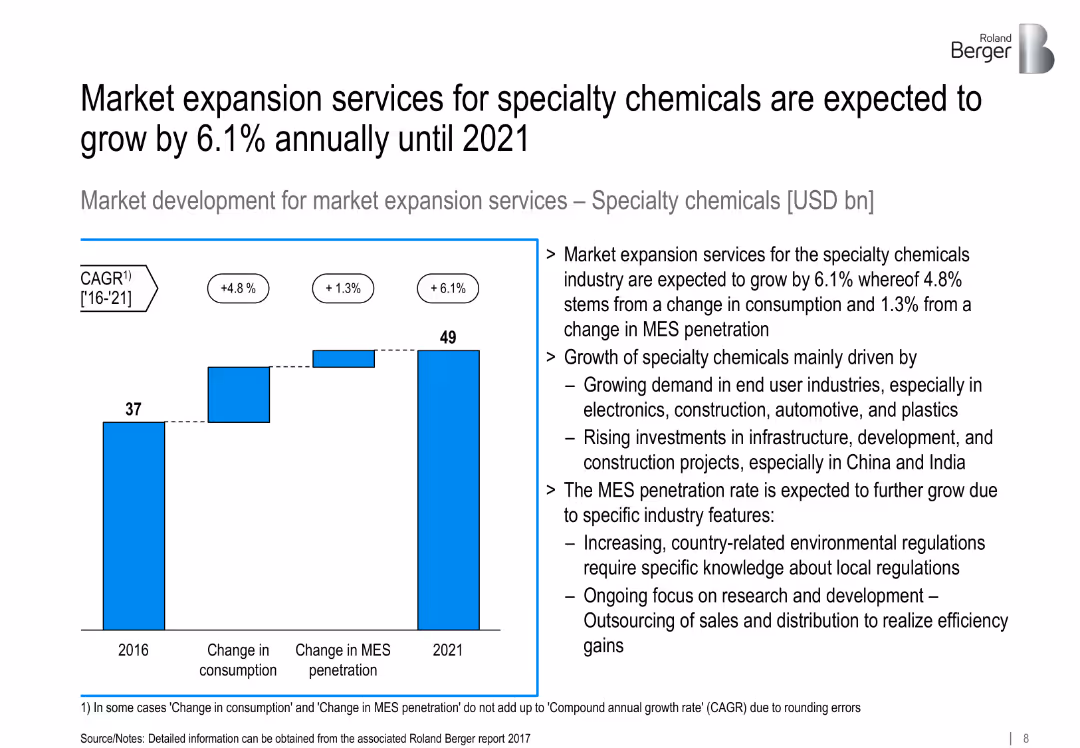
Bar chart showing growth from 2016 to 2021; supporting analysis on industry trends.
Market Analysis and Trends
Industrial & Manufacturing
Projects 6.1% CAGR in MES for specialty chemicals, driven by end-user demand, infrastructure development, and increasing R&D outsourcing.
specialty chemicals, MES, infrastructure, consumption, R&D outsourcing
Mixed Chart
Roland Berger
Saved
Previous
Next
If nothing, comes up, please save your slides first
Create a FREE account to continue browsing
Receive Instant Access to 1,000+ slides from companies like McKinsey, Google, and Goldman Sachs
First Name
Last Name
Email
Password
I agree to all
Terms & Privacy Policy
Thank you! Your submission has been received!
Oops! Something went wrong while submitting the form.
Have an account?
Sign in
Column Chart
Heatmap
Chevron
Org Chart
Infographic
Callouts
Timeline
List
Graphic
Picture
Process Flow
Diagram
Paragraph
Map
Table
Framework
Subtitle
Takeaway Box
Icon
Other Chart
Radar Chart
Waterfall Chart
Mekko Chart
Pie Chart
Scatter Plot
Line Chart
Bar chart
Bullet points