My Account
My Slides
Search by Category
Templates
Leave Feedback
Login
Logout
Get Started
Browse all Slides
Browse all Slides
Create a FREE Account
Instant access to 1,000+ real slides from top companies like McKinsey, BCG, Goldman Sachs, Google and many more!
First Name
Last Name
Email
Password
I agree to all
Terms & Privacy Policy
Thank you! Your submission has been received!
Oops! Something went wrong while submitting the form.
Have an account?
Sign in
Saved Slides
The slide outlines team, category, and supplier excellence pillars with icons and a diagram of Kearney's House of Purchasing and SupplySM.
Human Resources and Talent Management
Professional Services
It describes the pillars for sustained procurement performance, highlighting the roles of team excellence, category excellence, and supplier excellence.
Team excellence, category excellence, supplier excellence, procurement, performance, talent
Diagram
Kearney
Saved
Large text blocks with two percentage rings, detailing brand-switching statistics.
Customer and Market Segmentation
Retail & E-commerce
Analysis of the increasing trend of consumers trying different brands and small players set to benefit.
brand-switching, consumer trends, market analysis, retail, brands
Multiple Chart
Bain
Saved
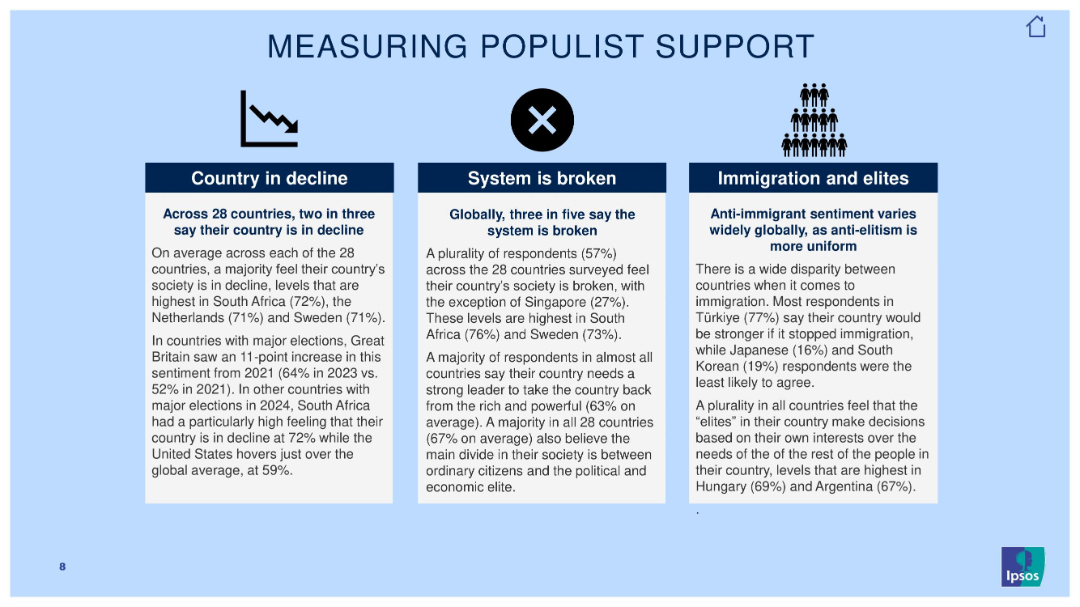
Three-column layout on pale blue background with icons and text describing three metrics: country decline, broken system, and immigration/elite sentiments.
Strategic Planning
Government & Public Sector
Explains indicators of populist sentiment across 28 countries, covering belief in national decline, systemic dysfunction, and anti-elite/anti-immigrant attitudes, with examples of countries with strongest sentiments.
populism, elites, immigration, system distrust, perception, Ipsos, decline, sentiment
Pillar
IPSOS
Saved
Displays a line graph showing the adoption rates of SVOD from 2018 to 2023, with a highlight on the COVID-19 impact. The design is minimalistic with a focus on trend lines and data points.
Market Analysis and Trends
Media & Entertainment
Reviews the subscription rates of video streaming services over recent years, noting a plateau in growth. Useful for analyzing media consumption trends and forecasting future changes in the entertainment industry.
SVOD, media trends, COVID-19, streaming, adoption
Mixed Chart
Deloitte
Saved
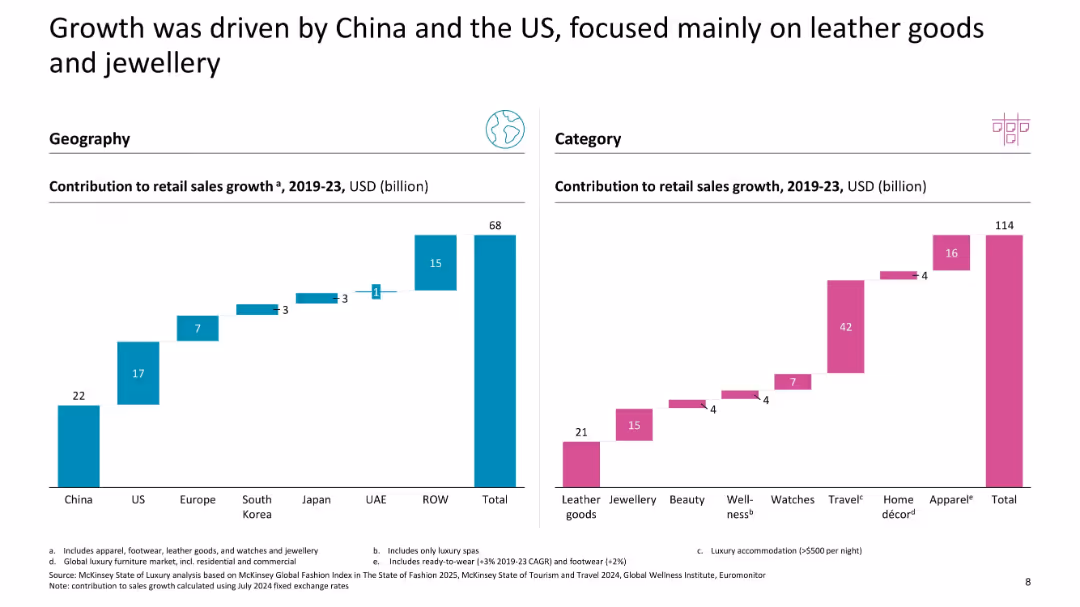
Two waterfall charts: left by region, right by category (USD contribution to retail sales growth)
Market Analysis and Trends
Consumer Goods
This slide showcases regional and categorical contributors to luxury retail sales growth between 2019–2023, with China and the US leading geographically, and leather goods and travel products leading categorically.
sales growth, China, US, leather goods, jewellery, geography, category breakdown, USD contribution
Multiple Chart
McKinsey
Saved
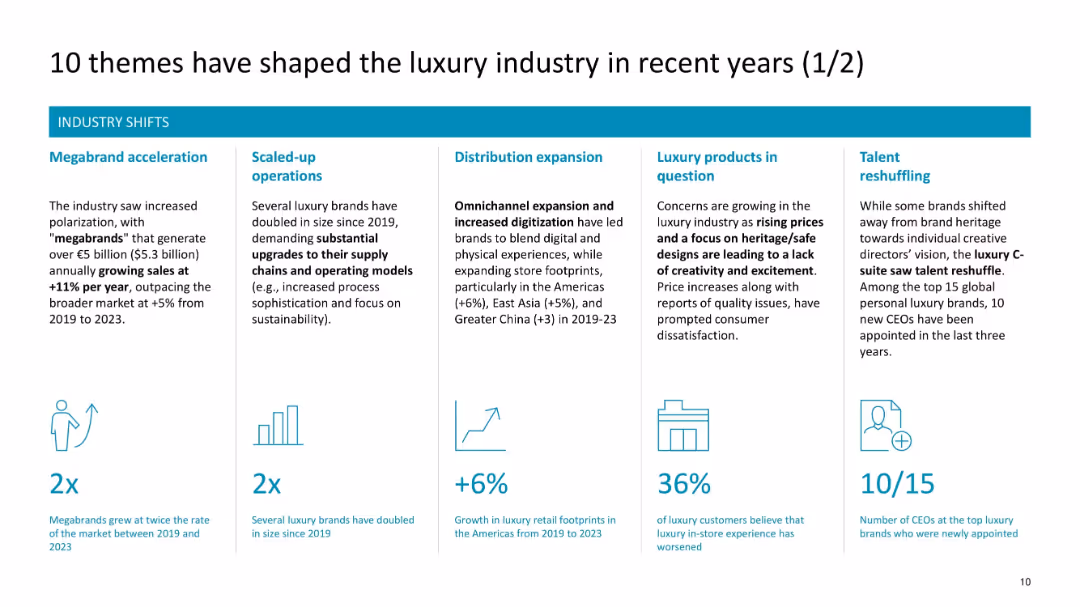
Horizontal layout with six themed boxes (icons + text) on industry shifts
Strategic Planning
Consumer Goods
This slide presents six key industry-wide changes including megabrand growth, operational scaling, distribution expansion, concerns over product creativity, and CEO reshuffling trends.
megabrands, operations, distribution, reshuffling, industry shifts, retail expansion, price sensitivity
Pillar
McKinsey
Saved
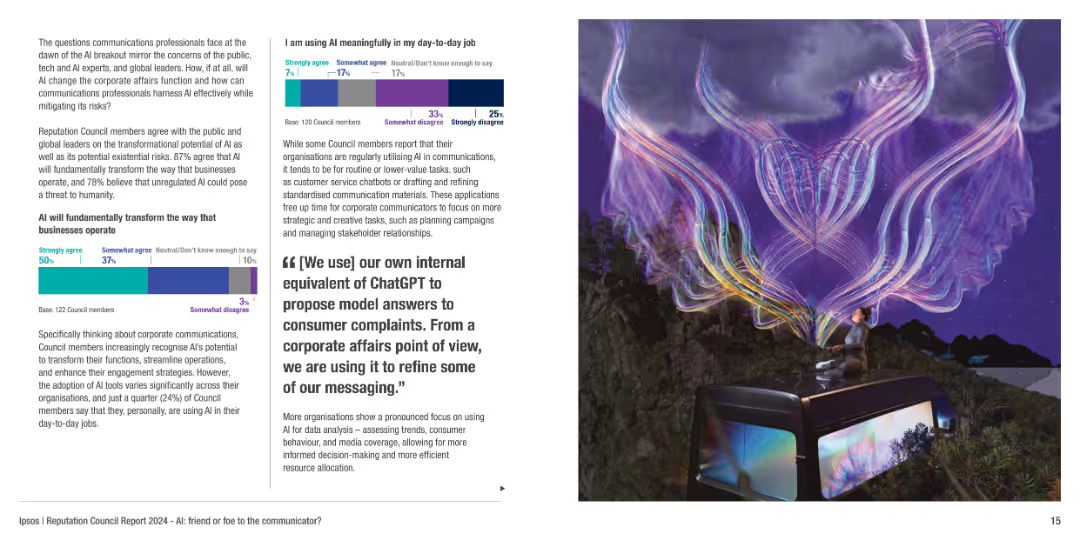
The slide includes a mixture of text, column charts, and a visually striking image depicting AI's impact on communication.
Technology and Digital Transformation
Technology & Software
Discusses the transformative potential of AI in corporate communications, its risks, and how organizations are adapting AI tools for efficiency and engagement.
AI, communication, technology impact, digital transformation, risks
Multiple Chart
IPSOS
Saved
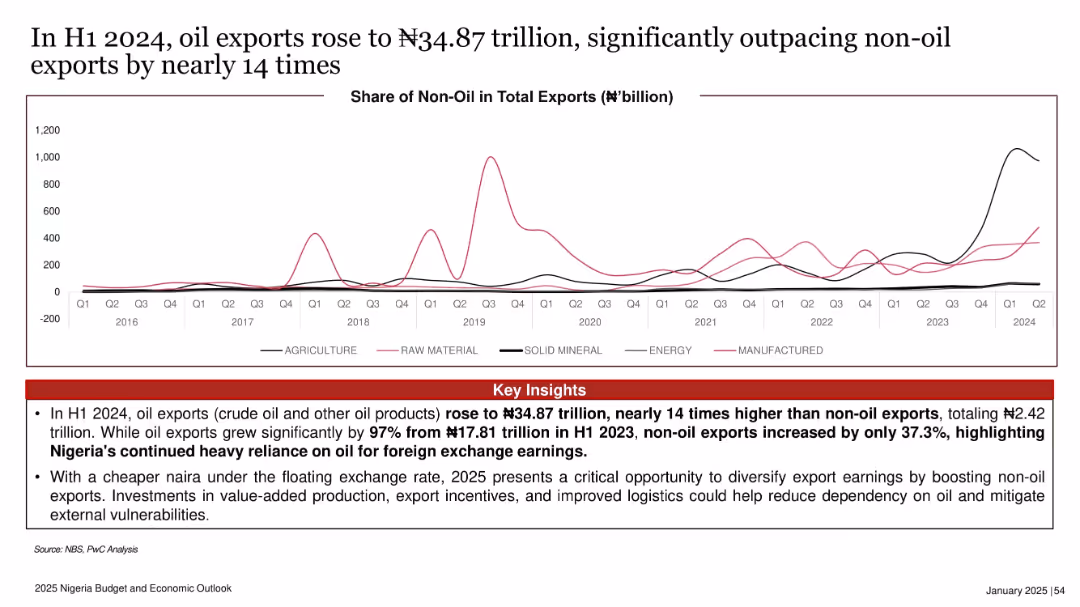
Line graph showing non-oil exports across various categories from 2016 to 2024. Key insights highlighted in red below.
Strategic Planning
Energy & Utilities
This slide emphasizes Nigeria’s overwhelming dependence on oil exports, which in H1 2024 were 14 times higher than non-oil exports. It calls for export diversification through policy reform and investment in non-oil sectors.
oil exports, non-oil exports, trade imbalance, diversification, 2024, foreign exchange, policy reform
Mixed Chart
PwC/Strategy&
Saved
Discusses challenges in implementing GBS models with bar graphs (Figure 8) showing challenge ratings.
Strategic Planning
Professional Services
Focuses on overcoming cultural, technological, and strategic challenges in GBS operations.
GBS, challenges, strategy, culture, technology
Mixed Chart
Deloitte
Saved
This slide features a line chart depicting changes in CEO confidence levels for revenue growth over the next 12 months and three years. The chart uses two color lines to differentiate the timeframes. A text block on the left provides context.
Market Analysis and Trends
Professional Services
The slide analyzes the declining confidence levels among CEOs regarding their organization's revenue growth prospects, with a focus on the impacts of external factors and market conditions.
CEO confidence, revenue growth, market analysis, trends, external factors
Mixed Chart
PwC/Strategy&
Saved
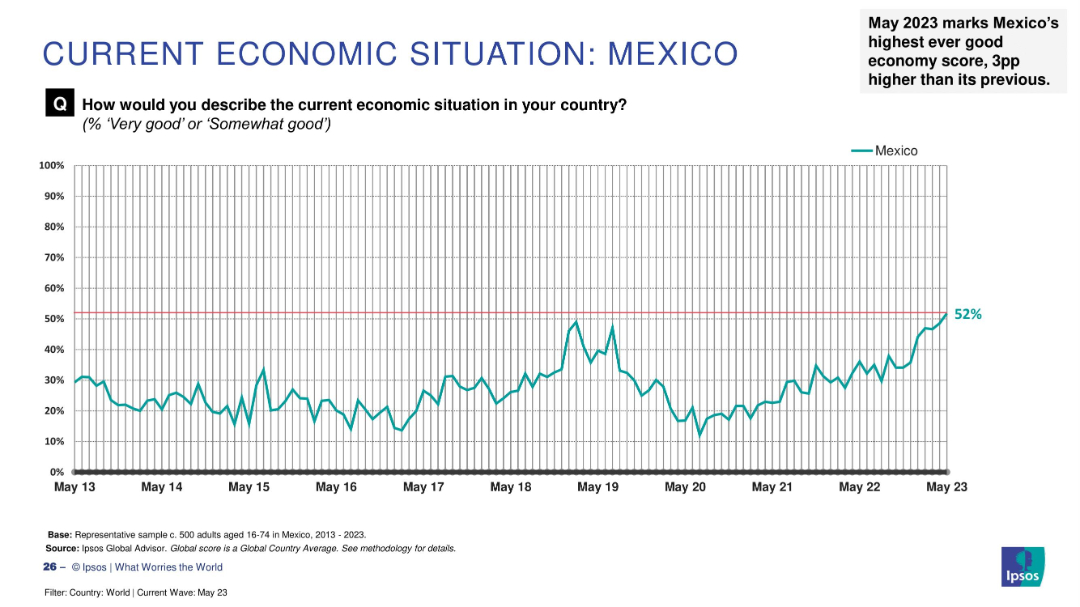
Line graph displaying Mexico’s economic perception (2013–2023); right-hand annotation notes milestone.
Strategic Planning
Financial Services
Mexico’s “good economy” sentiment reached a historic high of 52% in May 2023, up 3 percentage points from the previous month. The trend line shows steady improvement over time, reflecting increased confidence and stability in economic perception.
Mexico, economy, record high, public confidence, Ipsos, economic trend, growth, financial perception, optimism
Single Chart
IPSOS
Saved
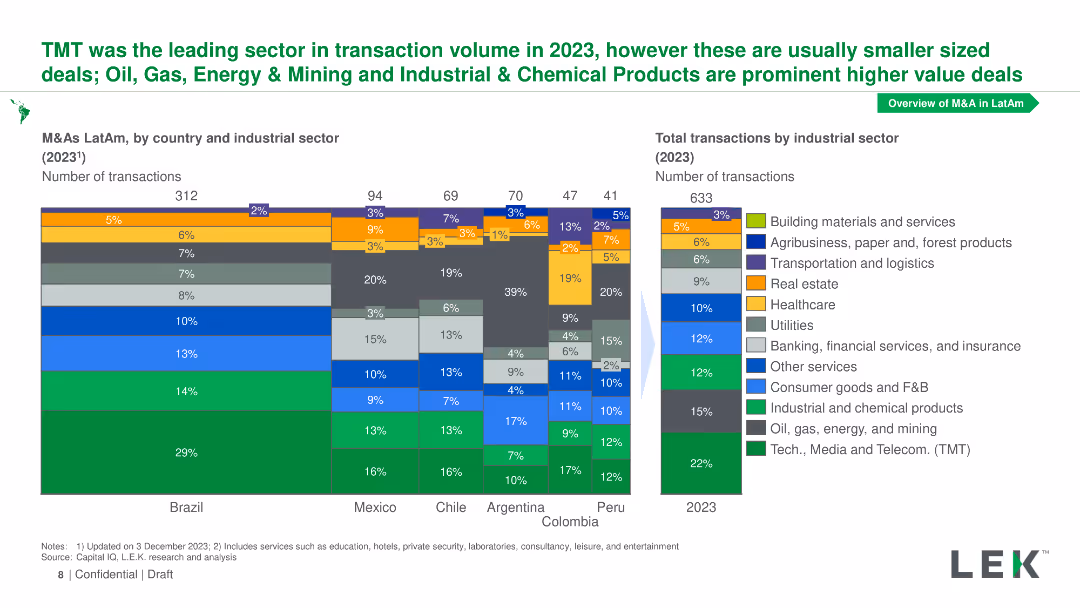
Stacked bar chart showing M&As by industrial sector for several Latin American countries in 2023, with a breakdown of sectors per country and total transactions.
Market Analysis and Trends
Financial Services
Shows M&A transaction volumes by industrial sector for Brazil, Mexico, Chile, Argentina, Peru, and Colombia, highlighting TMT as the leading sector in 2023.
M&As, industrial sector, Latin America, TMT, transaction volumes
Multiple Chart
LEK
Saved
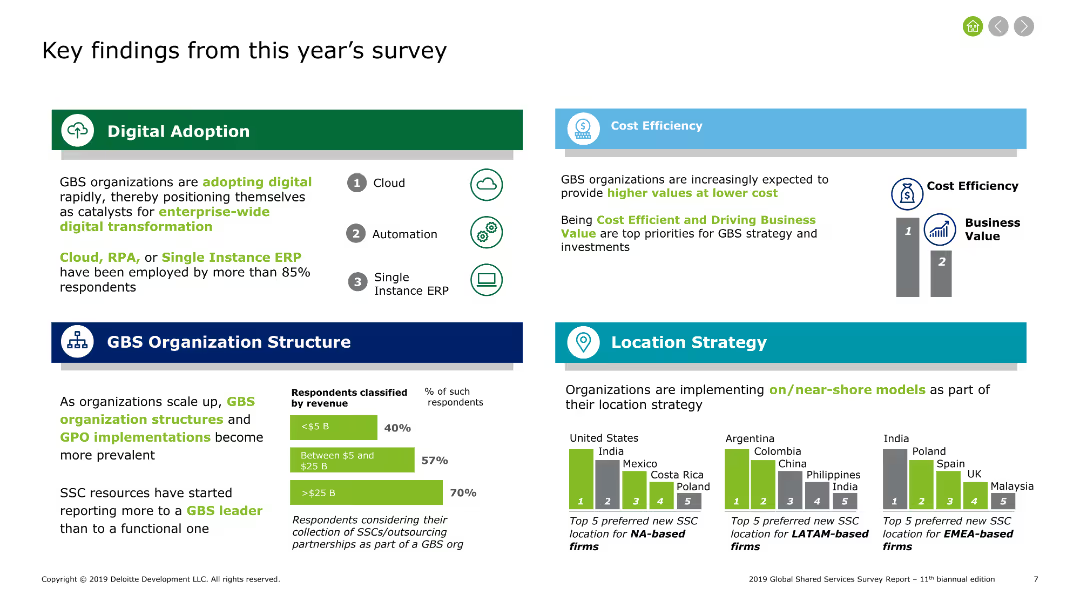
Multiple sections with text and charts outlining key findings from the survey on digital adoption, cost efficiency, organizational structure, and location strategy.
Market Analysis and Trends
Professional Services
Highlights key survey findings on digital adoption, cost efficiency, organizational changes, and location strategies, indicating significant trends and priorities in shared services.
digital adoption, cost efficiency, organization, strategy
Multiple Chart
Deloitte
Saved
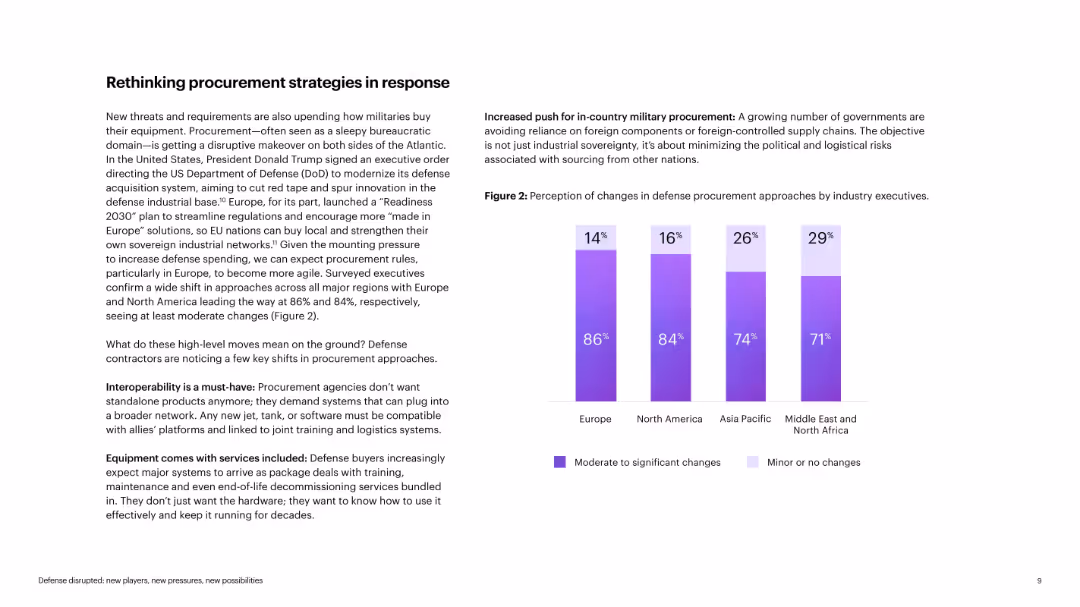
Text with bar chart showing perception of changes in procurement by region
Operational Efficiency
Government & Public Sector
The slide discusses evolving military procurement strategies, with emphasis on interoperability, bundled services, and local sourcing. The bar chart shows widespread recognition of changes across regions. Insights suggest that national security priorities are reshaping how defense contracts are structured and delivered.
procurement, defense, interoperability, local sourcing, military, strategy, contracting
Mixed Chart
Accenture
Saved
Column charts showing revenues, profit before tax, and various financial metrics for the investment bank segment.
Financial Performance
Financial Services
Illustrates the performance of the investment bank division, covering revenues, profit, and cost/income ratios.
Investment bank, revenues, profit, financial performance, UBS, 3Q22, cost/income ratio, derivatives and solutions
Multiple Chart
UBS
Saved
The slide is divided into three sections, each with bar graphs and comparative data matrices. The first section forecasts Australia's renewable energy targets; the second evaluates Australia against global ESG standards in mining; the third section discusses renewable energy as a percentage of total energy generation comparing Australia to the EU and US. Each part is clearly delineated and uses a consistent color scheme for easy comparison.
Competitive Landscape
Energy & Utilities
Highlights Australia's commitment to reaching high levels of renewable energy generation by 2030 and its strong ESG policies in mining, contrasting with other major economies and demonstrating its industry leadership.
renewable energy, ESG, mining, Australia, 2030 targets, energy generation, sustainability, global standards, industry leadership, policy strength
Mixed Chart
Accenture
Saved
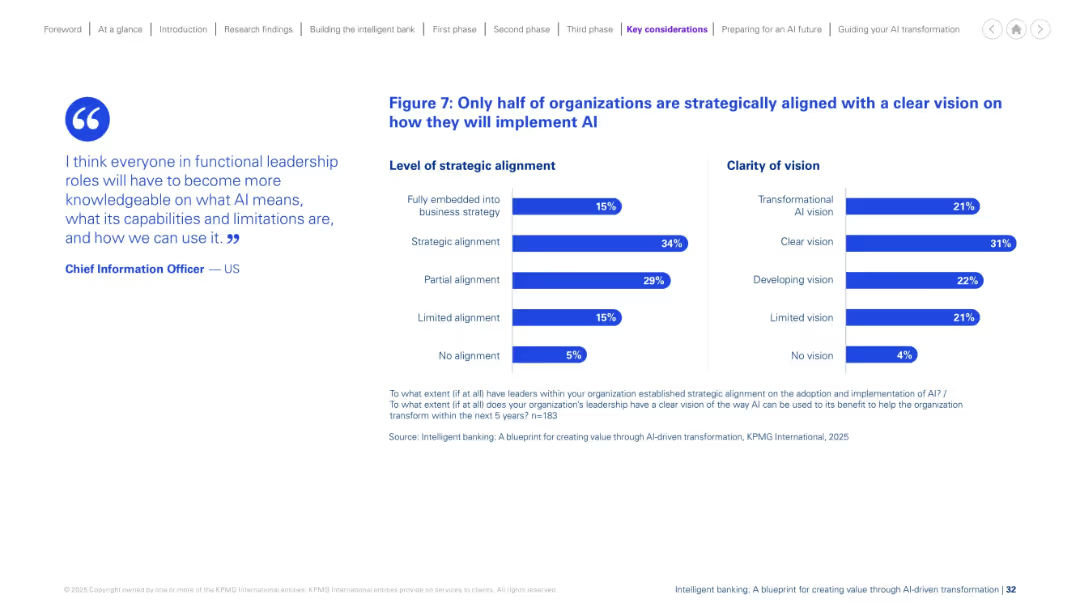
Split-layout slide with a quote on the left and two horizontal bar charts on the right, each showing survey percentages.
Strategic Planning
Financial Services
This slide presents findings on AI strategy alignment and vision clarity in organizations. Only 15% are fully embedded into strategy, and only 31% have a clear vision. It emphasizes gaps in strategic alignment and AI foresight.
AI implementation, strategic alignment, clarity, transformation, survey, statistics, business strategy, vision, leadership, organizational change
Mixed Chart
KPMG
Saved
Circular stacked pie chart showing the frequency of employee satisfaction measurements.
Strategic Planning
Professional Services
Details frequency of employee satisfaction assessments, aiding in operational planning and improvement in HR.
HR, frequency, employee satisfaction, assessment, operational planning
Single Chart
PwC/Strategy&
Saved
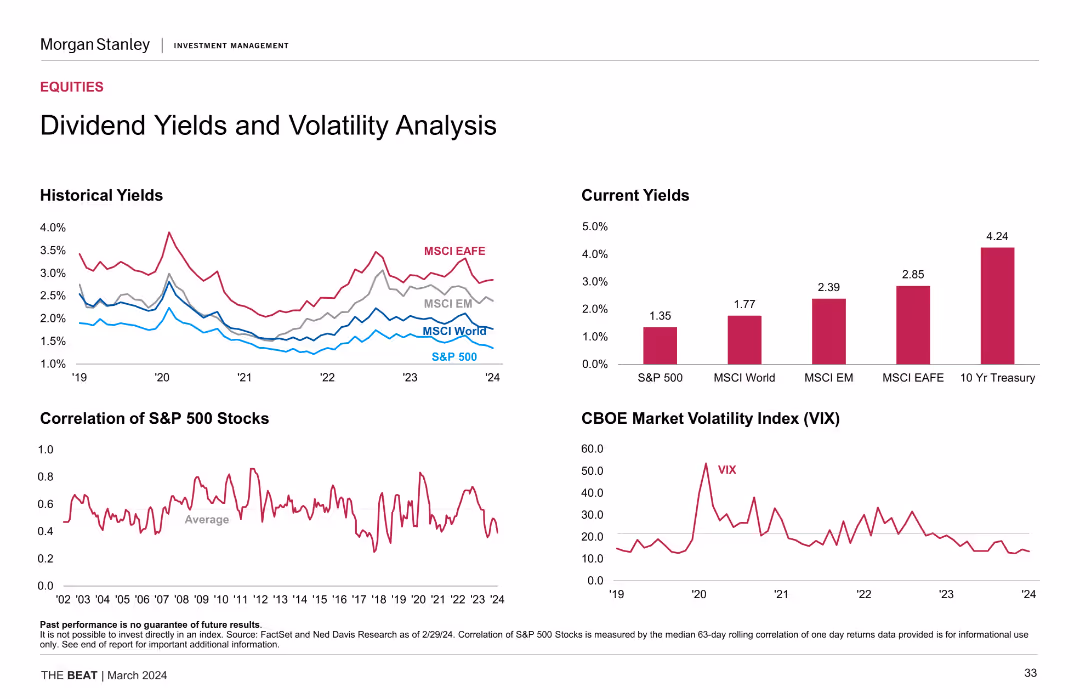
The slide includes line charts showing historical yields and the correlation of S&P 500 stocks, a bar chart of current yields, and a line chart of the CBOE Market Volatility Index (VIX).
Investment Analysis
Financial Services
The slide analyzes dividend yields and market volatility, providing historical and current data. Useful for understanding investment risks and returns.
dividend yields, volatility, S&P 500, correlation, MSCI, VIX, investment analysis
Multiple Chart
Morgan Stanley
Saved
Pie charts for loan segmentation, bar charts with credit comparison, textual content
Financial Performance
Financial Services
Overview of consumer loans, credit quality, and corporate lending in the U.S.
Loans, Credit, Corporate, Pie Chart, Bar Chart, Consumer, Financials
Multiple Chart
Citigroup
Saved
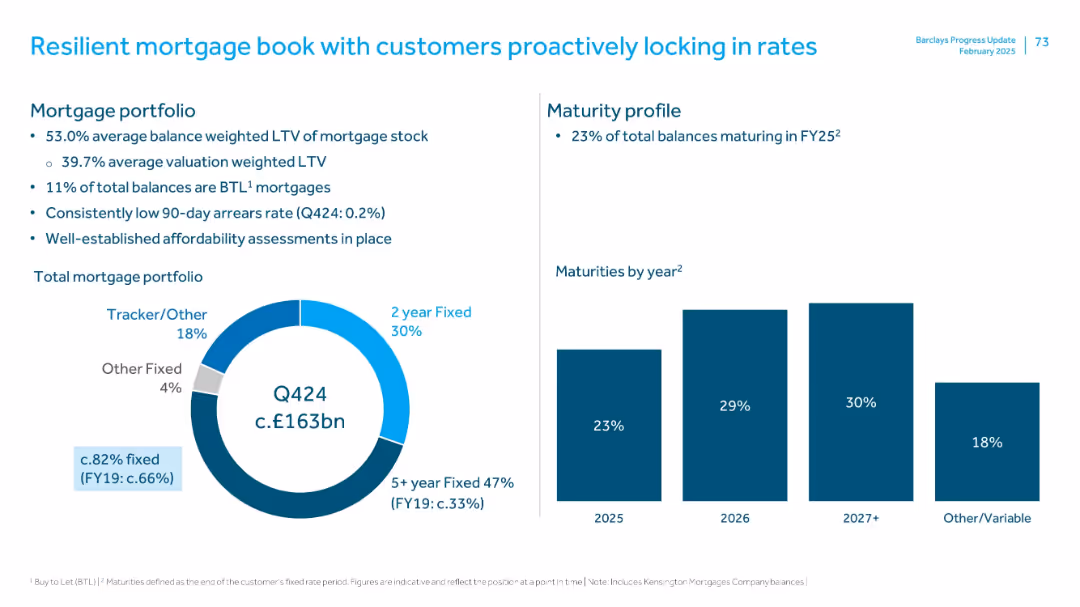
Left: donut chart of mortgage types; Right: bar chart of maturity profile; bulleted insights above; blue/white palette
Risk Assessment and Management
Financial Services
Highlights characteristics of Barclays’ mortgage portfolio, such as LTV, arrears rates, and type distribution. Shows that 82% of balances are fixed-rate, with a strong maturity profile and low default risk. Emphasis is on resilience and proactive customer behavior in securing fixed rates.
mortgages, LTV, arrears, fixed rate, portfolio maturity, residential lending
Multiple Chart
Barclays
Saved
Moderate complexity with four column charts comparing funding in key sectors, accompanied by a comprehensive text explanation on the right side.
Market Analysis and Trends
Financial Services
Evaluates funding trends in mature and consolidated sectors, indicating a slowdown, and offers a detailed analysis of unicorn and other investments.
Funding, mature sectors, consolidation, slowdown
Mixed Chart
Bain
Saved
Slide presents a column chart showing marketers' ratings on how climate-related changes influence customer experience, divided by business sectors.
Product and Service Analysis
Environmental Services & Sustainability
Evaluates marketers' beliefs regarding the impact of climate-related changes on customer experience, providing insights across different sectors.
climate change, customer experience, product changes, marketer opinions, sustainability
Mixed Chart
Deloitte
Saved
Line and column charts, clean and effective use of space, predominantly uses teal color.
Customer and Market Segmentation
Telecommunications
Discusses how sentiment analysis from unstructured data can influence customer service strategies.
sentiment analysis, data, customer service, strategy
Multiple Chart
Deloitte
Saved
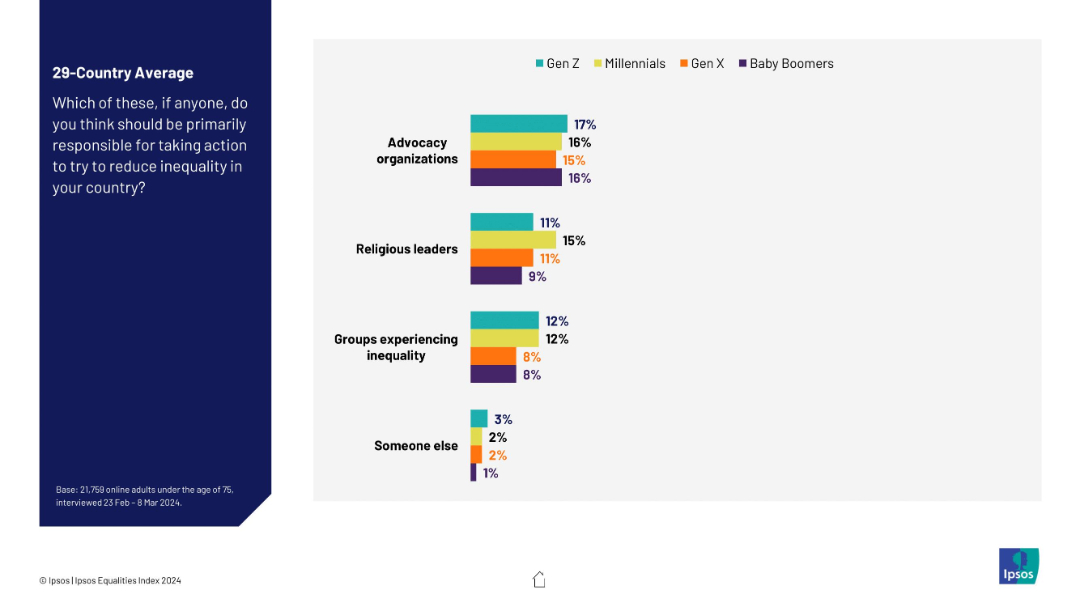
Continuation of 19345 with less commonly chosen actors (advocacy, religious leaders, etc.), horizontal grouped bar chart. Consistent design.
Strategic Planning
Government & Public Sector
This slide expands on slide 19345 by showing lesser-chosen actors for inequality reduction. Advocacy organizations and religious leaders receive moderate to low attribution, while “someone else” and “groups experiencing inequality” score lowest. Generational variance is moderate.
public opinion, minority voices, responsibility, inequality, Ipsos, generational divide, advocacy, religion
Mixed Chart
IPSOS
Saved
Previous
Next
If nothing, comes up, please save your slides first
Create a FREE account to continue browsing
Receive Instant Access to 1,000+ slides from companies like McKinsey, Google, and Goldman Sachs
First Name
Last Name
Email
Password
I agree to all
Terms & Privacy Policy
Thank you! Your submission has been received!
Oops! Something went wrong while submitting the form.
Have an account?
Sign in
Column Chart
Heatmap
Chevron
Org Chart
Infographic
Callouts
Timeline
List
Graphic
Picture
Process Flow
Diagram
Paragraph
Map
Table
Framework
Subtitle
Takeaway Box
Icon
Other Chart
Radar Chart
Waterfall Chart
Mekko Chart
Pie Chart
Scatter Plot
Line Chart
Bar chart
Bullet points