My Account
My Slides
Search by Category
Templates
Leave Feedback
Login
Logout
Get Started
Browse all Slides
Browse all Slides
Create a FREE Account
Instant access to 1,000+ real slides from top companies like McKinsey, BCG, Goldman Sachs, Google and many more!
First Name
Last Name
Email
Password
I agree to all
Terms & Privacy Policy
Thank you! Your submission has been received!
Oops! Something went wrong while submitting the form.
Have an account?
Sign in
Saved Slides
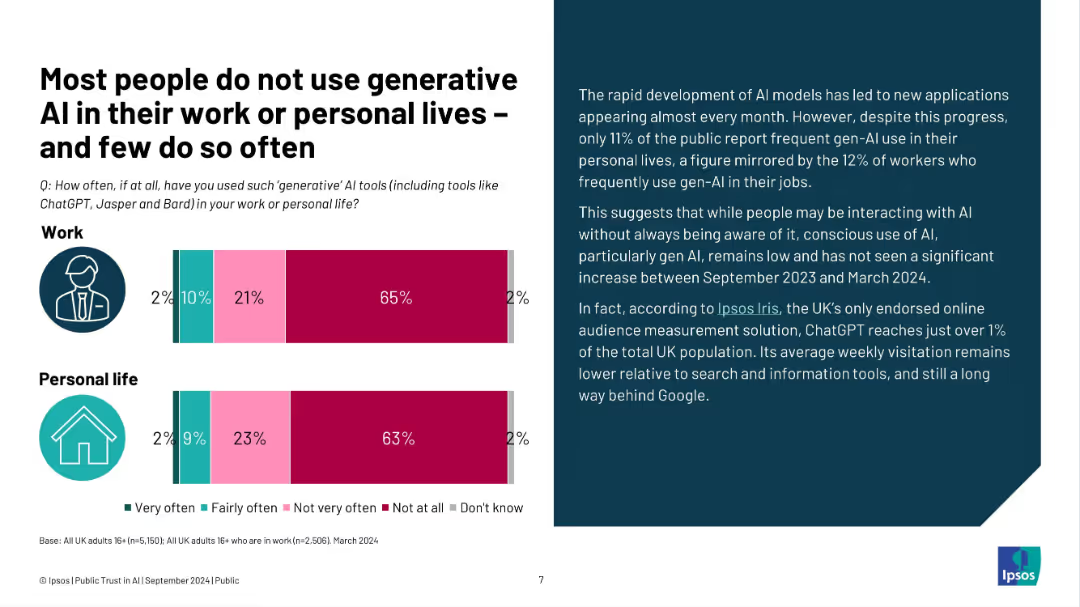
Left: title and bar charts on AI usage at work and personal life; right: paragraph analysis of gen-AI usage
Technology and Digital Transformation
Artificial Intelligence
Generative AI tools like ChatGPT are infrequently used by the public, both in professional and personal contexts. Despite tech advances, only 11–12% use these tools often. Public engagement with gen-AI remains relatively stagnant from late 2023 to early 2024.
generative AI, usage, personal, professional, ChatGPT, Ipsos, UK, digital transformation, trends
Mixed Chart
IPSOS
Saved
Primarily text-based with minimalistic icons and checkmarks to denote key points, arranged in a clear, easy-to-follow format.
Strategic Planning
Financial Services
Details future strategies for product innovation, with a forward-looking perspective. Suitable for strategic forecasting and planning meetings.
product innovation, strategy, growth, ROE, customer experience
Table
JP Morgan
Saved
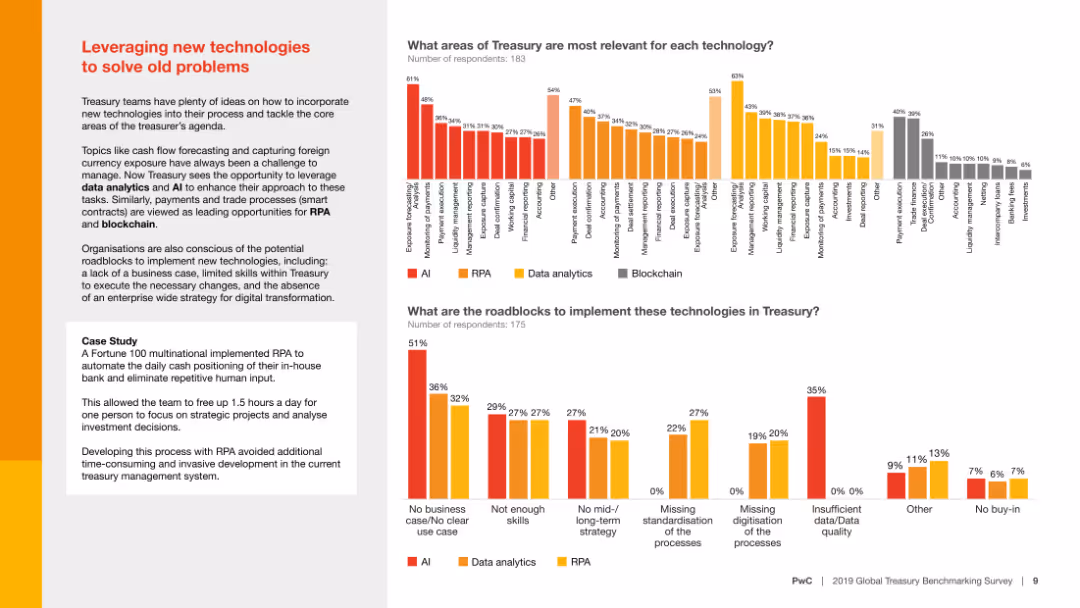
Column charts comparing areas of treasury relevance and roadblocks for implementing technologies like AI, RPA, and data analytics, with a case study example included.
Technology and Digital Transformation
Financial Services
The slide analyzes how new technologies can solve traditional treasury problems, highlighting the relevance of different technologies and potential implementation roadblocks.
New technologies, treasury, AI, RPA, data analytics
Multiple Chart
PwC/Strategy&
Saved
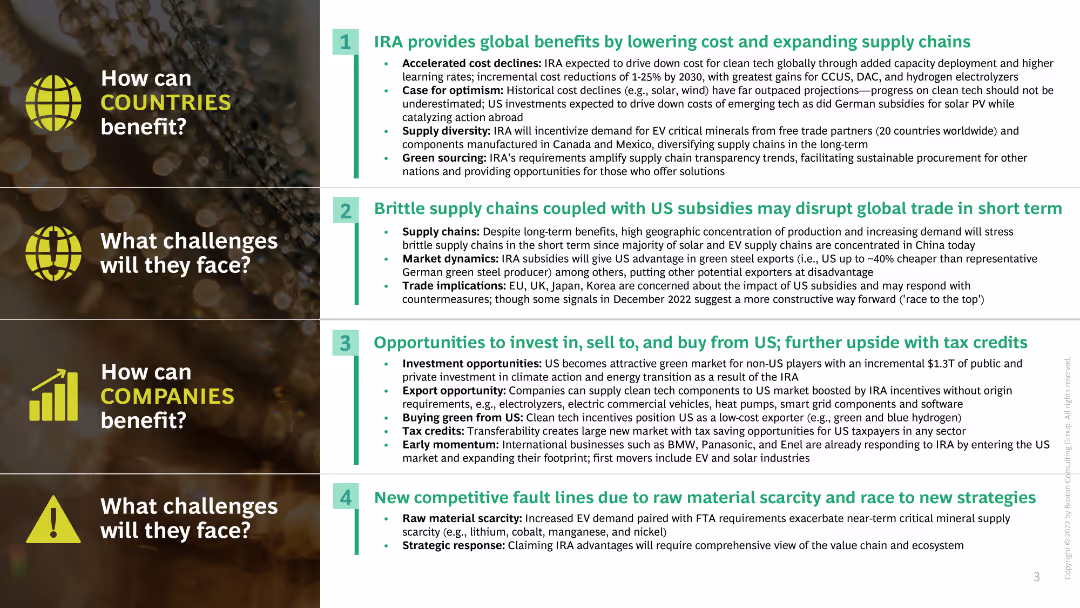
The slide uses a two-column layout with text and numbered lists detailing benefits and challenges for countries and companies.
Strategic Planning
Energy & Utilities
The slide discusses the global benefits of the Inflation Reduction Act (IRA) and potential challenges for countries and companies.
IRA, global benefits, challenges, countries, companies
Header Vertical
BCG
Saved
A column chart compares actions taken by CEOs most impacted by supply chain disruptions versus all CEOs. Commentary and statistics are provided on the right.
Strategic Planning
Transportation & Logistics
The slide focuses on the specific actions taken by CEOs who feel most impacted by supply chain disruptions, such as diversifying the value chain and conducting vulnerability assessments.
CEO actions, supply chain, disruptions, resilience, strategic planning
Mixed Chart
Accenture
Saved
Displays a column chart indicating the median CO2 capture capacities of projects (in Mtpa) by region and status (in development, operational, completed, cancelled).
Strategic Planning
Energy & Utilities
Projects significant growth in the size of CCUS projects globally. Provides insights into the future capacities and development of various regions' CCUS initiatives.
CCUS, project size, growth, future development, CO2 capture, regional analysis, strategic planning, trends
Mixed Chart
Kearney
Saved
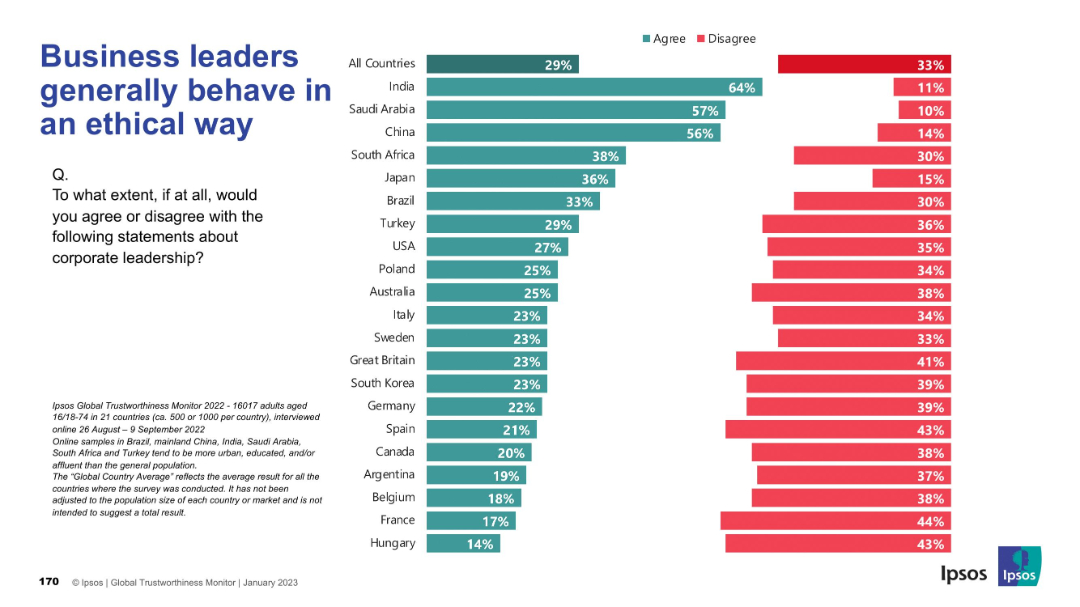
Familiar bar chart layout with agree/disagree metrics; countries displayed along the vertical axis; standard visual structure and color-coding.
Risk Assessment and Management
Professional Services
This slide examines global trust in business leaders’ ethics. India stands out positively while Western countries show skepticism, revealing a divide in corporate reputation and ethical perceptions.
ethics, corporate behavior, trust, leadership perception, global disparity, Ipsos, morality
Mixed Chart
IPSOS
Saved
The slide is divided into sections detailing objectives, policy change propositions, and focuses on the European Union. Includes a map and objectives for decarbonizing various sectors.
Regulatory and Compliance
Government & Public Sector
Discusses the HyLaw initiative launched by Hydrogen Europe to identify and address legal barriers to hydrogen deployment, focusing on policy changes and integration in the EU.
Hydrogen Europe, HyLaw, legal barriers, policy changes, EU, decarbonization, integration, objectives
Table
Kearney
Saved
A content slide summarizing research methodology and demographics. Includes a map showing the distribution of respondents by region and a bar chart showing the industry and revenue breakdown of the sample.
Market Analysis and Trends
Professional Services
This slide provides an overview of the research conducted, including survey demographics, regional distribution, and industry and revenue breakdown of the participants.
research, demographics, industry breakdown, revenue, survey
Mixed Chart
Accenture
Saved
Column charts and tables are used to display IPO numbers and proceeds for Mainland China and Hong Kong stock exchanges.
Market Analysis and Trends
Financial Services
The slide highlights key IPO market data for Mainland China and Hong Kong, including sector breakdowns and changes from 2021 to 2022.
Mainland China, Hong Kong, IPOs, stock exchanges, sectors
Multiple Chart
EY
Saved
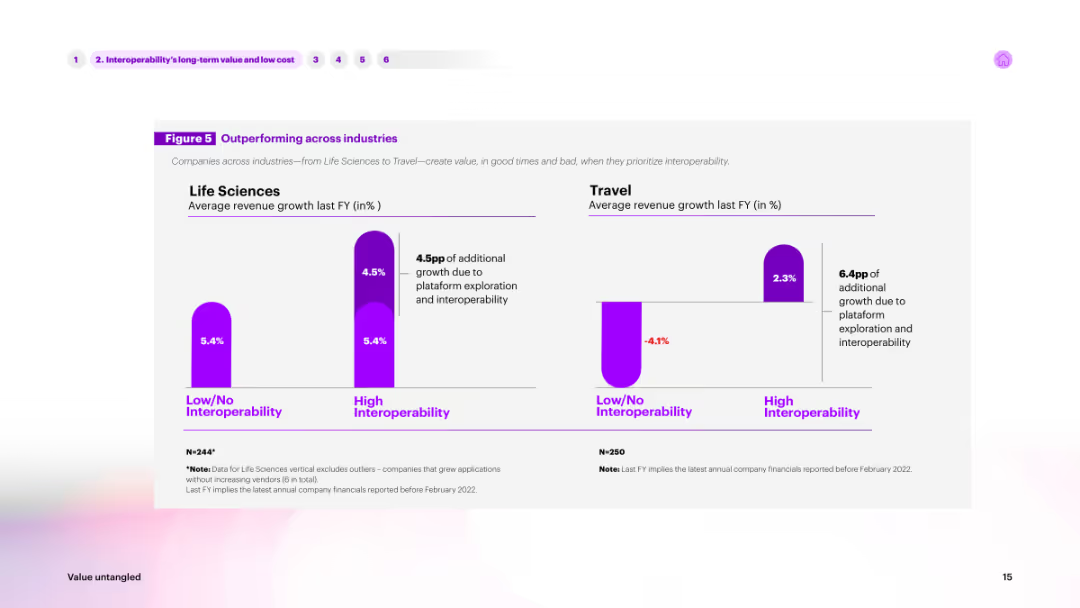
The slide features a column chart comparing average revenue growth across industries (Life Sciences, Travel) based on interoperability. High interoperability is shown in purple, while low/no interoperability is shown in a lighter shade.
Market Analysis and Trends
Technology & Software
Highlights how interoperability impacts revenue growth in different industries. The chart compares life sciences and travel sectors, showing significant growth advantages for companies with high interoperability.
interoperability, industry comparison, revenue, growth, life sciences
Multiple Chart
Accenture
Saved
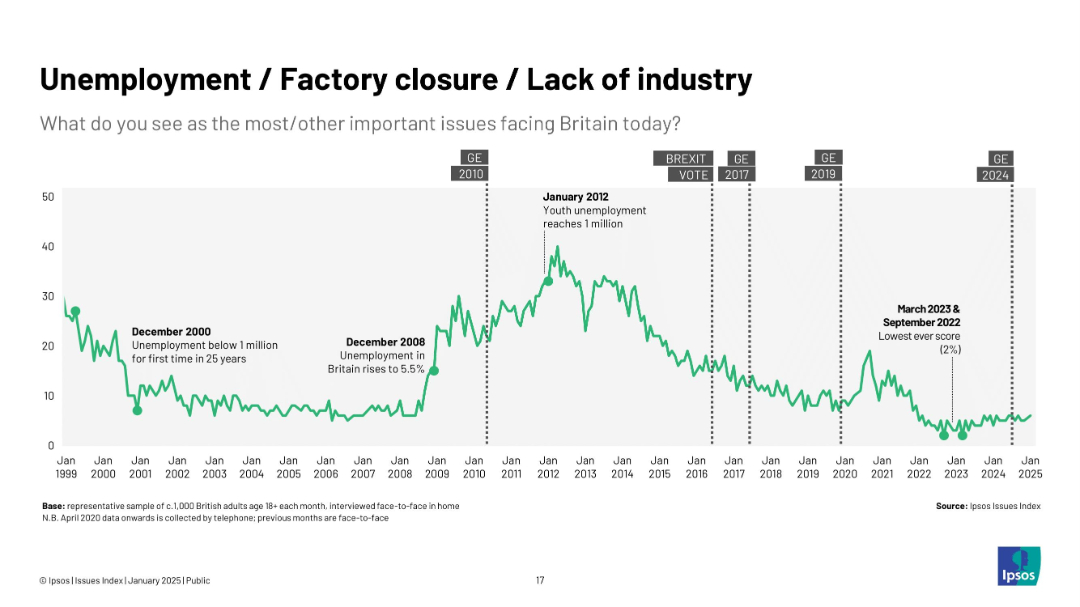
Line graph from 1999–2025, major events like Dec 2008 crisis and Jan 2012 unemployment peak noted; green line on white background.
Performance Metrics and KPIs
Industrial & Manufacturing
Displays public concern over employment and industry issues, showing high concern post-2008 crisis and steep declines by 2023.
unemployment, industry, job loss, UK economy, factory closures, Ipsos, trends
Single Chart
IPSOS
Saved
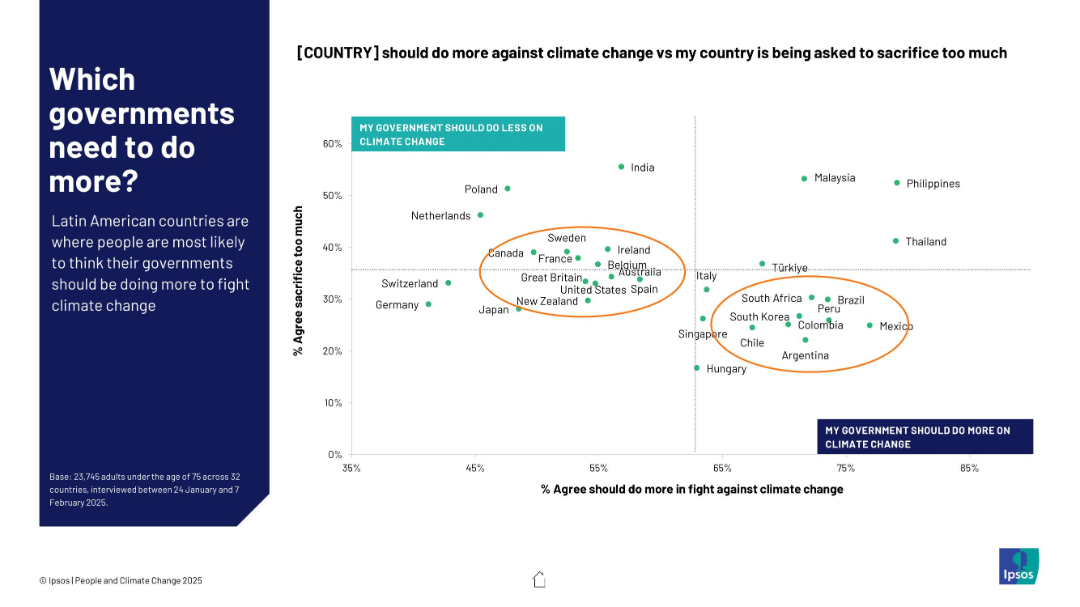
Scatterplot chart on right side shows correlation between views on government action and public sacrifice; annotated orange ellipses highlight country clusters
Regulatory and Compliance
Government & Public Sector
This slide examines the balance between public sentiment on whether their governments should do more on climate change vs. perceptions of national sacrifice. Latin American nations cluster around high dissatisfaction with government efforts.
government action, climate policy, perception, Latin America, scatterplot, Ipsos, responsibility, climate sacrifice, public opinion
Mixed Chart
IPSOS
Saved
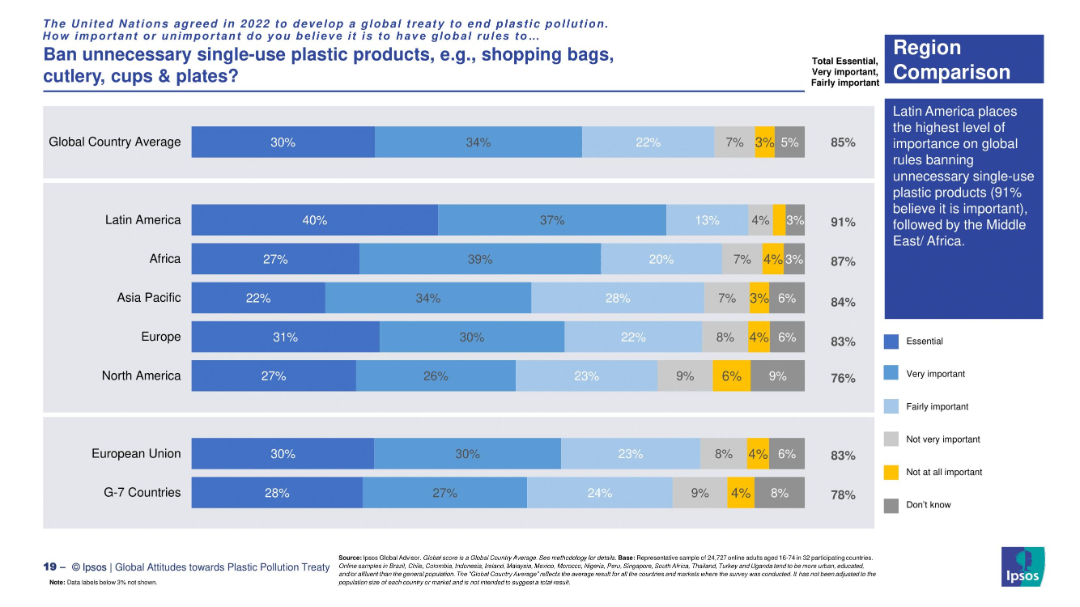
Horizontal bar chart showing regional support levels. Five-segment bars and right-hand insight box summarize the overall trend.
Regulatory and Compliance
Environmental Services & Sustainability
This slide shows strong regional backing for banning unnecessary single-use plastics, especially in Latin America and Africa. It reflects a shared priority in advancing environmental sustainability through global regulation.
sustainability, plastic ban, global agreement, regional data, Latin America, Ipsos study
Mixed Chart
IPSOS
Saved
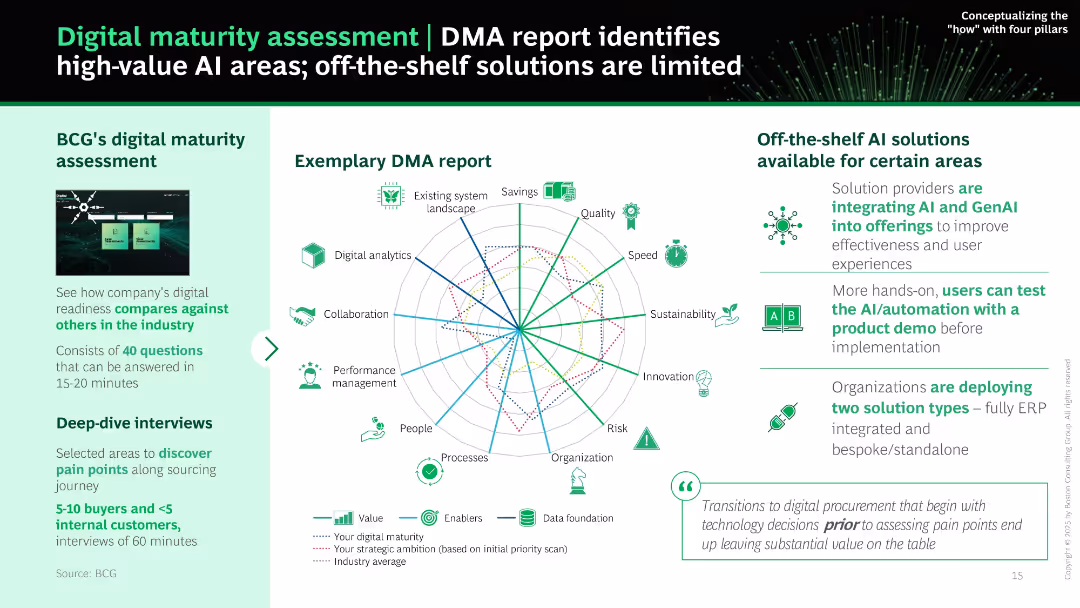
Radar chart at center with multiple axes and legend. Sidebars explain DMA assessment approach and available solutions. Balanced layout using green color palette.
Performance Metrics and KPIs
Technology & Software
Explains how BCG’s DMA report benchmarks an organization's digital maturity across procurement functions. Visual radar chart compares maturity with ambition and industry averages. Also discusses off-the-shelf AI tools and implementation insights.
digital maturity, DMA, assessment, AI, analytics, sourcing, procurement, benchmarking
Mixed Chart
BCG
Saved
A slide with two segments; the left side shows a circular diagram with sectors centered around client centricity, and the right side includes a descriptive statement on a black background.
Client Case Studies
Financial Services
This slide visually describes the integrated approach of the organization in serving global clients, emphasizing client centrality.
Integration, Client, Centricity, Global, Financial, Services, Organization, Approach
Diagram
Goldman Sachs
Saved
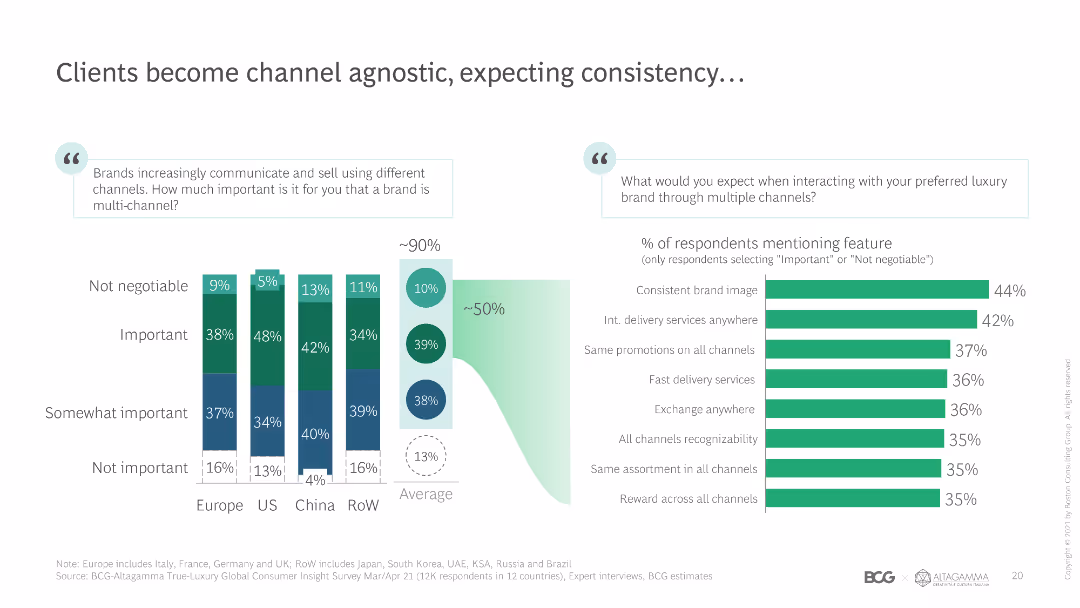
Stacked bar chart showing the importance of multi-channel communication for luxury brands across different regions, and the expected features from luxury brands.
Customer and Market Segmentation
Retail & E-commerce
Highlights the importance of multi-channel strategies for luxury brands, showing regional preferences and the top features expected by luxury consumers.
multi-channel, luxury brands, customer expectations, regional preferences, consistency
Multiple Chart
BCG
Saved
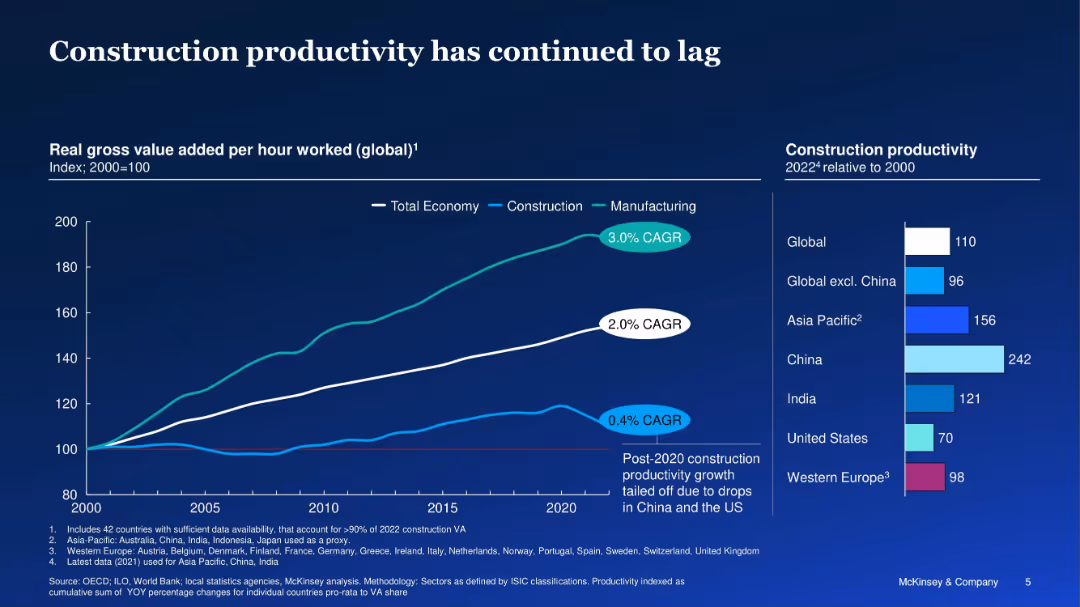
Line graph with three sectors (total economy, manufacturing, construction) and regional bars
Performance Metrics and KPIs
Real Estate & Construction
The slide compares global productivity trends from 2000–2022, showing construction lagging behind the total economy and manufacturing. Regional breakdowns show varying productivity levels, with China far ahead and the US lagging.
productivity, construction, manufacturing, economy, regional comparison
Multiple Chart
McKinsey
Saved
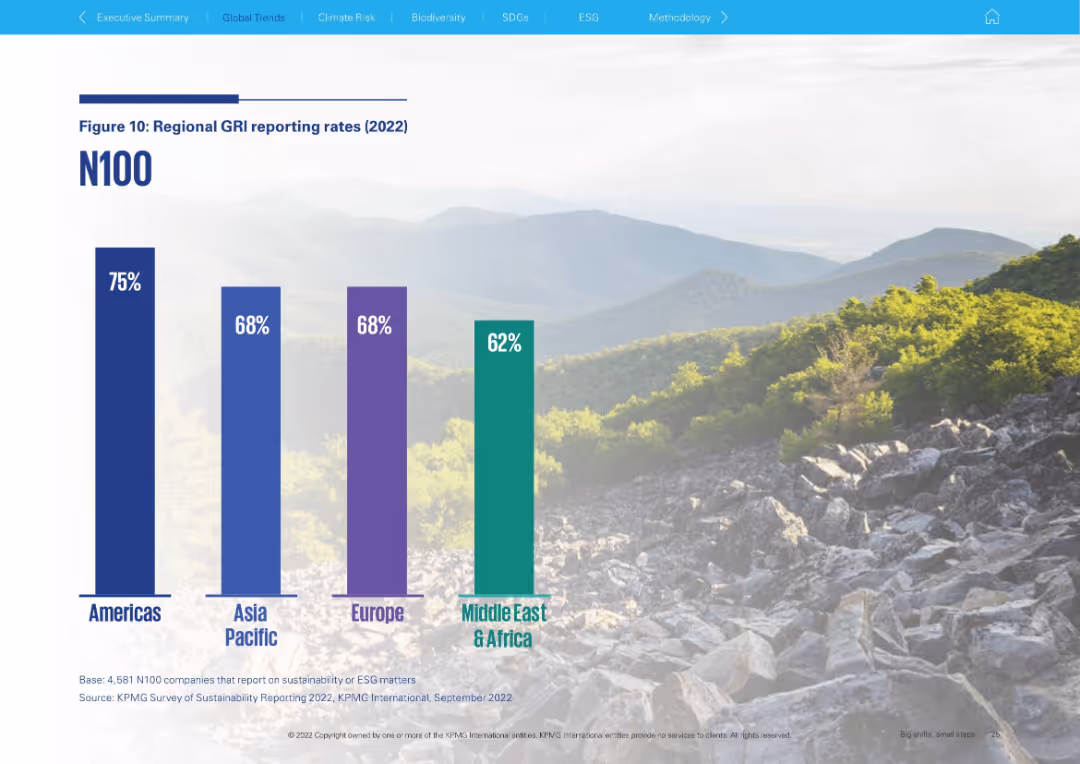
Large vertical bar chart against scenic mountain background; clean layout
Regulatory and Compliance
Professional Services
Depicts the 2022 regional breakdown of GRI reporting rates among N100 companies. The Americas lead at 75%, followed by Asia Pacific and Europe (68%), and Middle East & Africa (62%).
GRI, regional reporting, ESG, Americas, Asia Pacific, Europe, Middle East, benchmarking
Single Chart
KPMG
Saved
Contains pie and column charts detailing liquidity coverage and net stable funding ratios, with qualitative key highlights.
Financial Performance
Financial Services
Reviews the bank's liquidity and funding status, highlighting improvements and strategies to maintain robust financial health.
liquidity, funding, finance, LCR, NSFR, stability
Multiple Chart
Deutsche Bank
Saved
Slide includes three stacked column charts for Île-de-France, Auvergne-Rhône-Alpes, and Hauts-de-France with green, gray, and red color coding representing satisfaction levels from 2022 to 2023.
Market Analysis and Trends
Government & Public Sector
Evaluates satisfaction levels with policies to attract foreign investment across three French regions, highlighting improvements or declines.
satisfaction, policies, foreign investment, Île-de-France, Auvergne-Rhône-Alpes, Hauts-de-France, 2022, 2023, regional development
Multiple Chart
Bain
Saved
Column charts illustrating investment categories over years and a graphical representation of risk management capabilities.
Risk Assessment and Management
Financial Services
This slide highlights advanced risk management capabilities and delivery approach, with strategic investments and technology platforms.
Risk management, technology platform, investment categories, strategic investments, delivery approach
Multiple Chart
Credit Suisse
Saved
The slide features a column chart comparing U/HNW wealth pool growth between APAC and the rest of the world. Additional metrics show the significant share of client wallet held by top firms in the region, with supporting bullet points on key trends.
Market Analysis and Trends
Financial Services
The slide projects substantial wealth growth in Asia, with top firms capturing a large share of client wallets. It highlights the trends driving this growth, including the rise of first and second-generation entrepreneurs and the increasing management of wealth pools by top players.
Asia, wealth growth, client wallet, top players, market trends
Multiple Chart
Credit Suisse
Saved
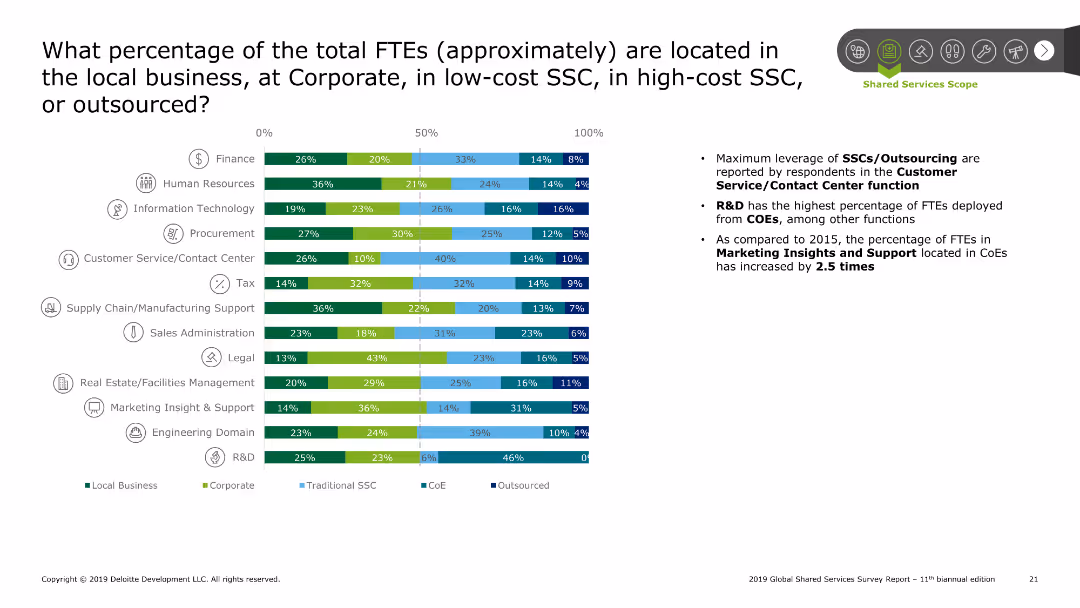
Bar chart showing the percentage of FTEs located across different settings (local, corporate, SSC, CoE, outsourced) for various functions. Summary points on the right discuss trends and findings.
Performance Metrics and KPIs
Professional Services
The slide analyzes the percentage of FTEs distributed across local business, corporate, SSCs, and outsourcing. The bar chart breaks down this data by function, highlighting significant leverage of SSCs/outsourcing in customer service and R&D. Summary points discuss the increase in FTEs located in CoEs compared to 2015.
SSC, FTE location, corporate, local, outsourcing
Mixed Chart
Deloitte
Saved
Slide features a pie chart showing the distribution of digital marketing budget among paid, owned, and earned media, set against a digital-themed background.
Market Analysis and Trends
Professional Services
Discusses allocation of marketing budget across different types of digital media, highlighting the dominance of paid media in digital marketing strategies.
digital marketing, paid media, budget allocation, marketing strategies, pie chart
Single Chart
Deloitte
Saved
Previous
Next
If nothing, comes up, please save your slides first
Create a FREE account to continue browsing
Receive Instant Access to 1,000+ slides from companies like McKinsey, Google, and Goldman Sachs
First Name
Last Name
Email
Password
I agree to all
Terms & Privacy Policy
Thank you! Your submission has been received!
Oops! Something went wrong while submitting the form.
Have an account?
Sign in
Column Chart
Heatmap
Chevron
Org Chart
Infographic
Callouts
Timeline
List
Graphic
Picture
Process Flow
Diagram
Paragraph
Map
Table
Framework
Subtitle
Takeaway Box
Icon
Other Chart
Radar Chart
Waterfall Chart
Mekko Chart
Pie Chart
Scatter Plot
Line Chart
Bar chart
Bullet points