My Account
My Slides
Search by Category
Templates
Leave Feedback
Login
Logout
Get Started
Browse all Slides
Browse all Slides
Create a FREE Account
Instant access to 1,000+ real slides from top companies like McKinsey, BCG, Goldman Sachs, Google and many more!
First Name
Last Name
Email
Password
I agree to all
Terms & Privacy Policy
Thank you! Your submission has been received!
Oops! Something went wrong while submitting the form.
Have an account?
Sign in
Saved Slides
Features images of digital platforms and logos of main partners. A clean, professional layout showcases the integration of services and key statistics highlighting the scale of the marketplace.
Industry Overview
Financial Services
Introduces the eCred platform, illustrating its role in connecting banks and fintechs with users. Highlights the significant membership base and key partners involved.
eCred, fintech, banking
Linear Flow
Barclays
Saved
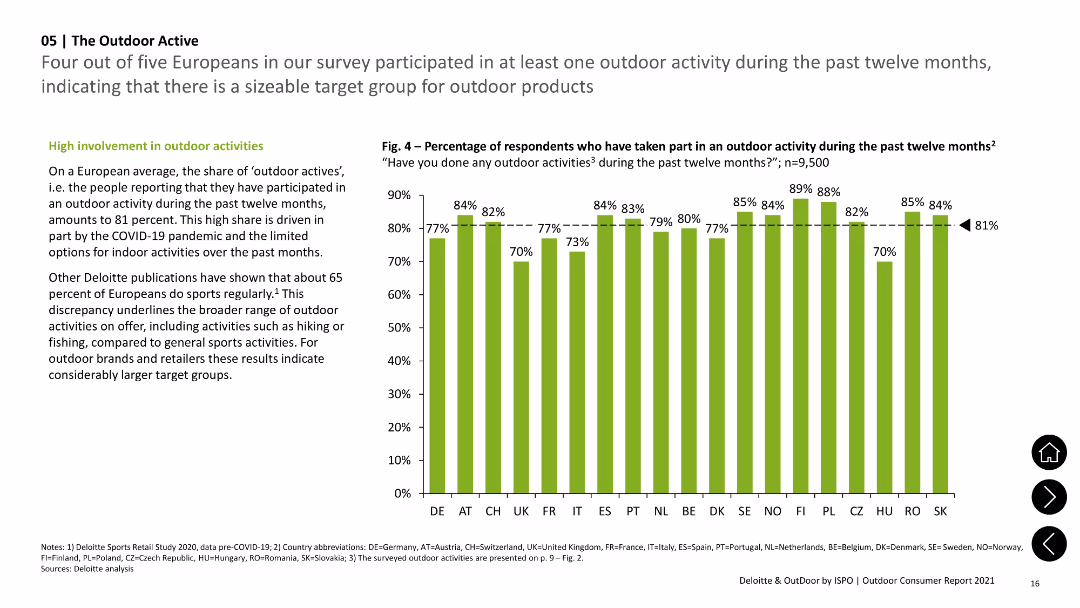
Features a column chart showing percentages of outdoor activity participation across various European countries with text summarizing high involvement in these.
Market Analysis and Trends
Consumer Goods
Shows the percentage of Europeans participating in outdoor activities, emphasizing high involvement rates and variation among countries.
Outdoor, Activities, Europe, Participation, Survey
Mixed Chart
Deloitte
Saved
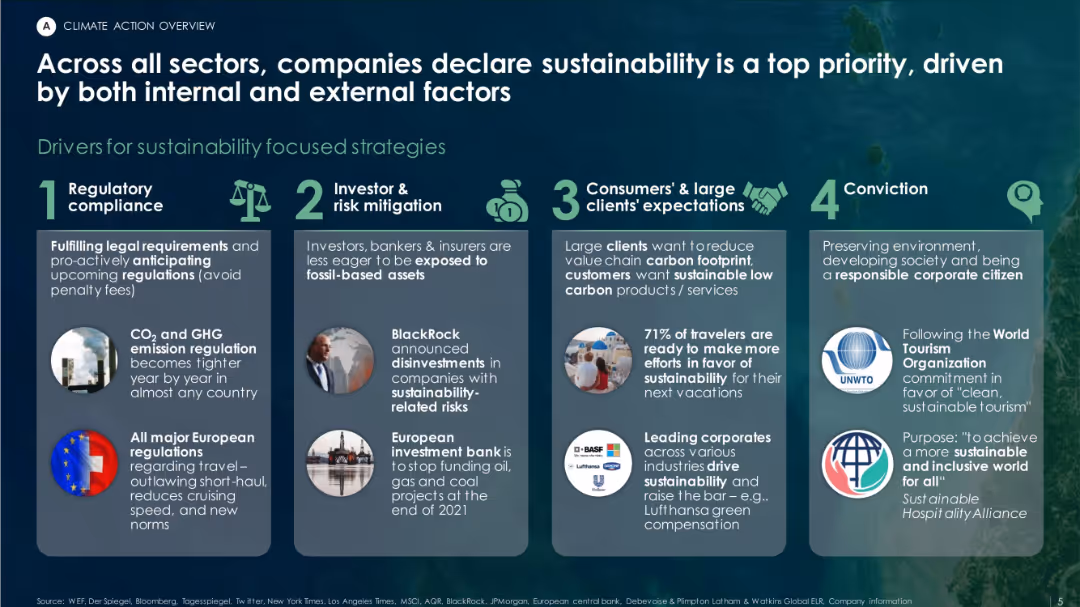
Structured as four numbered columns with icons and supporting text, highlighting the drivers of corporate sustainability strategies.
Strategic Planning
Environmental Services & Sustainability
This slide discusses the internal and external drivers pushing companies toward sustainability, such as regulatory compliance, investor pressure, consumer demand, and corporate values. Illustrative stats and company examples are also included.
sustainability, compliance, risk mitigation, ESG, regulations, consumer demand
Pillar
Roland Berger
Saved
Bar chart comparing top back-office use cases for retail and commercial banks.
Operational Efficiency
Financial Services
Shows top back-office use cases, with a focus on fraud detection, predictive analytics, and process optimization.
back-office, retail, commercial, banks, use cases
Multiple Chart
EY
Saved
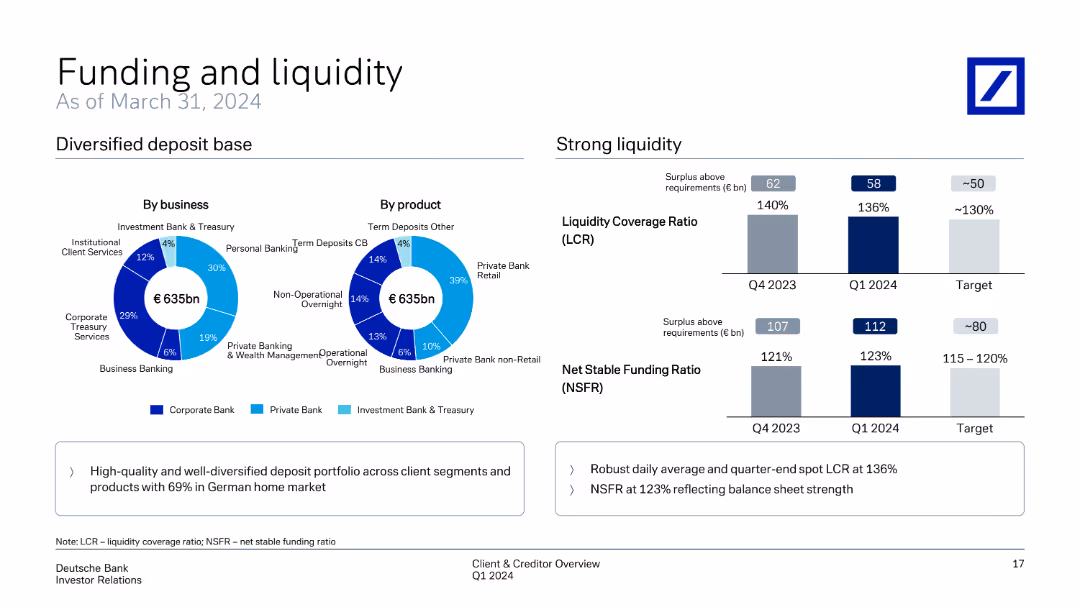
This slide includes multiple pie charts depicting the diversified deposit base by business and product. It also features column charts comparing liquidity coverage ratios and net stable funding ratios from Q4 2023 to Q1 2024.
Financial Performance
Financial Services
Focuses on the diversified deposit base and liquidity ratios, presenting the bank's funding and liquidity status as of March 31, 2024. It highlights the strength of liquidity coverage and stability in funding sources across different business segments.
funding, liquidity, deposit base, coverage ratio, stable funding
Multiple Chart
Deutsche Bank
Saved
Dominated by a series of bar charts contrasting comfort levels with visiting various public places in the near future. Colors vary from gray to purple.
Market Analysis and Trends
Retail & E-commerce
Illustrates the level of consumer comfort in visiting different types of public places, reflecting on the impact of current events on consumer confidence and predicting a slight future increase.
Consumer confidence, Public spaces, Comfort levels, Predictive analysis, Bar chart, Near future, Hospitality, Retail, Market research
Mixed Chart
Accenture
Saved
Slide with a column chart depicting underlying operating expenses for 4Q23, including annotations on specific expense categories.
Financial Performance
Financial Services
The slide outlines UBS's underlying operating expenses for 4Q23, showing a 1% increase quarter-on-quarter and detailing major expenses.
operating expenses, quarterly increase, expense categories, UBS cost management
Mixed Chart
UBS
Saved
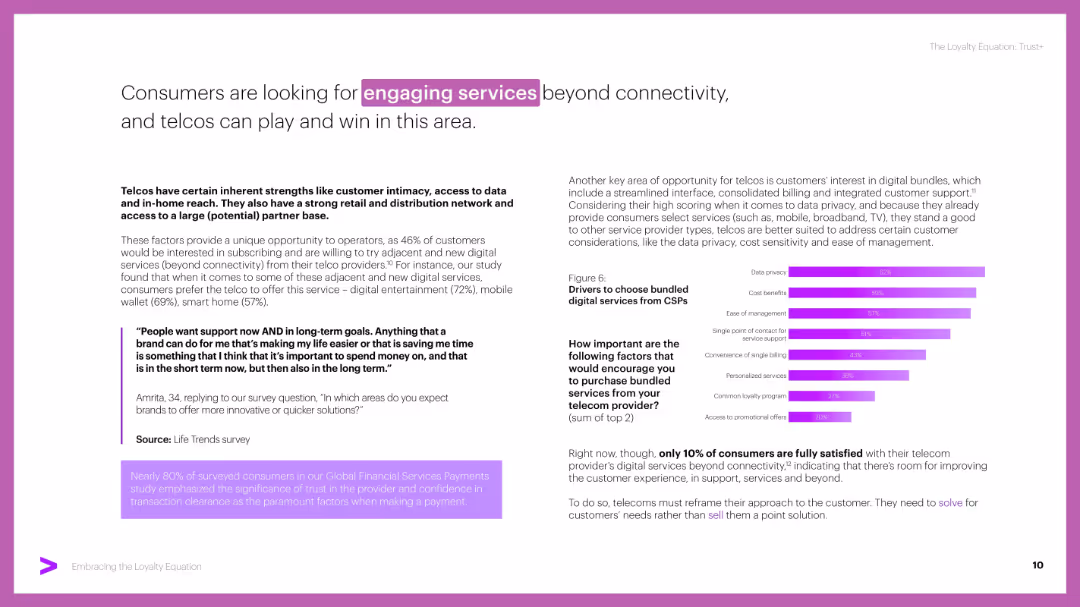
Two-column layout with bold headers, a quote in a purple box, and a horizontal bar chart on the right. Purple accent colors and highlighted keywords add emphasis.
Customer and Market Segmentation
Telecommunications
Highlights consumers’ demand for engaging services like digital entertainment, mobile wallets, and smart home devices. Emphasizes trust and bundled digital services as key drivers, with data from customer surveys and usage preferences.
digital services, CSPs, telco, bundling, trust, engagement, loyalty, privacy
Mixed Chart
Accenture
Saved
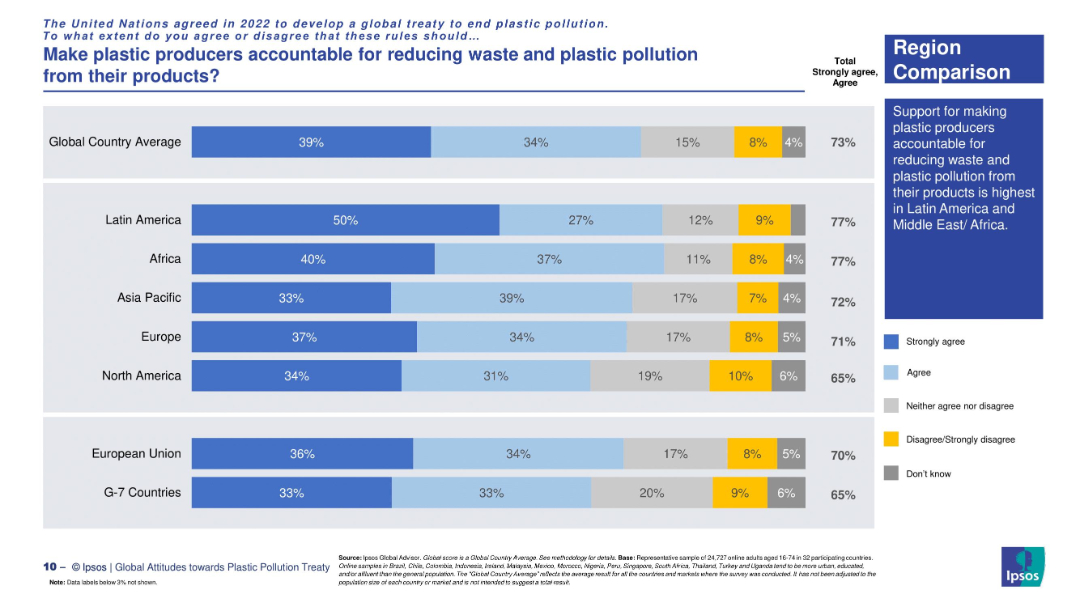
Regional horizontal stacked bar chart with consistent labeling and explanatory sidebar.
Regulatory and Compliance
Environmental Services & Sustainability
This slide aggregates regional support for producer accountability under a plastic treaty. Latin America and Africa show the highest support (77%), while North America and G7 countries lag behind.
global treaty, regional opinion, plastic regulation, corporate responsibility, Ipsos survey, accountability measures, environmental consensus
Mixed Chart
IPSOS
Saved
The slide features a column chart showing world bioenergy consumption by sector (energy, transport, industry, buildings) from 2018 to 2040 under a stated policies scenario. It includes detailed data on the growth of bioenergy use in power, heat, car, truck, shipping, aviation, industry, and residential sectors.
Market Analysis and Trends
Energy & Utilities
This slide projects the growth of world bioenergy consumption across various sectors until 2040, with a focus on the significant contributions from the power and transport sectors to the overall increase in bioenergy demand.
world bioenergy consumption, sector, 2018-2040, power, heat, transport, industry, buildings, growth forecast
Single Chart
Kearney
Saved
Features multiple charts depicting different governance models across a continuum of integration.
Strategic Planning
Professional Services
Highlights the impact of operational governance choices on organizational structure and financial management.
governance, structure, operational, integration, financial
Table
Deloitte
Saved
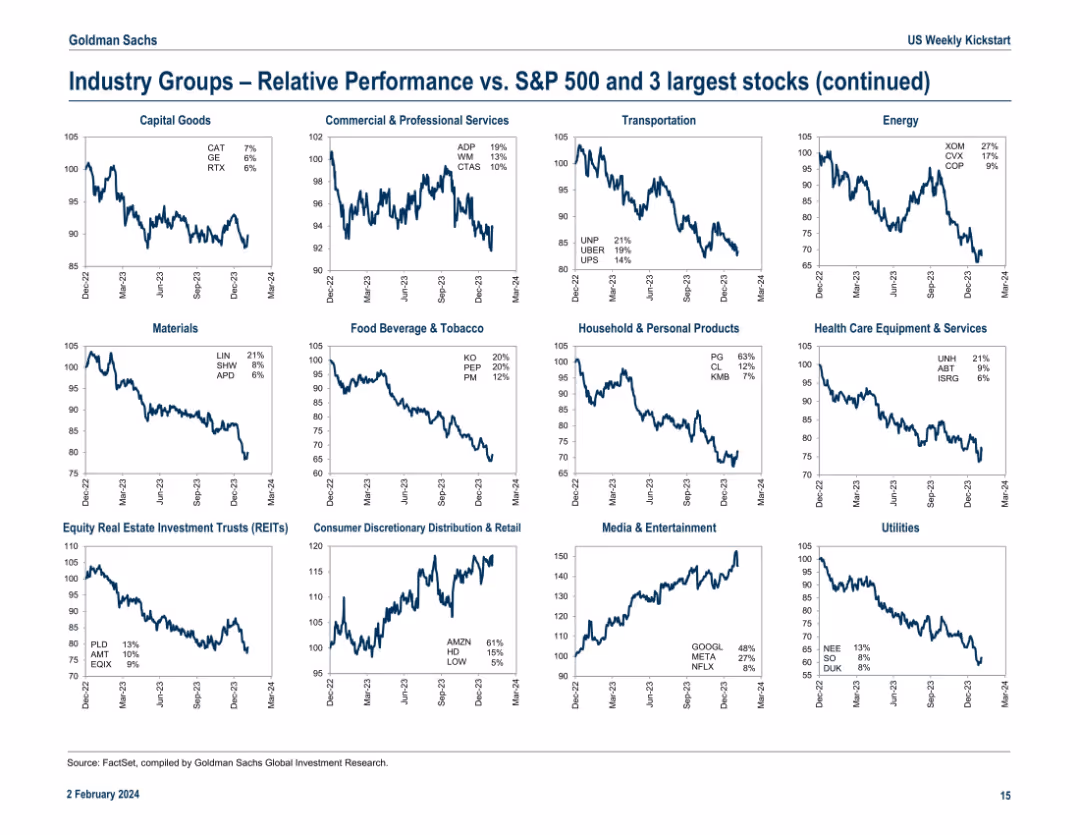
Continuation of the previous slide with another 16-panel grid layout of line charts. Includes industry groups like Transportation, Materials, Media, and Utilities. Each chart notes top 3 stocks in the group with YTD return.
Competitive Landscape
Financial Services
This continuation slide presents relative industry group performance vs. the S&P 500, focusing on sectors such as Transportation, Food & Tobacco, and REITs. Highlighted performers include UNP, KO, and META. The charts emphasize structural performance differences across industries and help detect winners and laggards among large-cap stocks.
REITs, META, UNP, KO, industry trends, relative performance, S&P 500, materials, transportation, utilities
Multiple Chart
Goldman Sachs
Saved
This slide visually maps out how employee needs evolve over time, with specific focus on various career stages. It uses a timeline format, complemented by icons representing different workforce segments. The layout includes side texts and a central illustrative panel that details the changing priorities and expectations of employees at each career phase.
Human Resources and Talent Management
Professional Services
Highlights the importance of recognizing the dynamic and diverse needs of employees throughout their careers, suggesting tailored approaches to DEI that address these varying requirements. It encourages companies to adopt flexible and inclusive strategies that acknowledge the unique challenges and aspirations of different employee groups.
DEI, career development, employee needs, workforce diversity, talent management, inclusive strategies
Linear Flow
BCG
Saved
This slide uses a content layout with a process flow diagram and a detailed table outlining reasons for IV-E ineligibility and related processes. The layout is moderately detailed with a balance of text and visual elements.
Financial Performance
Government & Public Sector
Slide features a flowchart of the fiscal specialist unit process and a table of reasons for IV-E ineligibility with solutions.
Details the fiscal process for identifying funding and overcoming ineligibility issues, providing a flowchart and a table with next steps to address common problems.
Linear Flow
Alvarez & Marsal
Saved
Features bar charts and bullet points for financial data.
Risk Assessment and Management
Financial Services
Provides detailed view of credit loss provisions annually and quarterly.
credit, losses, financial, risk
Multiple Chart
Deutsche Bank
Saved
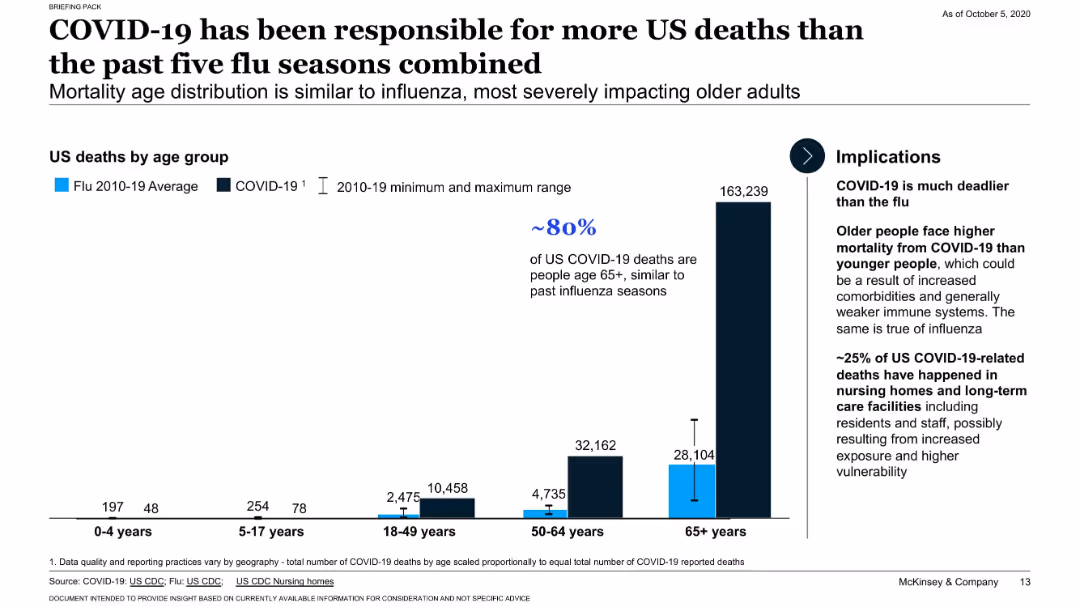
Vertical bar chart comparing flu vs. COVID-19 deaths by age group, side panel of implications and stats.
Risk Assessment and Management
Healthcare & Pharmaceuticals
Emphasizes the severe mortality of COVID-19, especially among those aged 65+, with ~80% of deaths in that group. Shows how COVID-19 compares to historical flu seasons. Notes effects on long-term care residents.
mortality, age groups, flu comparison, COVID-19, comorbidities
Mixed Chart
McKinsey
Saved
The slide features two column charts. The left chart shows European real estate transaction volumes in EUR billions from 1Q13 to 1Q24. The right chart breaks down transaction volumes by property type from 1Q07 to 4Q23.
Market Analysis and Trends
Real Estate & Construction
This slide provides an overview of European real estate transaction volumes over time and by property type, offering insights into the market's performance and investment distribution across different property sectors.
European real estate, transaction volumes, property types, market performance, investment trends
Multiple Chart
JP Morgan
Saved
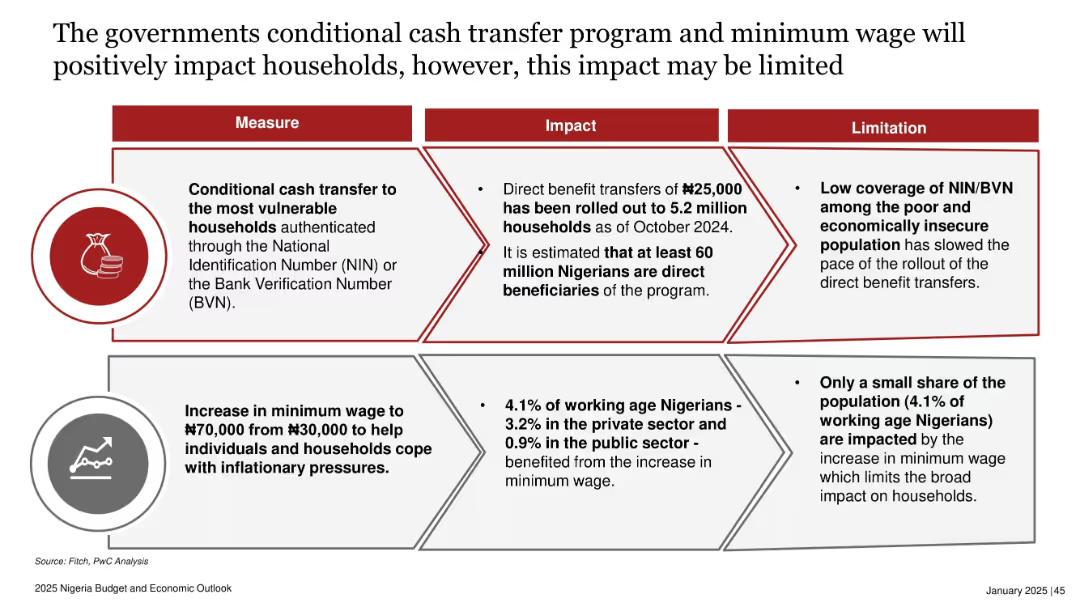
Two stacked horizontal sections, each with a three-column layout: Measure, Impact, and Limitation. Icons included to represent each initiative.
Strategic Planning
Government & Public Sector
The slide explains two government initiatives—conditional cash transfers and minimum wage increases—intended to help households cope with inflation. While impactful, the measures have limitations due to low ID coverage and limited reach, affecting their broad efficacy.
minimum wage, conditional cash transfer, NIN, BVN, household income, inflation mitigation, Nigeria policy, social intervention
Table
PwC/Strategy&
Saved
Title at top, large segmented circular graphic in the center divided into strategic and operational parts, various text annotations.
Strategic Planning
Professional Services
Explains the integration of platform strategies and operational capabilities within a digital ecosystem, emphasizing the need for a "platform mindset" and collaboration.
platform strategies, operational capabilities, digital ecosystem, collaboration
Diagram
Accenture
Saved
A world map highlighting regions with varying colors, pie charts detailing product types sold, and textual information about sales, margins, and operations.
Industry Overview
Consumer Goods
Outlines the sales distribution and product focus within the Asia, Oceania, and Africa regions, providing insights into market segmentation and operational scale. Helpful for regional strategic planning and resource allocation.
regional sales, market segmentation, operational scale, strategic planning, Nestlé
Multiple Chart
Deutsche Bank
Saved
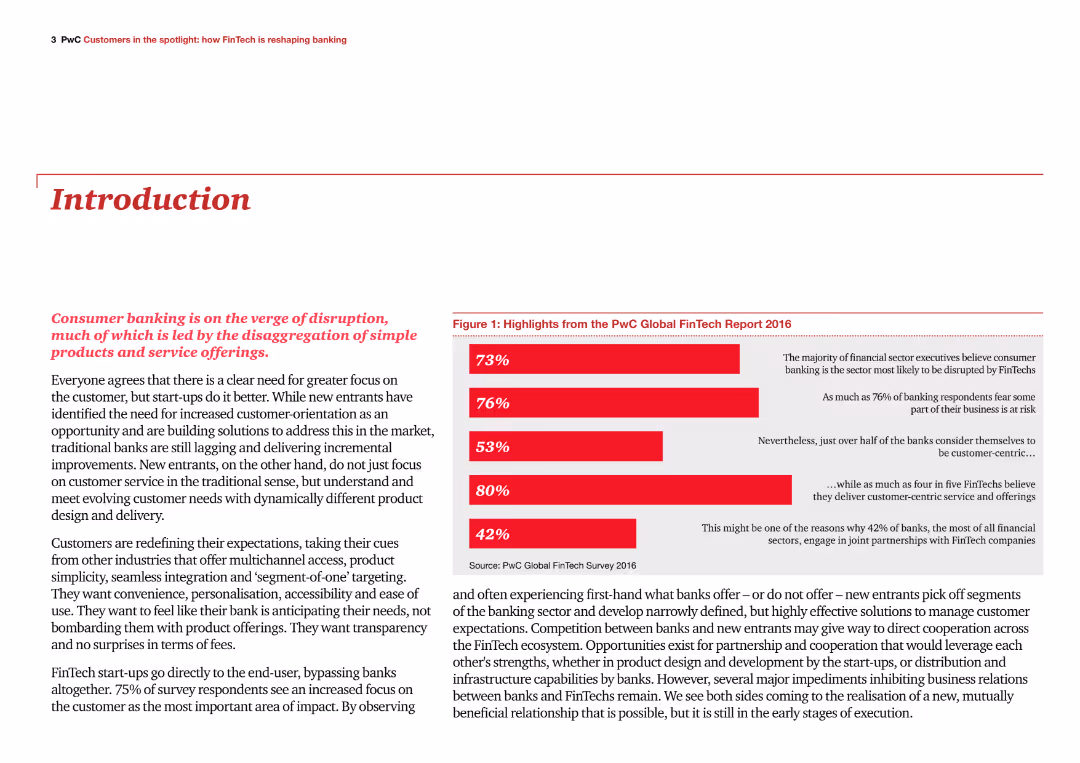
The slide has a title at the top, a paragraph of text, and a column chart on the right summarizing key highlights from the PwC Global FinTech Report 2016. The chart bars are in red, indicating different percentages.
Industry Overview
Financial Services
The slide introduces the report on how FinTech is reshaping banking, highlighting the disruptive impact on consumer banking and the importance of customer-centric approaches in the industry.
FinTech, banking, disruption, customer-centric, highlights
Mixed Chart
PwC/Strategy&
Saved
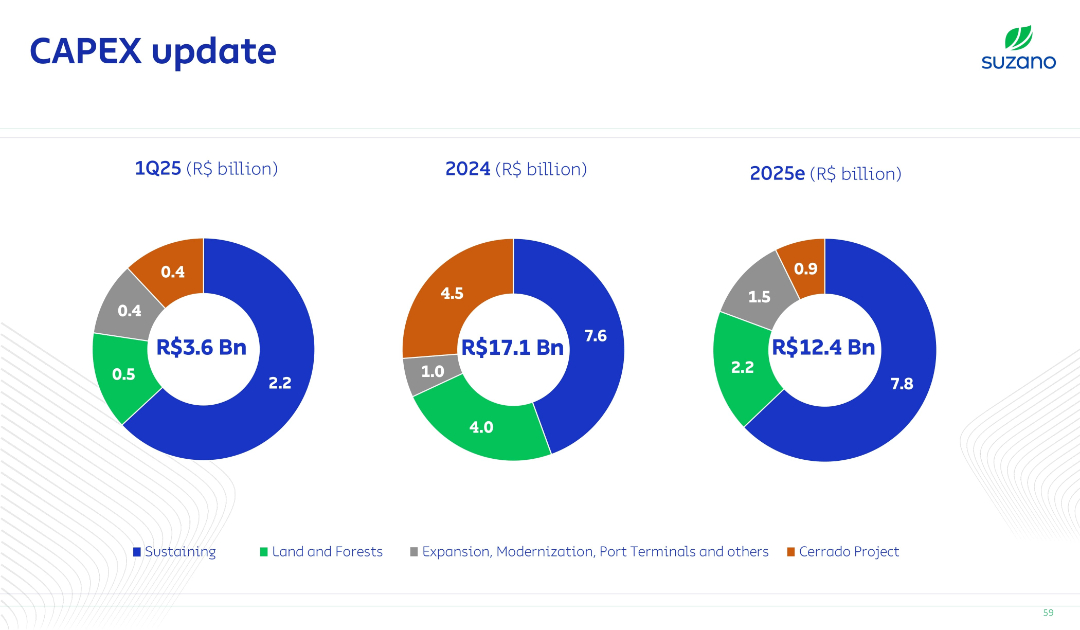
Three circular donut charts representing CAPEX breakdown for 1Q25, 2024, and 2025e; each segment color-coded by category (sustaining, land, projects, etc.).
Strategic Planning
Consumer Goods
This slide outlines Suzano’s capital expenditure plans by year and category, indicating major investments in sustaining operations and the Cerrado project. It emphasizes planned infrastructure and environmental allocations.
CAPEX, Investment, Forecast, Cerrado, Sustaining
Single Chart
Goldman Sachs
Saved
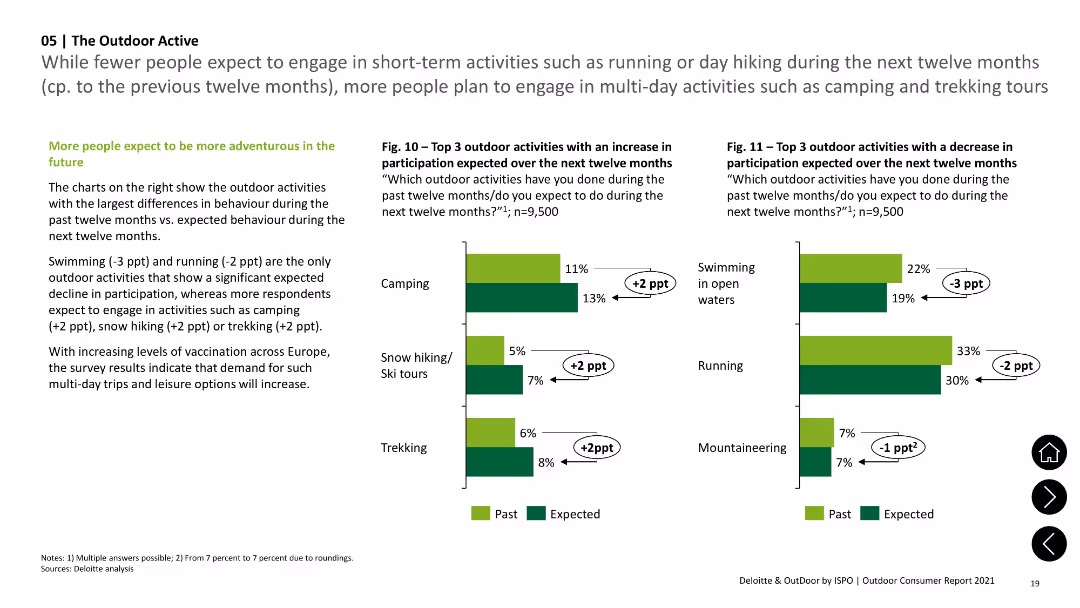
Column charts indicating past vs. expected future participation in various outdoor activities, with notes on changes in adventure expectations.
Market Analysis and Trends
Consumer Goods
Compares past participation rates in outdoor activities with future expectations, noting increases in camping and trekking.
Outdoor, Future, Camping, Trekking, Participation
Multiple Chart
Deloitte
Saved
The slide is divided into three sections: a left section with general statistics, a middle section with role distributions, and a right section with jurisdiction data, represented by bar charts.
Market Analysis and Trends
Financial Services
This slide summarizes the demographics of the survey respondents, including the size of family offices, their roles, and the jurisdictions they operate in within the APAC region.
demographics, APAC, survey, roles, jurisdictions
Multiple Chart
EY
Saved
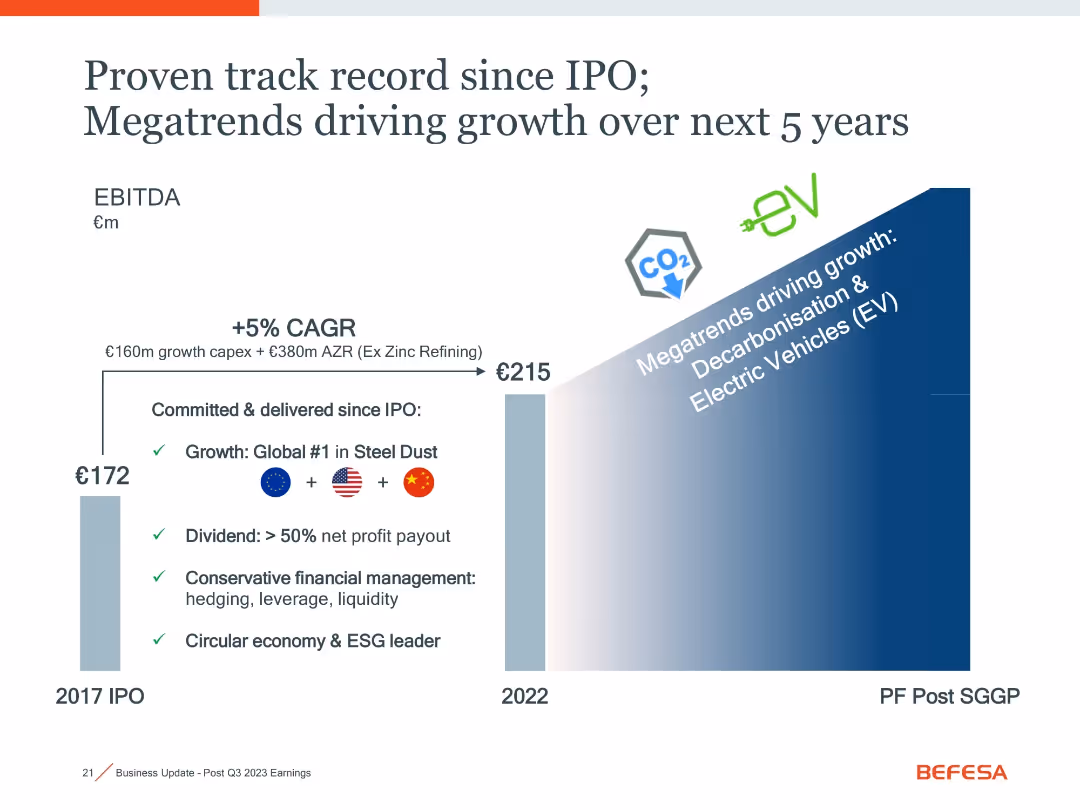
Bar chart showing EBITDA growth from 2017 to 2022 and future outlook, annotated with strategic highlights and trend icons (EV, CO2).
Financial Performance
Industrial & Manufacturing
This slide presents EBITDA growth since the company’s IPO, citing +5% CAGR and major strategic drivers like decarbonization and EV growth. It includes key financial management practices and market leadership in steel dust recycling.
EBITDA, IPO, CAGR, decarbonisation, EV, financial growth, steel dust
Single Chart
Goldman Sachs
Saved
Previous
Next
If nothing, comes up, please save your slides first
Create a FREE account to continue browsing
Receive Instant Access to 1,000+ slides from companies like McKinsey, Google, and Goldman Sachs
First Name
Last Name
Email
Password
I agree to all
Terms & Privacy Policy
Thank you! Your submission has been received!
Oops! Something went wrong while submitting the form.
Have an account?
Sign in
Column Chart
Heatmap
Chevron
Org Chart
Infographic
Callouts
Timeline
List
Graphic
Picture
Process Flow
Diagram
Paragraph
Map
Table
Framework
Subtitle
Takeaway Box
Icon
Other Chart
Radar Chart
Waterfall Chart
Mekko Chart
Pie Chart
Scatter Plot
Line Chart
Bar chart
Bullet points