My Account
My Slides
Search by Category
Templates
Leave Feedback
Login
Logout
Get Started
Browse all Slides
Browse all Slides
Create a FREE Account
Instant access to 1,000+ real slides from top companies like McKinsey, BCG, Goldman Sachs, Google and many more!
First Name
Last Name
Email
Password
I agree to all
Terms & Privacy Policy
Thank you! Your submission has been received!
Oops! Something went wrong while submitting the form.
Have an account?
Sign in
Saved Slides
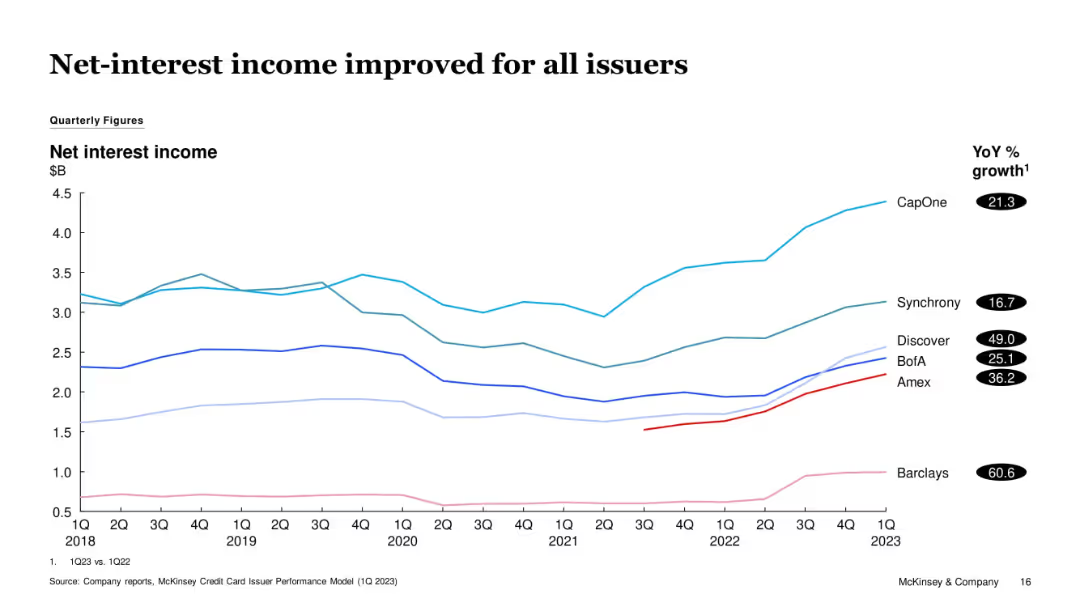
Multi-line graph tracking issuer-specific net-interest income from 1Q18 to 1Q23. YoY % growth listed next to issuer names.
Financial Performance
Financial Services
All tracked issuers saw improvements in net-interest income YoY, with Barclays and Discover showing the highest gains. The chart visualizes long-term recovery and growth momentum from earlier dips in 2020-2021.
Net Interest Income, Barclays, Discover, CapOne, Income Growth, Credit
Single Chart
McKinsey
Saved
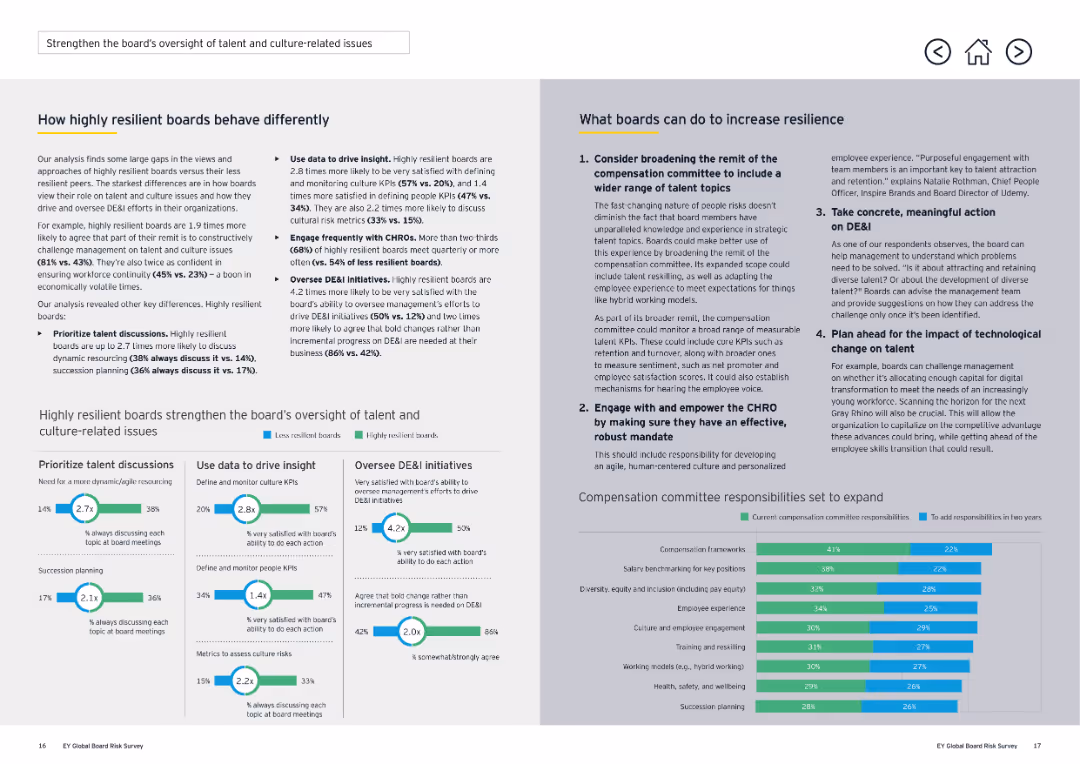
The slide mixes text and small graphs to discuss how resilient boards use different strategies to manage risk and improve decision-making.
Risk Assessment and Management
Professional Services
The slide emphasizes the strategic actions highly resilient boards take to manage risk, such as reviewing governance structures, engaging with trends, and embedding risk in performance reviews.
resilient boards, risk management, decision-making, professional services, governance, strategies, performance reviews
Multiple Chart
EY
Saved
Column charts display the top countries by the absolute number of post-secondary educated individuals in their young workforce for 2020 and projections for 2050.
Market Analysis and Trends
Education & Training
Analyzes current figures and future projections of post-secondary educational attainment in the young workforce of major countries, emphasizing the growing role of India and China and the relative performance of others like Korea and Japan.
education, workforce, projection, 2020, 2050
Multiple Chart
Roland Berger
Saved
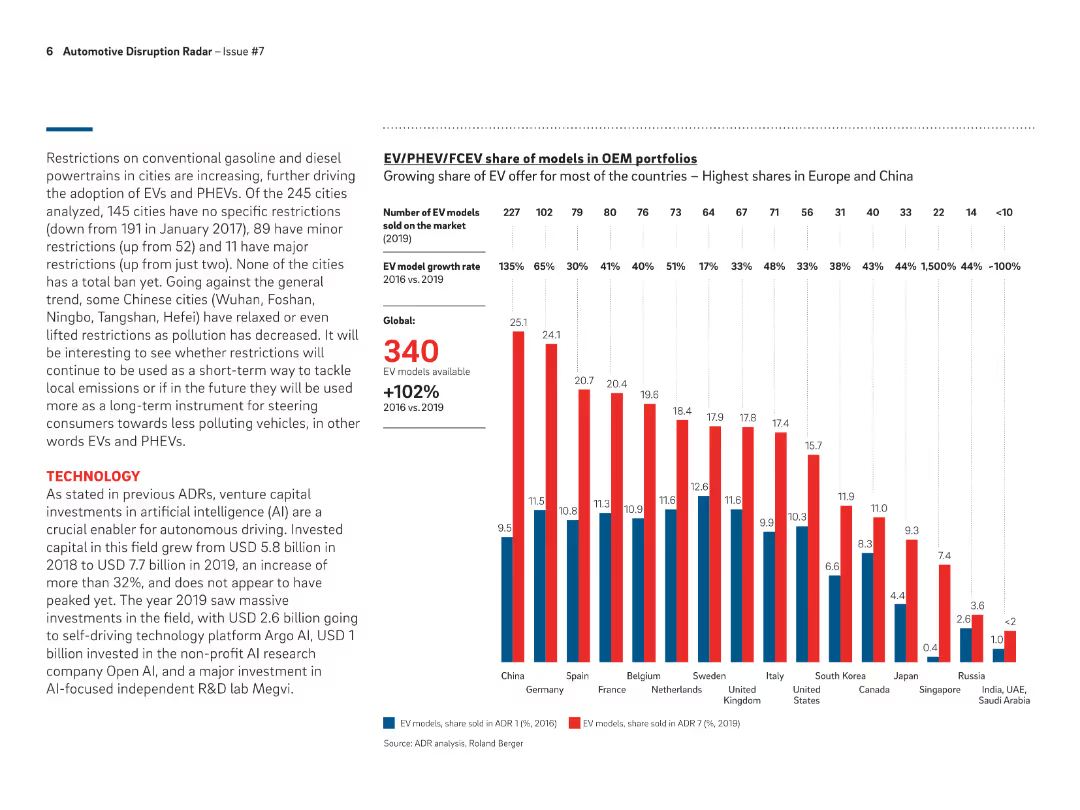
Bar chart showing the share of EV models in OEM portfolios across different countries in 2019, highlighting growth rates and number of models available globally.
Product and Service Analysis
Transportation & Logistics
Analyzes the growing share of EV models in OEM portfolios, with highest shares observed in Europe and China, and a global growth rate of 102% from 2016 to 2019.
EV models, OEM portfolios, growth rates, global, 2019
Mixed Chart
Roland Berger
Saved
This slide includes a header, body text, and four circular percentage indicators. Each indicator represents reasons for switching to virtual consultations, such as prescription renewals, minor medical conditions, discussing test results, and saving time.
Technology and Digital Transformation
Healthcare & Pharmaceuticals
The slide highlights reasons why Irish consumers would switch to virtual consultations for minor medical matters. Key reasons include prescription renewals, convenience, discussing test results, and saving time on travel and waiting.
healthcare, virtual consultations, minor matters, Ireland, convenience
Mixed Chart
EY
Saved
Contains multiple column charts showing the scaling intensity of digital proofs of concept across various business areas in the automotive industry.
Technology and Digital Transformation
Transportation & Logistics
Details how automotive OEM suppliers are implementing digital strategies across different business functions like production, supply chain, and security, showing their comparative scaling efforts.
automotive, digital transformation, scaling, operations, supply chain
Single Chart
Accenture
Saved
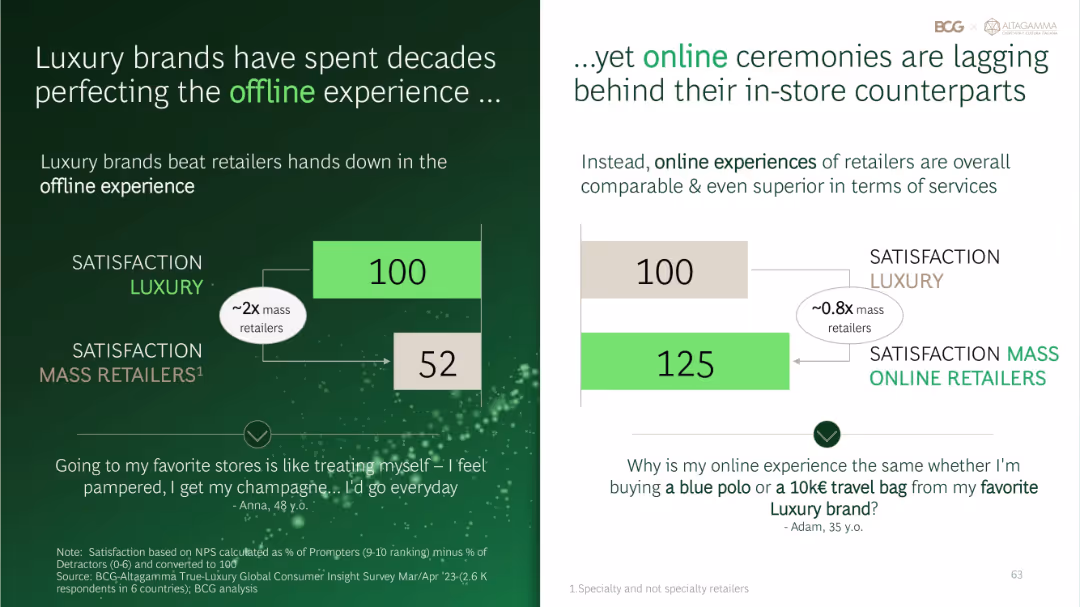
Two-panel layout comparing satisfaction scores for offline (left) and online (right) luxury vs. mass retailers using simplified bar graphics.
Performance Metrics and KPIs
Retail & E-commerce
Contrasts luxury vs. mass retailer satisfaction across offline and online experiences. Offline luxury retail scores very high, but online luxury satisfaction lags behind mass online retailers, suggesting a digital experience gap.
offline vs online, luxury retail, mass retailers, satisfaction gap, NPS
Multiple Chart
BCG
Saved
The slide features a bar chart comparing various research methods (tracking, focus groups, strategic, positioning, copy testing) used by winners, finalists, and those with no award. Bars are vertically oriented.
Market Analysis and Trends
Media & Entertainment
This slide highlights the importance of research methods like tracking and focus groups, showing their prevalence among award winners compared to finalists and non-award recipients.
research methods, tracking, focus groups, bar chart, award winners
Single Chart
IPSOS
Saved
Map layout with labeled regions indicating specific global uncertainties. Uses dashed lines and callout text to highlight issues in different geographic areas.
Risk Assessment and Management
Financial Services
Identifies global uncertainties affecting the financial landscape, including the war in Ukraine, recession in the Eurozone, big tech headwinds in the US, and China’s rebound.
global uncertainties, risk, financial impact, regions, analysis
Graphic
IPSOS
Saved
Includes column charts showing past revenue trends and projections, with a breakdown by geographic regions, utilizing a blue and grey color scheme.
Financial Performance
Financial Services
Analyzes the return to revenue growth, contrasting flat past trends with recent growth, broken down by U.S., Asia, and Mexico market contributions.
Revenue Growth, Projections, Trends, Geographic Segmentation, Business Investments
Multiple Chart
Citigroup
Saved
This slide displays comparative column charts of NPL ratios and cost of risk, alongside a map visualization to geographically contextualize the data.
Risk Assessment and Management
Financial Services
It assesses the bank's non-performing loan (NPL) ratio and risk costs across regions, demonstrating a cautious risk profile. Ideal for comparing financial stability across markets.
NPL Ratio, Risk Profile, Geographical Analysis, Financial Stability, Cost of Risk, Comparative Data
Multiple Chart
Morgan Stanley
Saved
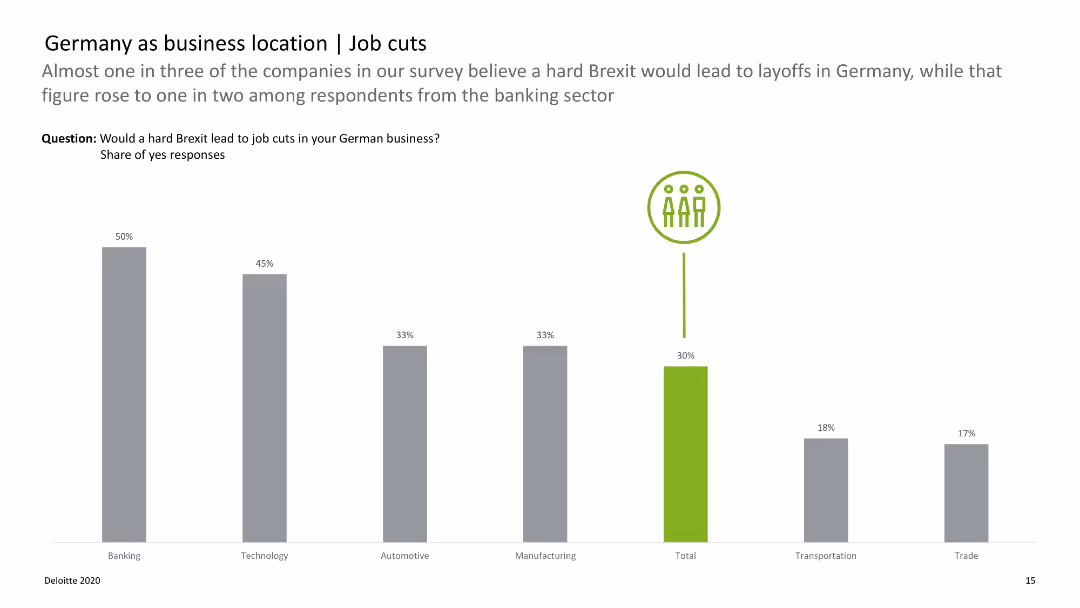
Bar chart displaying the likelihood of job cuts across various sectors due to Brexit, with color-coded bars.
Risk Assessment and Management
Financial Services
Analyzes the potential impact of a hard Brexit on job cuts in different sectors, highlighting banking and technology.
Germany, job cuts, Brexit, sectors, impact
Single Chart
Deloitte
Saved
Includes a dual-section infographic showing the size of the global private education market and the share of Asia, with color coding and annotations.
Market Analysis and Trends
Education & Training
This slide gives an overview of the global private education market size with a detailed breakdown of the Asian sector.
education market, global, Asia, private education, market size, regional breakdown, investment potential
Mixed Chart
EY
Saved
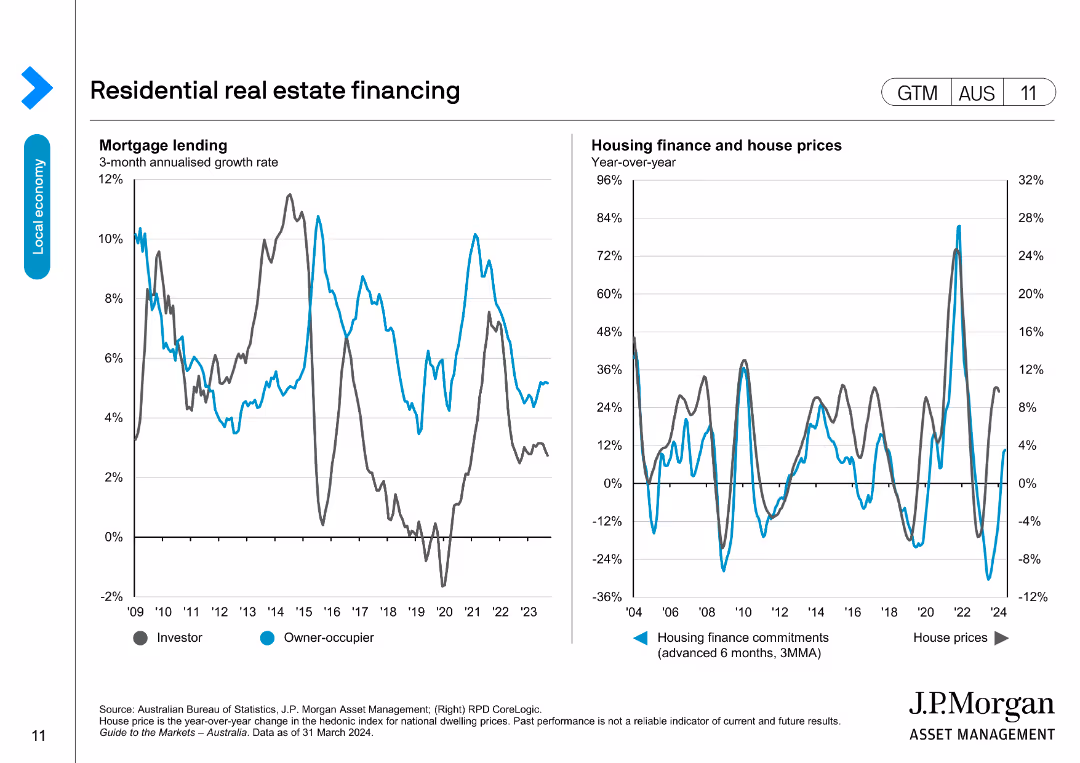
The slide presents two line charts: one on mortgage lending growth rates for investors and owner-occupiers, and the other on housing finance commitments and house prices.
Market Analysis and Trends
Real Estate & Construction
Analyzes trends in residential real estate financing, focusing on mortgage lending and housing finance metrics, useful for real estate market insights.
real estate, mortgage, housing finance, house prices, lending
Multiple Chart
JP Morgan
Saved
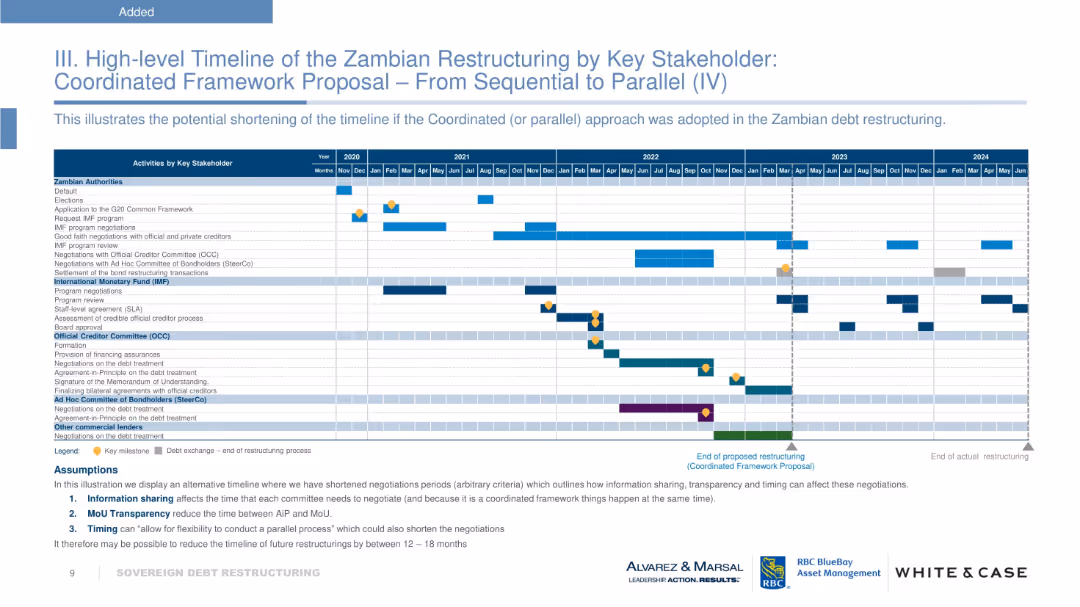
Gantt chart layout with horizontal bars, milestones, and color coding per stakeholder. Uses a calendar grid from 2020 to 2024. Bottom section includes a legend and bullet-pointed assumptions. Corporate branding along the bottom.
Strategic Planning
Financial Services
The slide provides a high-level timeline showing the restructuring process of Zambia's sovereign debt under a coordinated framework. It compares sequential vs. parallel negotiation phases involving multiple stakeholders like IMF, bondholders, and official creditors. The aim is to demonstrate potential time savings of 12–18 months.
Zambia, sovereign debt, restructuring, IMF, bondholders, coordinated framework, timeline, milestones, assumptions
Table
Alvarez & Marsal
Saved
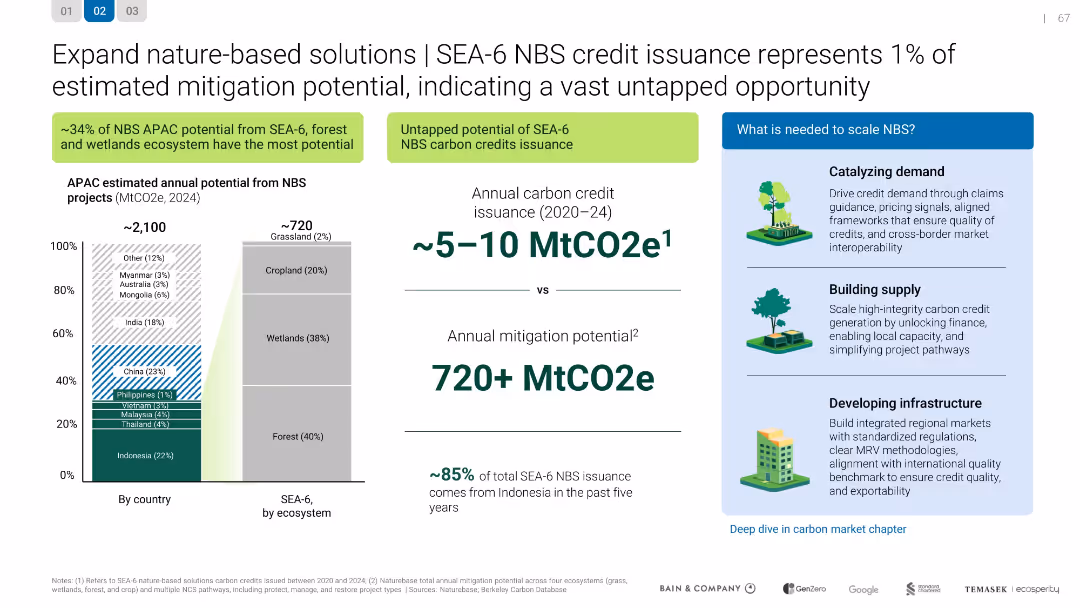
SEA-6 NBS credit issuance represents 1% of estimated mitigation potential
Investment Analysis
Environmental Services & Sustainability
Investment Analysis
Shows SEA-6's underutilized potential in issuing carbon credits from nature-based solutions, with >720 MtCO2e mitigation possible. Recommends steps to scale NBS through demand, supply, and infrastructure development.
Mixed Chart
Bain
Saved
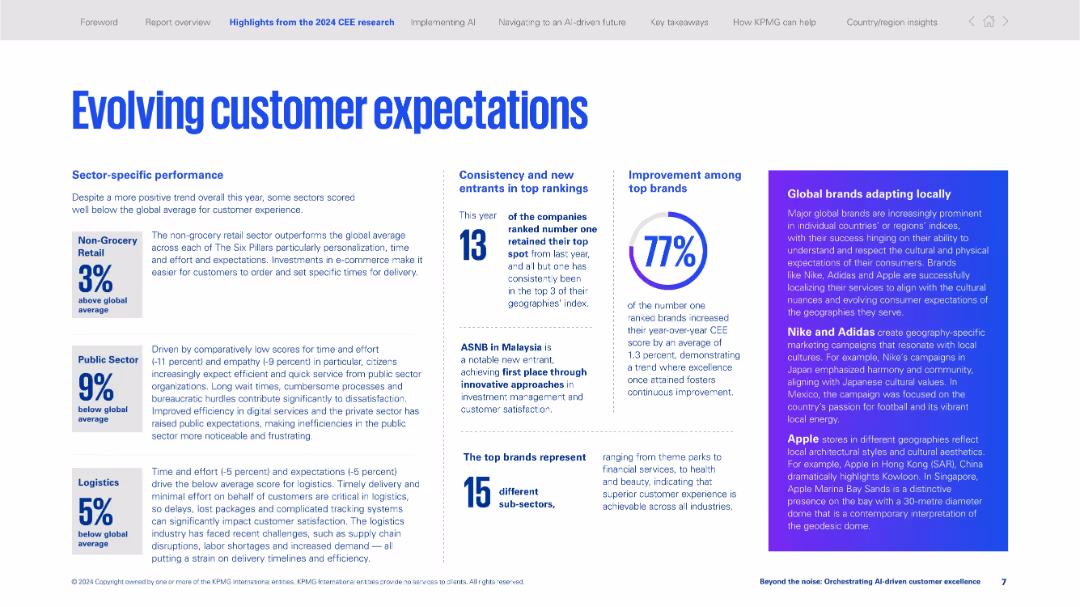
Grid-style layout with data points, stats, and textual commentary about customer experience trends by sector.
Market Analysis and Trends
Professional Services
Analyzes customer experience across sectors such as retail, public, and logistics. Discusses emerging consumer expectations and brand localization strategies. Provides CEE performance benchmarks and brand highlights.
customer experience, sector trends, logistics, retail, public sector, localization, brand strategy, global brands, expectations
Mixed Chart
KPMG
Saved
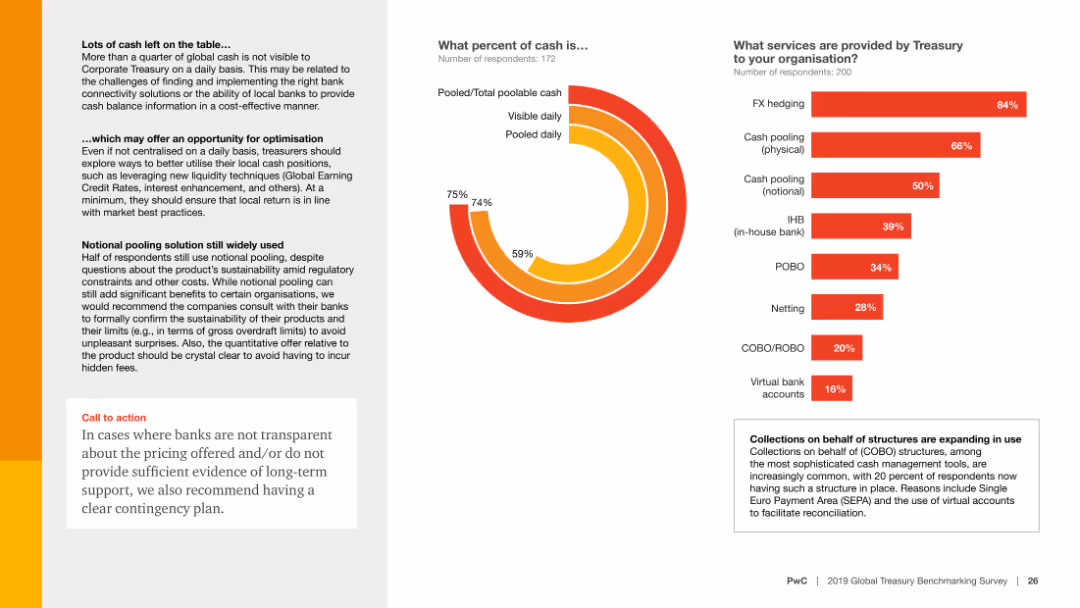
Features a column chart showing satisfaction scores for various Treasury processes. Text elaborates on the challenges with bank fee analysis and management.
Technology and Digital Transformation
Financial Services
Highlights the dissatisfaction with bank fee analysis and bank account management among treasurers, advocating for better transparency and standardized information.
Technology support, satisfaction, bank fees, transparency, standardization
Multiple Chart
PwC/Strategy&
Saved
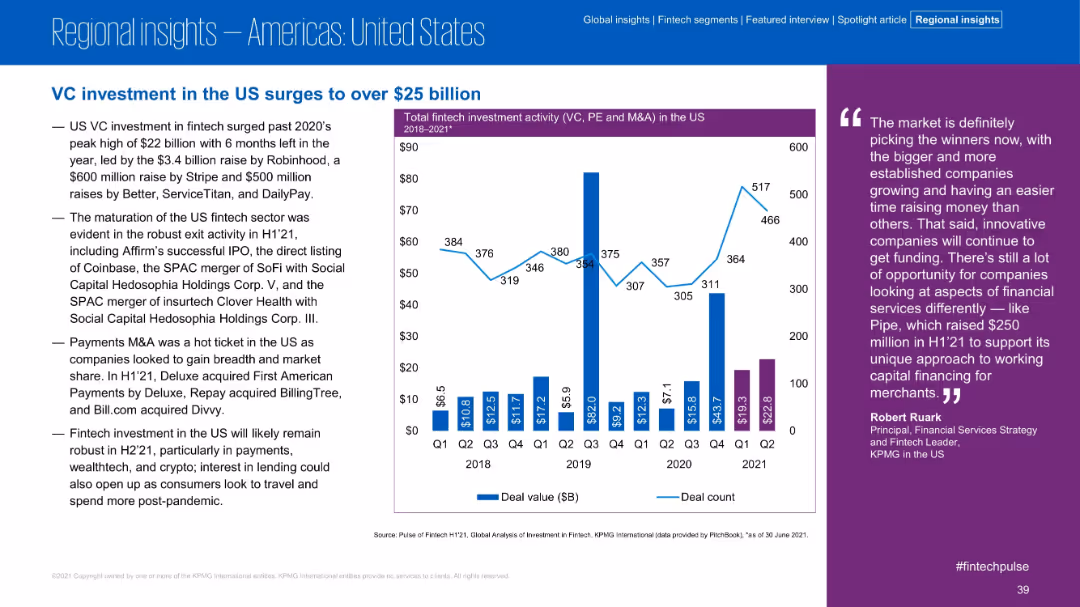
Text-heavy left section lists major deals and exits; right side features a bar-line combo chart for quarterly US investment activity 2018–2021
Market Analysis and Trends
Financial Services
The US fintech sector surpassed $25B in VC investment in H1 2021, led by major raises (Robinhood, Stripe, Better) and significant exit activity (Coinbase, SoFi). The chart reveals strong Q1 and Q2 2021 deal values, signaling continued momentum and investor confidence.
US fintech, Robinhood, VC investment, IPO, SPACs, Stripe, market activity, Q1 Q2 2021
Mixed Chart
KPMG
Saved
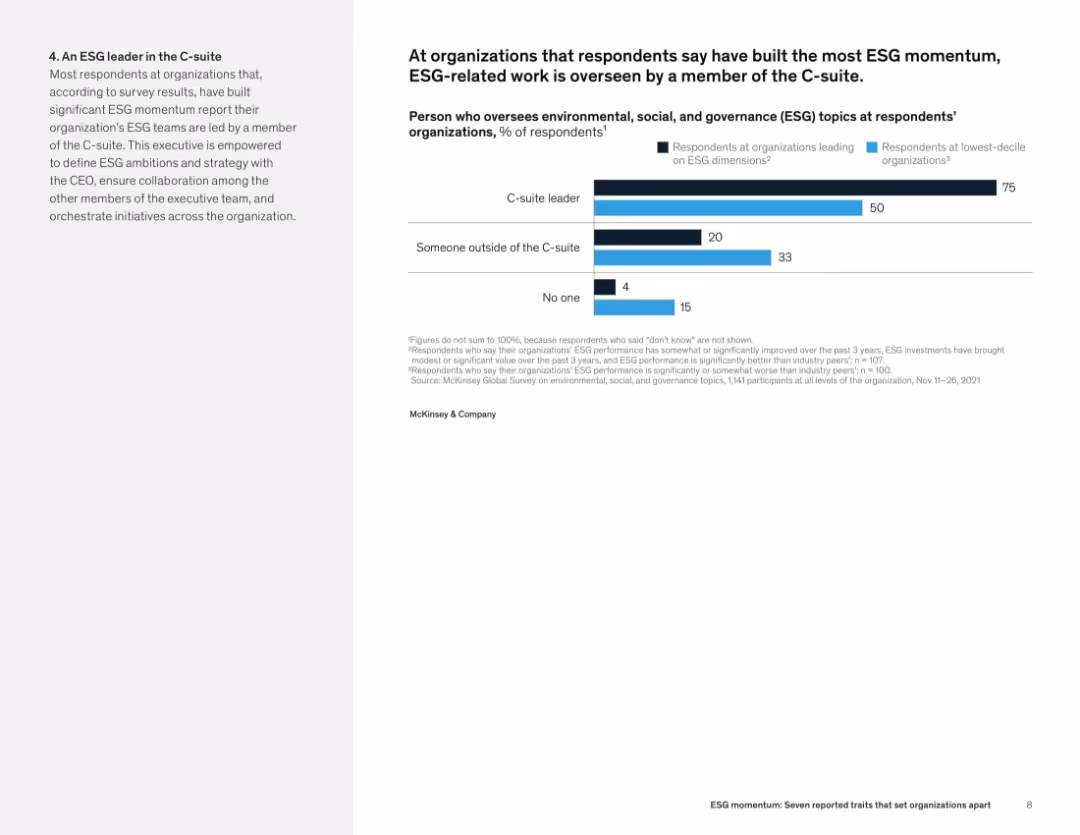
Left-aligned text alongside a horizontal bar chart showing who manages ESG at leading vs. lagging organizations.
Organizational Structure and Change
Professional Services
This slide indicates that C-suite leadership is a hallmark of high-performing ESG organizations. 75% of such firms have ESG led by C-level executives, compared to just 50% of bottom performers. The data suggests that senior oversight enhances ESG outcomes.
ESG governance, executive leadership, C-suite, organizational structure, ESG performance, oversight roles
Mixed Chart
McKinsey
Saved
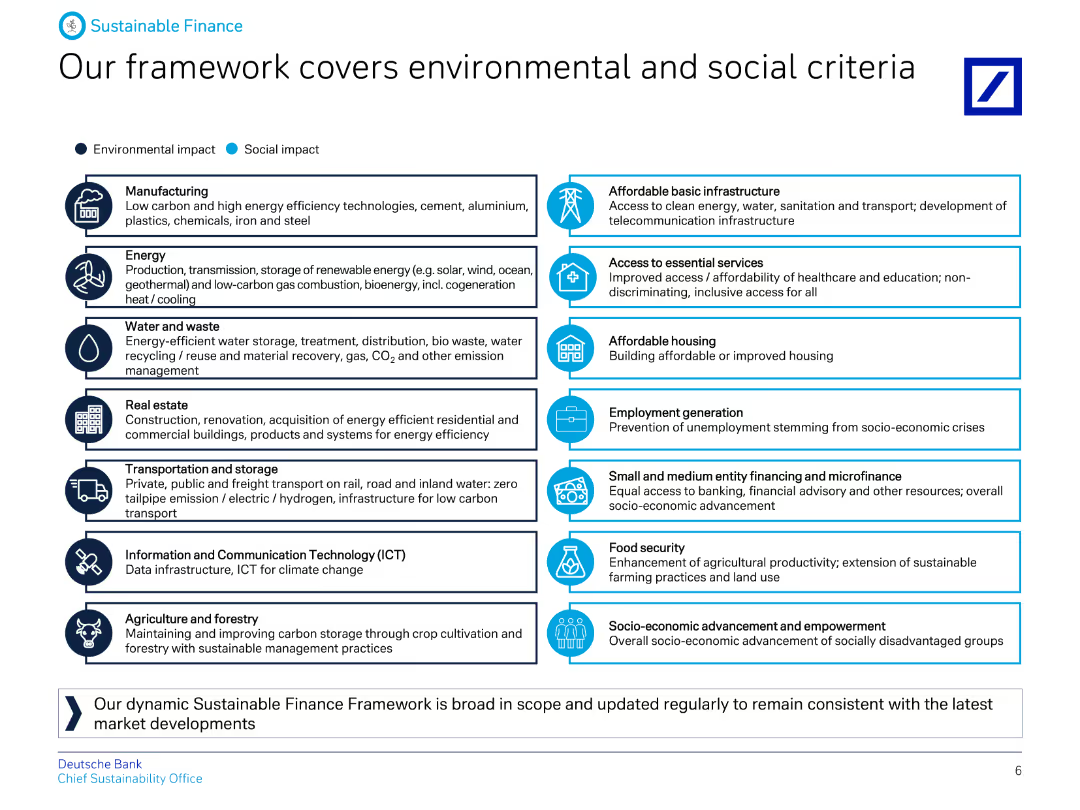
A detailed diagram categorizing various sectors under environmental and social impacts, with icons representing each category and descriptive text.
Regulatory and Compliance
Financial Services
The slide details Deutsche Bank's Sustainable Finance Framework, outlining the environmental and social criteria covered, including sectors like energy, real estate, and ICT.
Environmental, social, criteria, finance, framework, impact, sectors, sustainability, banking, regulation
Table
Deutsche Bank
Saved
The slide showcases a column chart displaying a decrease in branch transactions against an increase in other channel transactions, along with a list of technological levers and movement to more efficient channels.
Operational Efficiency
Financial Services
It contrasts the decline in branch transactions with growth in digital channel usage, underscoring the efficiency driven by technology in banking operations. Ideal for analyzing technology's role in operational efficiency.
Efficiency, Digital Channels, Branch Transactions, Technological Levers, Automation, Process Improvement
Multiple Chart
Morgan Stanley
Saved
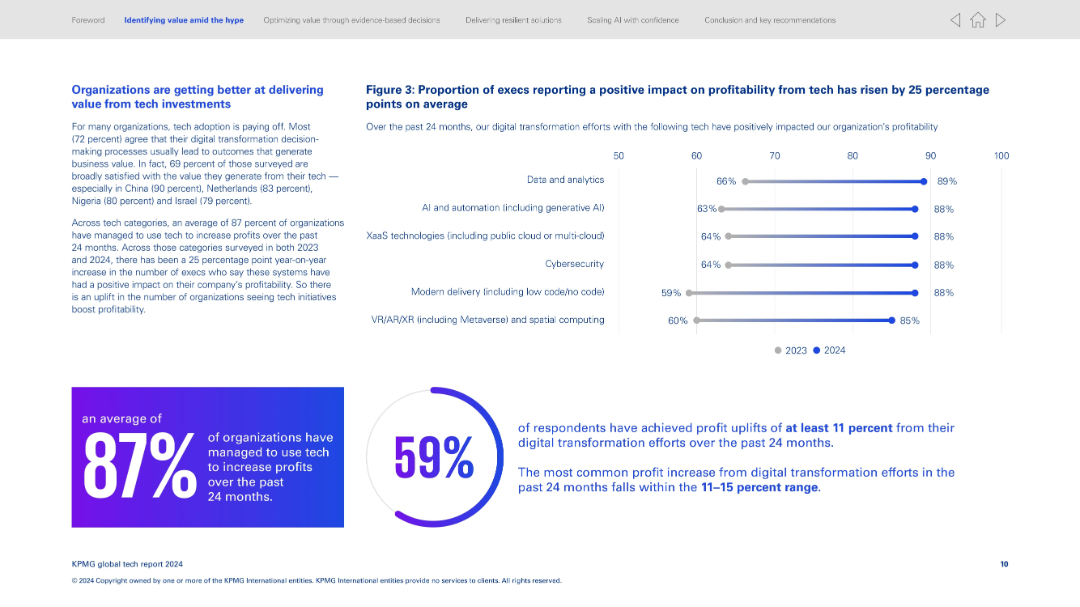
Split layout; left side has text-heavy content, right side has horizontal bar graph; bottom features two percentage callouts in circular design.
Strategic Planning
Technology & Software
Highlights how organizations are increasingly generating value from tech investments, especially digital transformation. Key statistics show 87% of organizations increased profits through tech, and 59% saw profit uplifts of at least 11%. The graph shows improved profitability across various tech domains from 2023 to 2024.
Digital transformation, profitability, AI adoption, data analytics, tech ROI, global survey, tech satisfaction, percentage uplift, cloud tech, VR/AR
Multiple Chart
KPMG
Saved
Contains images of products with detailed descriptions and two circles highlighting specific technologies. There's a dark background with text overlays. The images are crisp, focusing on technological features of products.
Technology and Digital Transformation
Industrial & Manufacturing
Focuses on Stoneridge's recent technological advancements in automotive components, showcasing the company's innovation in the market. It’s useful for illustrating the practical application of their technology in modern vehicles.
innovation, automotive, technology, launch, performance
Table
Deutsche Bank
Saved
Features a mix of column and square table with four sections showing the performance of companies during economic downturns. The visual arrangement is neat, using contrasting colors to differentiate between winners and losers, enhancing readability and focus.
Financial Performance
Financial Services
Analyzes company performance during economic downturns, classifying companies as winners or losers based on growth and profit margins. It highlights significant performance gaps, aiming to provide insights into effective financial management and strategic planning during challenging times.
economic downturns, company performance, growth, profit margins, financial strategy
Multiple Chart
Deloitte
Saved
Previous
Next
If nothing, comes up, please save your slides first
Create a FREE account to continue browsing
Receive Instant Access to 1,000+ slides from companies like McKinsey, Google, and Goldman Sachs
First Name
Last Name
Email
Password
I agree to all
Terms & Privacy Policy
Thank you! Your submission has been received!
Oops! Something went wrong while submitting the form.
Have an account?
Sign in
Column Chart
Heatmap
Chevron
Org Chart
Infographic
Callouts
Timeline
List
Graphic
Picture
Process Flow
Diagram
Paragraph
Map
Table
Framework
Subtitle
Takeaway Box
Icon
Other Chart
Radar Chart
Waterfall Chart
Mekko Chart
Pie Chart
Scatter Plot
Line Chart
Bar chart
Bullet points