My Account
My Slides
Search by Category
Templates
Leave Feedback
Login
Logout
Get Started
Browse all Slides
Browse all Slides
Create a FREE Account
Instant access to 1,000+ real slides from top companies like McKinsey, BCG, Goldman Sachs, Google and many more!
First Name
Last Name
Email
Password
I agree to all
Terms & Privacy Policy
Thank you! Your submission has been received!
Oops! Something went wrong while submitting the form.
Have an account?
Sign in
Saved Slides
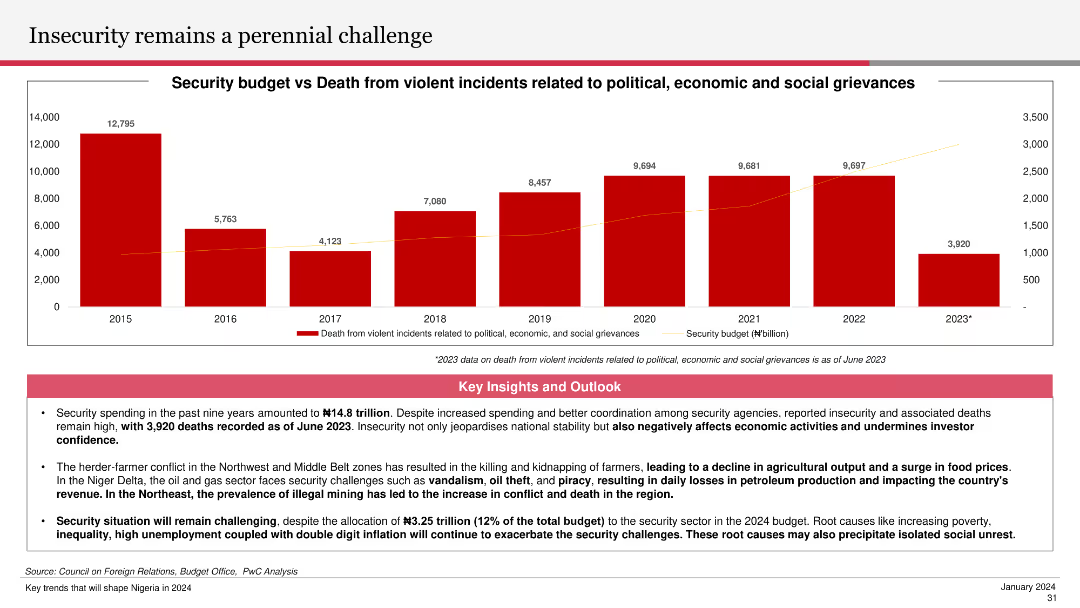
The slide features a column chart showing the security budget versus deaths from violent incidents from 2015 to 2023. Key insights and outlooks below the chart discuss the impact of insecurity on economic activities and investor confidence.
Risk Assessment and Management
Government & Public Sector
The slide highlights the ongoing security challenges and their economic implications, detailing the trend in security budgets and related deaths. It emphasizes the importance of addressing security issues to improve investor confidence and economic stability.
insecurity, security budget, violent incidents, economic impact, investor confidence
Mixed Chart
PwC/Strategy&
Saved
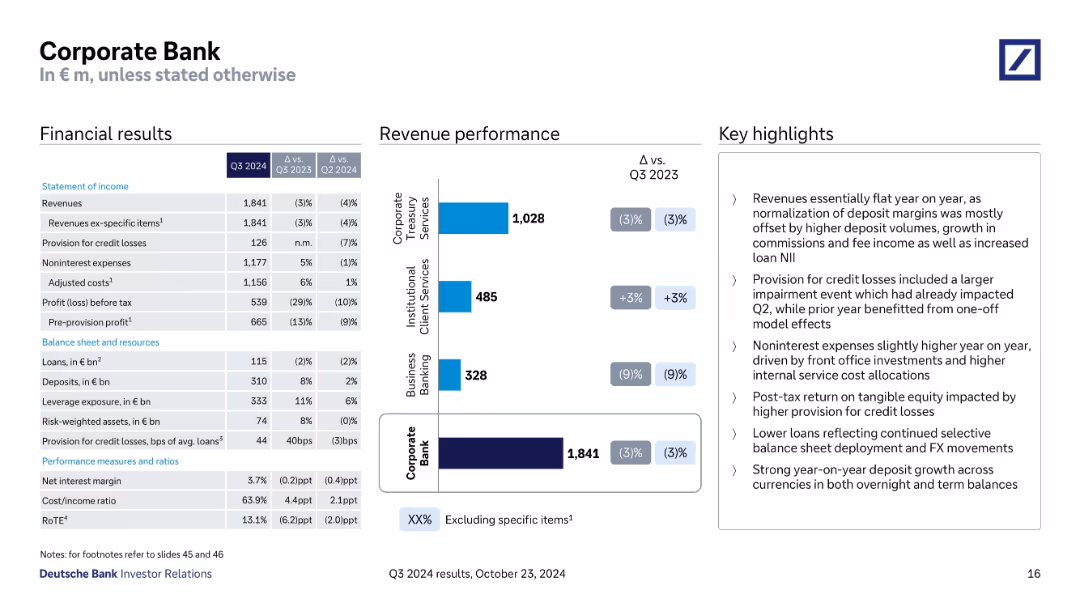
Split into financial results table, revenue chart, and highlights; detailed KPI breakdown.
Financial Performance
Financial Services
Covers Q3 2024 performance of the Corporate Bank, including revenue declines, cost management, credit loss provisions, and segment revenue breakdown. Discusses deposit growth, margin normalization, and internal service cost increases.
Corporate Bank, deposit growth, credit losses, revenue mix, RoTE
Mixed Chart
Deutsche Bank
Saved
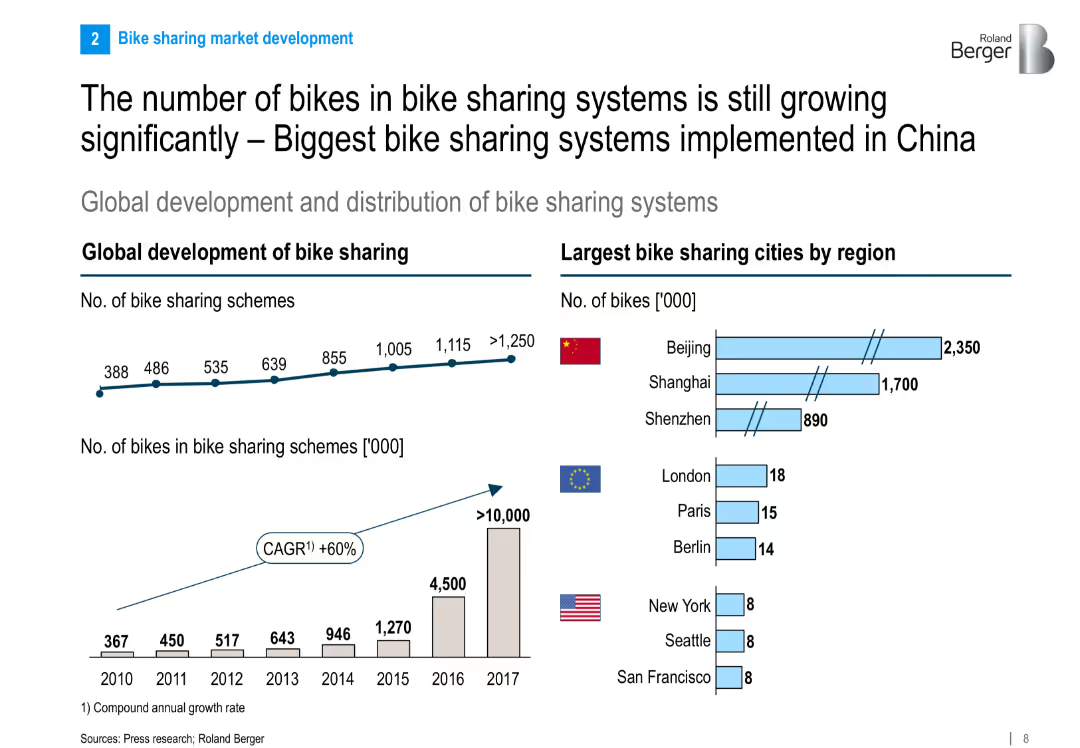
Dual charts: a time-series graph showing growth of schemes and bikes globally, and a bar chart comparing leading cities by number of bikes.
Market Analysis and Trends
Transportation & Logistics
This slide presents the strong growth trajectory of global bike sharing systems, with China’s cities like Beijing and Shanghai leading in bike count. It shows the annual increase in schemes and bike volumes from 2010 to 2017.
bike sharing, growth, China, global development, urban mobility, market trends, cities, statistics
Multiple Chart
Roland Berger
Saved
With a green backdrop, this slide features three main points and their corresponding icons on the left and benefits of clear communication on the right.
Human Resources and Talent Management
Technology & Software
Focuses on the importance of transparent communication regarding compensation packages and tools that can be utilized for this purpose.
communication, compensation, transparency, motivation, offer letter, incentive plan, handbook
Header Vertical
Kearney
Saved
Includes market share column and line charts for equities and FICC, along with a market share comparison bar chart against peers.
Market Analysis and Trends
Financial Services
Demonstrates firm’s leading positions in equities and FICC, and market share growth relative to peers.
Equities, FICC, Market Share, Industry Wallet, Competitive Analysis
Multiple Chart
JP Morgan
Saved
Diagram describing the metaverse and its components (Meta world, Meta space, Meta reality, Meta economy), with text explaining its potential impact on society.
Technology and Digital Transformation
Technology & Software
The slide explores the concept of the metaverse, discussing how it could extend the impact of social media to create a fully digital and virtual society. It highlights the different aspects of the metaverse and their potential to transform daily life and global society, suggesting that social media is a precursor to this broader change.
Metaverse, Social Media, Virtual Society, Impact
Vertical Flow
Roland Berger
Saved
Contains several column charts and key financial metrics summary for Q4 and the fiscal year 2021, highlighting changes and annual trends.
Financial Performance
Financial Services
Reviews Citigroup's financial performance in 2021, highlighting revenue trends, expense management, and net income.
Financial, Metrics, Revenue, Expenses, Performance
Mixed Chart
Citigroup
Saved
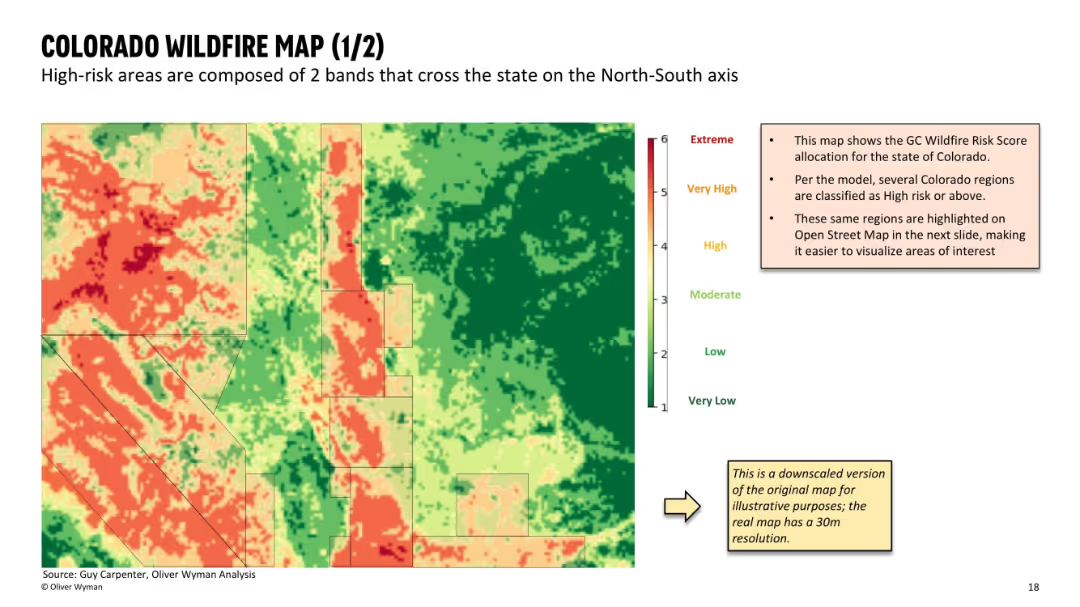
Full-screen heat map of wildfire risk zones using gradient from green (low) to red (extreme); includes a small annotation panel explaining data origin and purpose; clean, map-focused layout with minimal text.
Risk Assessment and Management
Financial Services
This slide shows a detailed wildfire risk map of Colorado, based on GC Wildfire Risk Scores. Two prominent high-risk bands are visible running north-south. The slide helps visualize geographic exposure for insurers and supports analysis of ZIP-level underwriting decisions.
wildfire risk, Colorado map, geographic exposure, heat map, GC score, insurance risk, spatial analysis, underwriting map, high-risk zones
Mixed Chart
Oliver Wyman
Saved
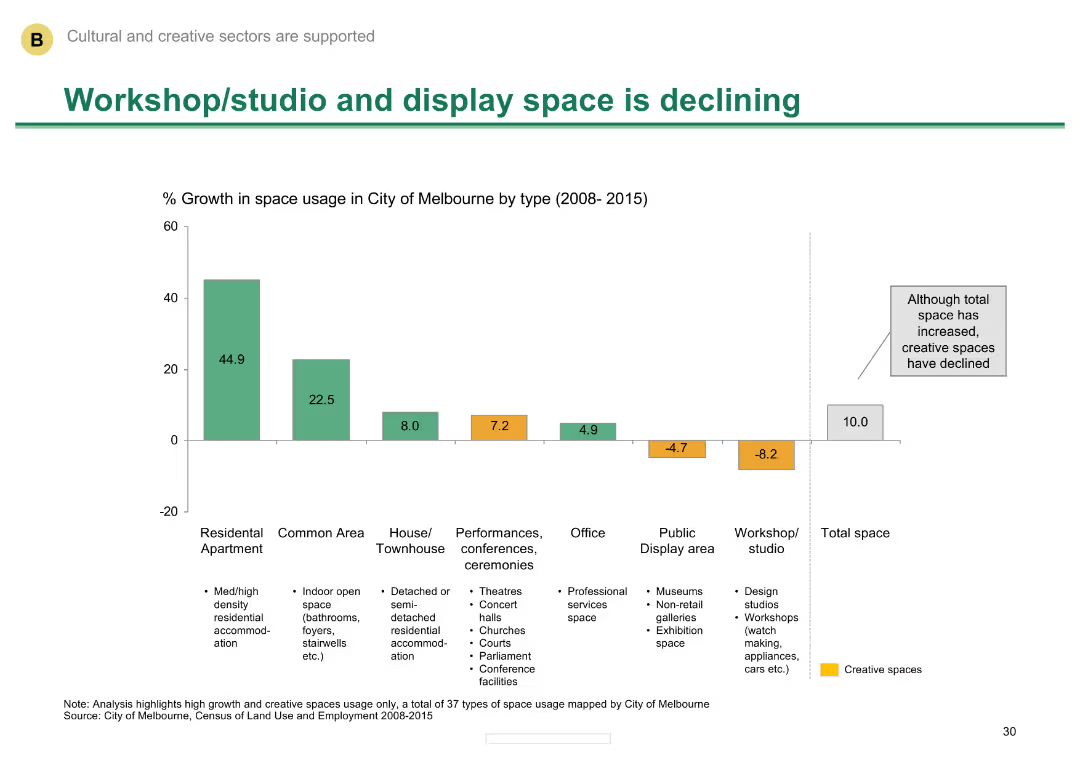
Column chart showing percentage growth in space usage in Melbourne by type from 2008-2015
Market Analysis and Trends
Media & Entertainment
Shows the decline in workshop/studio and display space in Melbourne, despite an increase in total space.
Space usage, Melbourne, decline, workshop/studio, display space
Single Chart
BCG
Saved
The slide presents statistical data regarding the significance of survey results in a formatted text layout with bullet points and headers.
Performance Metrics and KPIs
Telecommunications
This slide explains the statistical significance and methodology behind a survey conducted by NBN Co, detailing confidence levels and sample sizes.
statistical significance, survey, methodology, NBN Co, data analysis, sample size
Table
Accenture
Saved
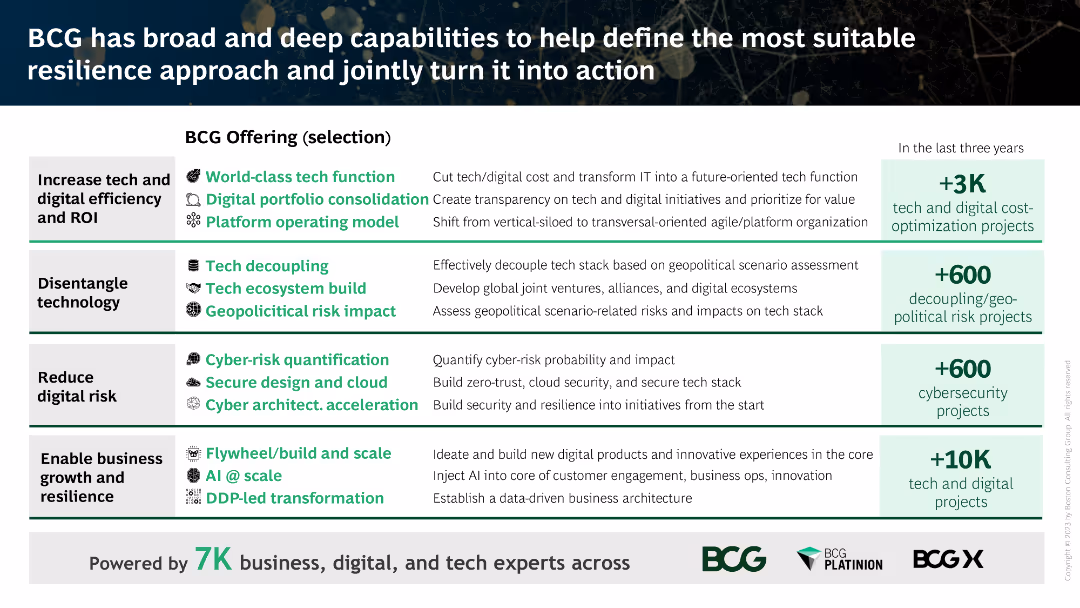
The slide is divided into multiple sections, each highlighting BCG's offerings with icons, descriptive text, and numerical data on completed projects.
Client Case Studies
Professional Services
This slide showcases BCG's capabilities in increasing tech efficiency, disentangling technology, reducing digital risk, and enabling business growth and resilience.
BCG, tech efficiency, digital risk, business growth, resilience
Vertical Flow
BCG
Saved
Three columns comparing investment offering, structured lending capability, and cross-divisional collaboration.
Competitive Landscape
Financial Services
Describes Credit Suisse's unique capabilities that set it apart in the market, focusing on investments and lending solutions.
investment, lending, collaboration, competitive advantage, client value
Pillar
Credit Suisse
Saved
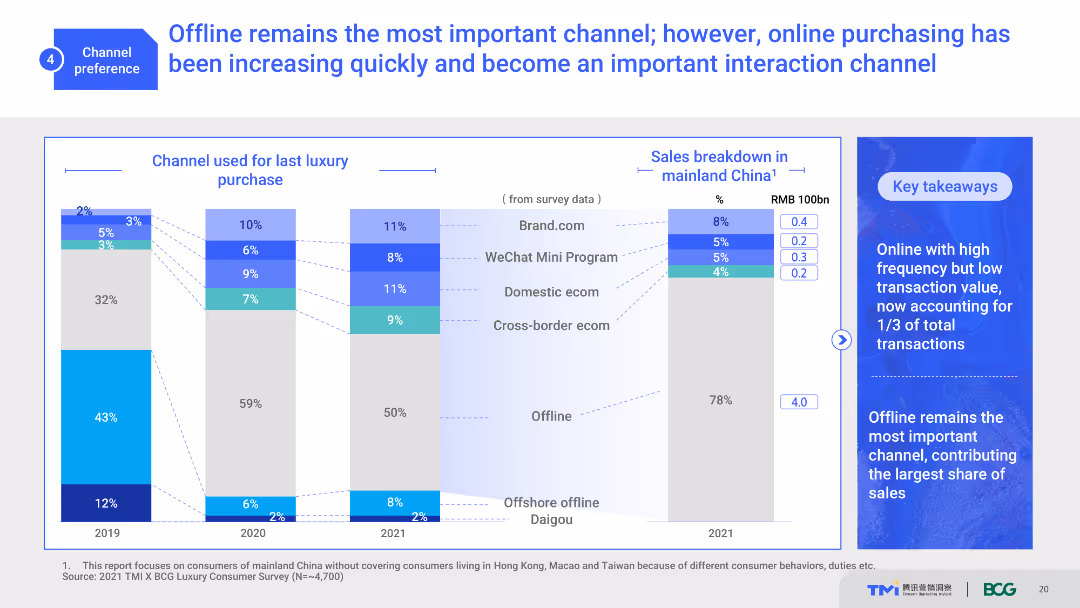
The slide uses a combination of stacked bar charts and text boxes to illustrate the importance of offline and online channels for luxury purchases. It shows channel usage trends from 2019 to 2021 and a sales breakdown in mainland China. The visual complexity is moderate with clear data presentation.
Market Analysis and Trends
Retail & E-commerce
This slide highlights the shifting consumer preferences between offline and online channels for luxury purchases. It shows historical trends and current channel usage, emphasizing the growing importance of online interactions.
channel preference, offline, online, luxury purchases, consumer behavior
Multiple Chart
BCG
Saved
Contains a split-view layout showcasing data intake sources and the outcomes from using a cloud-based data platform, with icons and charts.
Technology and Digital Transformation
Financial Services
Details the use and impact of JPMorgan’s cloud-based data platform in optimizing business operations and enhancing decision-making processes through data analytics and management.
Data Platform, Cloud-Based, Business Optimization, Data Analytics, Decision Making
Mixed Chart
JP Morgan
Saved
The slide has a pie chart showcasing fee revenue mix, bar graphs representing assets under management, and a variety of textual content. The layout is clean, with clear segmentation of sections, and uses blue and grey hues for the graphs, accented by bold colors to highlight key data points.
Financial Performance
Financial Services
It details Fifth Third's diverse fee revenue sources and the strength of its Wealth & Asset Management business, highlighting consistent growth and key priorities. The slide's comprehensive data presentation would be ideal for investor relations or strategic financial planning sessions, discussing revenue diversification and business scale in comparison to peers.
Fee Revenue, Diversification, Wealth Management, Growth, Pie Chart, Bar Graphs, Financial Services, Strategy, Comparison
Multiple Chart
Goldman Sachs
Saved
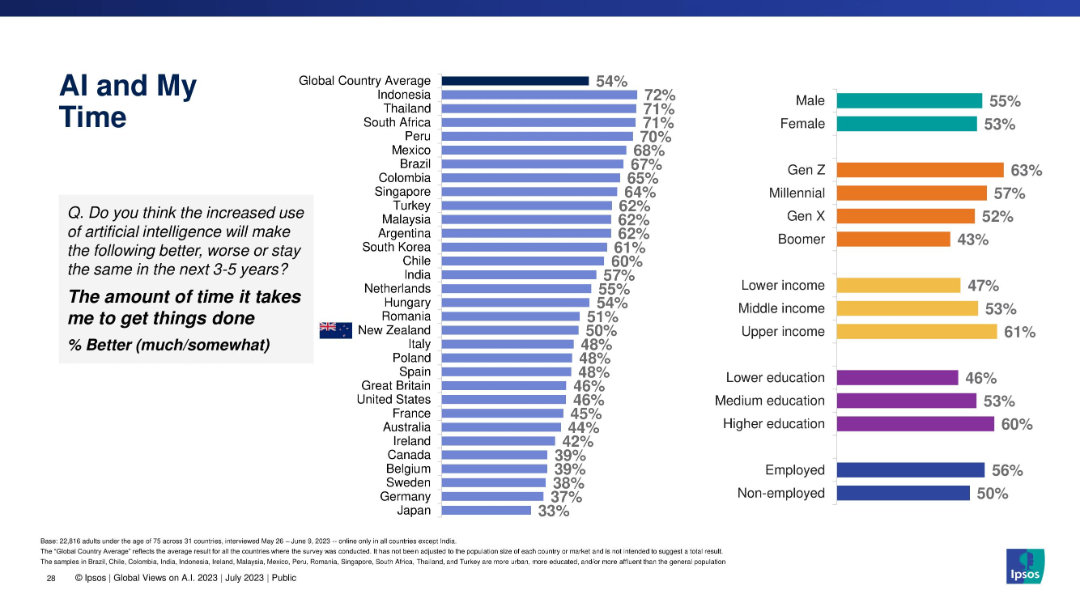
Ranked bar chart comparing countries and demographics on the belief that AI will improve time efficiency, with bars color-coded by category.
Operational Efficiency
Artificial Intelligence
The slide compares how countries and demographic segments believe AI will improve time efficiency. Indonesia leads globally, and younger generations are more optimistic than older ones.
AI, productivity, time efficiency, global ranking, generational views, education level, gender, country comparison
Multiple Chart
IPSOS
Saved
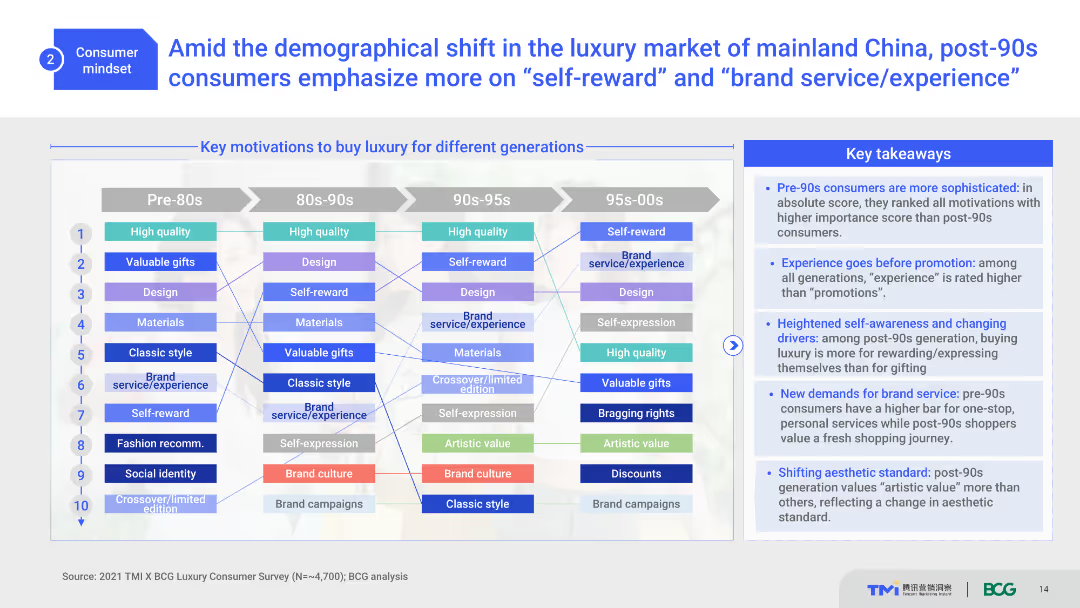
The slide uses a comparative list format to display key motivations for buying luxury across different generations, using lines and boxes in multiple colors for clarity.
Customer and Market Segmentation
Consumer Goods
It highlights the motivations of different generations for purchasing luxury items, emphasizing self-reward and brand experience for post-90s consumers.
Motivations, Generations, Luxury, Self-reward, Brand Experience
Boxed
BCG
Saved
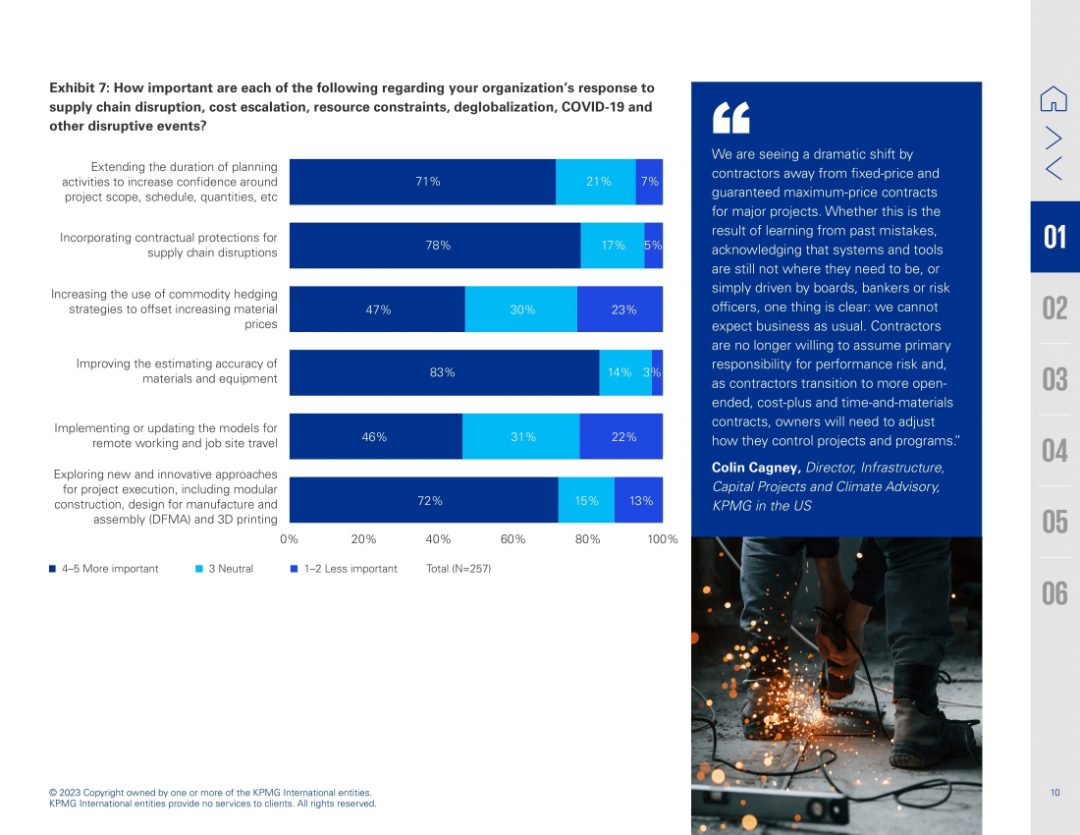
Single-column layout with six horizontal bar charts stacked vertically (Exhibit 7). Right side features a quote and photo of construction workers. Each bar indicates importance level of various risk-mitigation strategies.
Risk Assessment and Management
Real Estate & Construction
The slide explores strategies to respond to disruptions like supply chain issues and cost escalation. The highest priority is improving estimating accuracy (83%), followed by contractual protections and innovative execution methods. The accompanying quote emphasizes a shift away from fixed-price contracts as contractors aim to mitigate performance risk in volatile environments.
risk response, estimating accuracy, planning, innovation, DFMA, contract models, remote work, construction disruption, strategy
Mixed Chart
KPMG
Saved
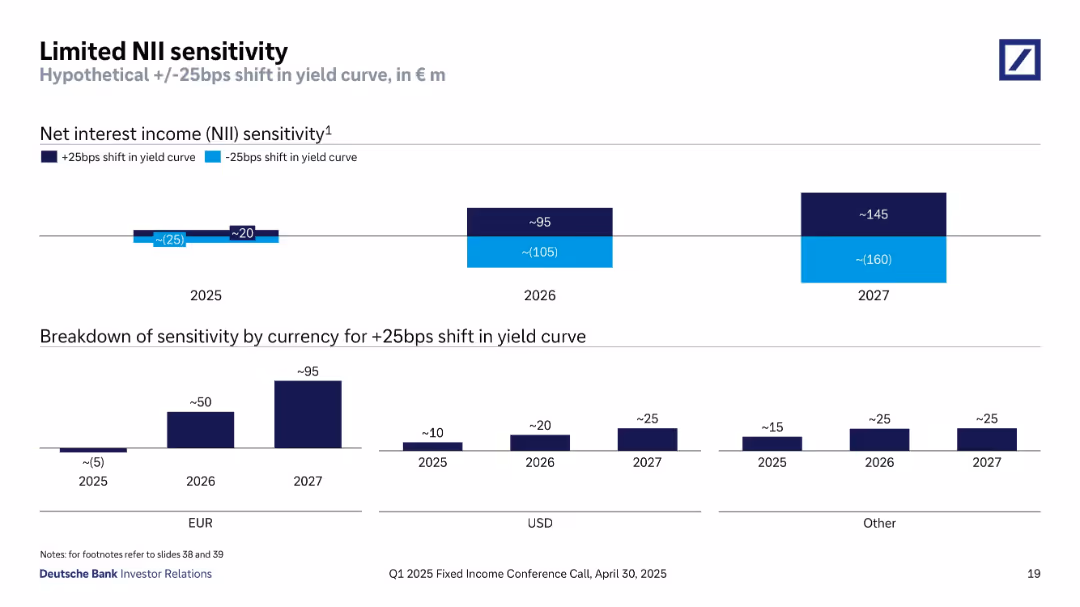
Two bar charts showing projected NII changes under +/-25bps yield curve shifts (total and by currency). Bars are segmented by year (2025–2027) and by EUR, USD, and other currencies. Consistent color coding for rate directions.
Risk Assessment and Management
Financial Services
This slide analyzes Deutsche Bank’s limited net interest income (NII) sensitivity to a 25bps shift in interest rates. NII impacts range from minor (€20–25m) in 2025 to larger swings (€145m gain / €160m loss) by 2027. Sensitivity is broken down by currency, with the EUR segment showing the most variation. It demonstrates well-managed interest rate risk and minimal NII volatility for near-term years.
NII sensitivity, interest rate risk, EUR, USD, yield curve shift, risk management, financial stability
Multiple Chart
Deutsche Bank
Saved
A dark-themed slide split into two halves, one detailing businesses involved, the other outlining solutions provided by the firm, complemented by a client testimonial.
Mergers and Acquisitions
Financial Services
A case study slide showcasing how the firm’s integrated solutions across various departments contributed to a client's success story.
Case Study, Solutions, Wealth, Investment, Asset, Management, Client, Testimonial
Table
Goldman Sachs
Saved
The slide includes column charts showing adjusted net margin, gross margin, net revenues, pre-tax income, and average assets under management for wealth management and Swiss bank segments across several quarters.
Financial Performance
Financial Services
This slide provides a detailed look at net and gross margins, revenues, pre-tax income, and assets under management for wealth management and Swiss bank segments. It is used to evaluate financial performance and efficiency.
Net margin, gross margin, revenues, pre-tax income, assets, wealth management, Swiss bank, quarterly performance, financial efficiency
Multiple Chart
Credit Suisse
Saved
This slide includes a column chart comparing port costs in Australia, the US, and France, with bullet points discussing various factors affecting port costs and their implications for supply chains.
Market Analysis and Trends
Transportation & Logistics
It evaluates the direct port costs in Australia compared to the US and France, highlighting factors that influence these costs and the competitive position of Australian ports within the global market.
port costs, Australia, US, France, supply chain, comparison
Mixed Chart
LEK
Saved
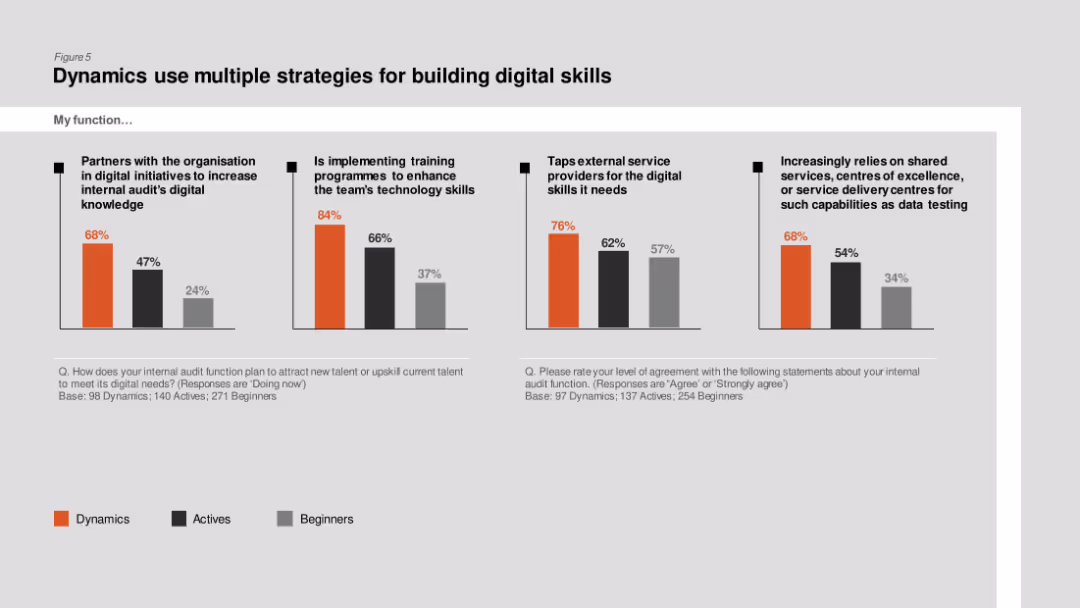
Column charts comparing strategies like partnerships, training programs, and external service providers for building digital skills among Dynamics, Actives, and Beginners.
Human Resources and Talent Management
Professional Services
The slide details various strategies used by internal audit functions to enhance digital skills, showing higher implementation of training programs and partnerships in Dynamics.
Digital skills, training programs, internal audit, partnerships, Dynamics
Multiple Chart
PwC/Strategy&
Saved
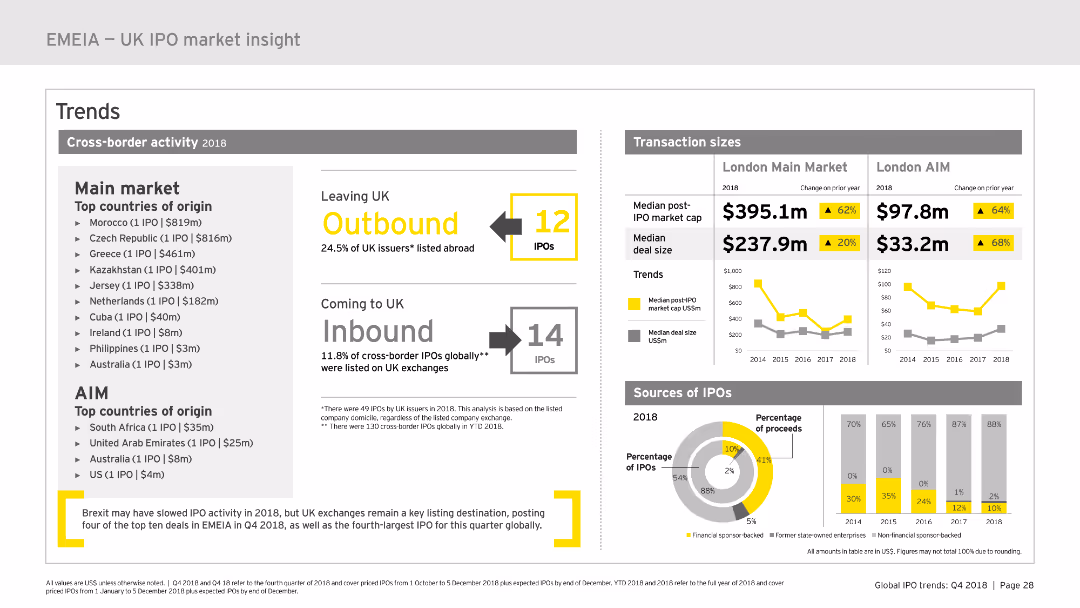
The slide features various charts including a column chart and a pie chart, highlighting cross-border IPO activity, transaction sizes, and sources of IPOs in 2018.
Market Analysis and Trends
Financial Services
Provides insights into cross-border IPO activity in the UK for 2018, highlighting outbound and inbound IPOs, transaction sizes, and IPO sources.
IPO, market cap, outbound, inbound, transaction size, median, deal size, percentage, financial services, 2018
Multiple Chart
EY
Saved
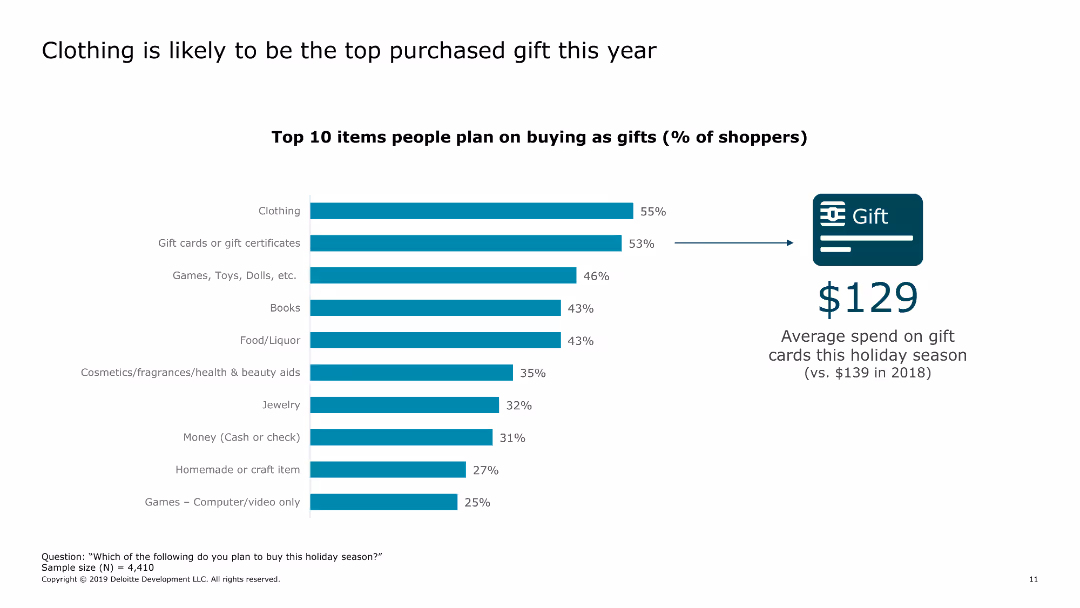
The slide presents a bar chart listing the top 10 items people plan to buy as gifts in the current year. It also shows the average spend on gift cards.
Market Analysis and Trends
Retail & E-commerce
The slide highlights the most popular gift items for the year and shows the average spend on gift cards compared to the previous year.
gifts, popular items, spending, gift cards, consumer behavior, retail, e-commerce, holiday shopping, trends, 2019
Single Chart
Deloitte
Saved
Previous
Next
If nothing, comes up, please save your slides first
Create a FREE account to continue browsing
Receive Instant Access to 1,000+ slides from companies like McKinsey, Google, and Goldman Sachs
First Name
Last Name
Email
Password
I agree to all
Terms & Privacy Policy
Thank you! Your submission has been received!
Oops! Something went wrong while submitting the form.
Have an account?
Sign in
Column Chart
Heatmap
Chevron
Org Chart
Infographic
Callouts
Timeline
List
Graphic
Picture
Process Flow
Diagram
Paragraph
Map
Table
Framework
Subtitle
Takeaway Box
Icon
Other Chart
Radar Chart
Waterfall Chart
Mekko Chart
Pie Chart
Scatter Plot
Line Chart
Bar chart
Bullet points