My Account
My Slides
Search by Category
Templates
Leave Feedback
Login
Logout
Get Started
Browse all Slides
Browse all Slides
Create a FREE Account
Instant access to 1,000+ real slides from top companies like McKinsey, BCG, Goldman Sachs, Google and many more!
First Name
Last Name
Email
Password
I agree to all
Terms & Privacy Policy
Thank you! Your submission has been received!
Oops! Something went wrong while submitting the form.
Have an account?
Sign in
Saved Slides
The slide contains two process flow diagrams, one for post-combustion and one for pre-combustion CO₂ capture systems. Each diagram uses arrows and text boxes to show process steps.
Technology and Digital Transformation
Energy & Utilities
The slide explains CO₂ capture systems divided into post-combustion and pre-combustion processes, detailing the steps and components involved in each method.
CO₂ capture, post-combustion, pre-combustion, processes, energy, utilities, gas separation, thermal power
Linear Flow
Kearney
Saved
Column and bar charts on the slide: the first shows teleworking adoption rates among DC Metro area workforce; the second details the percentage of various types of commuters who telework, each category presented with a different shade of green.
Technology and Digital Transformation
Transportation & Logistics
Analyzes teleworking trends in the DC Metro area and its adoption across different commuting modes. Highlights the integration of digital work options with public transit. Useful for studies on work habits and transport planning.
telework, workforce trends, DC Metro, public transit, digital transformation
Multiple Chart
BCG
Saved
The slide includes a column chart showing the number of CCUS projects by region and status (operational, in development, completed, cancelled).
Market Analysis and Trends
Energy & Utilities
Analyzes the status of global CCUS projects by region, focusing on OECD countries and noting a high number of project cancellations and terminations.
OECD, CCUS, project status, regional analysis, cancellations, development, operational, terminated, trends
Mixed Chart
Kearney
Saved
A process flow slide with three main sections: Objective, Feedback, and Time Frame, each represented by icons and brief descriptions.
Technology and Digital Transformation
Media & Entertainment
Outlines the objective, feedback process, and timeline for Nielsen ONE Content Alpha, focusing on client collaboration and iterative feedback.
Nielsen ONE, content, feedback, timeline, collaboration, software, versions
Pillar
Nielsen
Saved
Features dual columns with headers, column charts displaying quarterly revenues, and bullet points summarizing highlights. Design is clean with a blue and grey color scheme, promoting readability of complex data.
Risk Assessment and Management
Financial Services
This slide emphasizes stable earnings through client focus in global markets, presented with FICC and equities quarterly revenues. It's likely used for illustrating risk management effectiveness and market positioning.
global markets, FICC, equities, quarterly revenues, market share, risk management, earnings stability, revenue volatility, financial presentation, investment strategy
Multiple Chart
Goldman Sachs
Saved
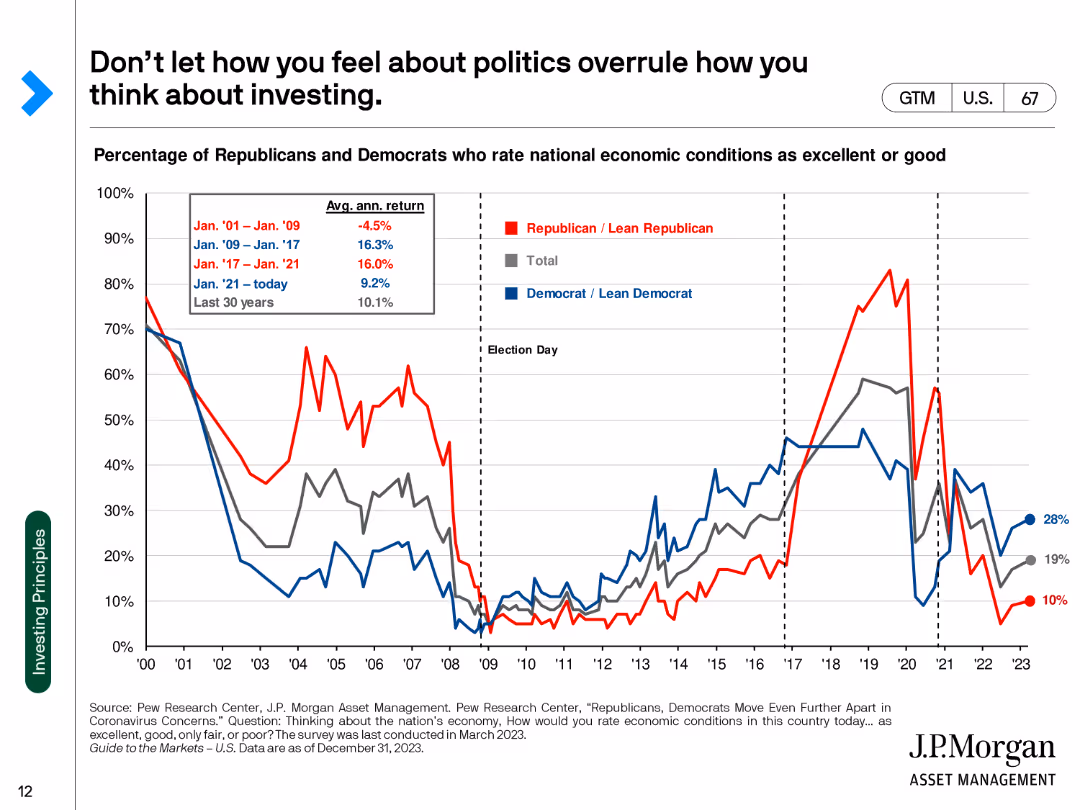
The slide contains a line chart showing the percentage of Republicans and Democrats who rate national economic conditions as excellent or good from 2000 to 2023.
Market Analysis and Trends
Financial Services
This slide analyzes the correlation between political affiliation and perception of national economic conditions, emphasizing that investment decisions should not be influenced by political biases.
Politics, Investing, Economic Conditions, Perception, Analysis
Single Chart
JP Morgan
Saved
Contains line and column charts showing the Net Interest Margin (NIM) development for Corporate and Private Banks. Includes data points over multiple quarters.
Financial Performance
Financial Services
Details trends in Net Interest Margin for Deutsche Bank's Corporate and Private Banking sectors, analyzing shifts in financial management strategies and market conditions.
NIM, banking, interest rates, financial analysis, trends
Multiple Chart
Deutsche Bank
Saved
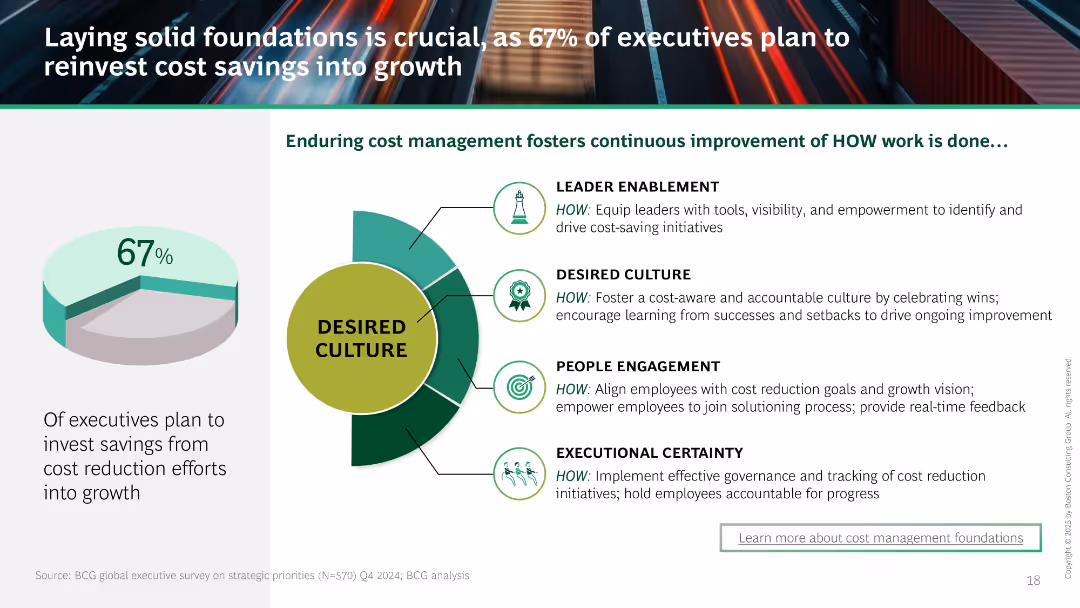
Central image of a circular “Desired Culture” model with four action areas. Left shows pie chart (67% reinvestment). Structured to show how continuous improvement enables reinvestment.
Strategic Planning
Professional Services
Describes how cost savings can be reinvested if companies cultivate a culture focused on leader enablement, accountability, and employee engagement. Positions cultural foundations as key to sustaining cost management.
cost savings, culture, reinvestment, leadership, employee engagement, continuous improvement, governance
Mixed Chart
BCG
Saved
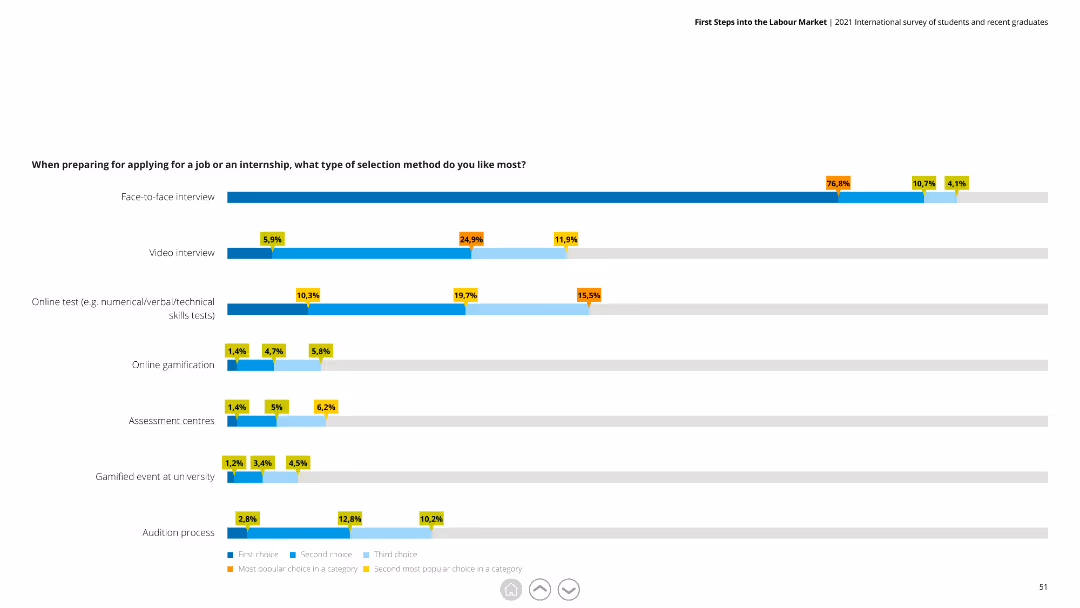
This slide features a horizontal bar chart with data on preferred job application selection methods, including face-to-face interviews and online tests.
Market Analysis and Trends
Professional Services
The slide details preferences for different job selection methods, showing face-to-face interviews as the most favored. It helps in understanding recruitment preferences.
Job applications, selection methods, survey, interviews, recruitment
Single Chart
Deloitte
Saved
Features a projection column chart from 2022 to 2025 with strategic growth measures listed beside it. The slide uses a simple, clean design with blue and white tones.
Investment Analysis
Financial Services
Projects future revenue targets for Deutsche Bank, detailing strategic initiatives across various divisions to drive growth.
Revenue, projections, Deutsche Bank, strategy, growth, 2025, financial targets, divisions
Mixed Chart
Deutsche Bank
Saved
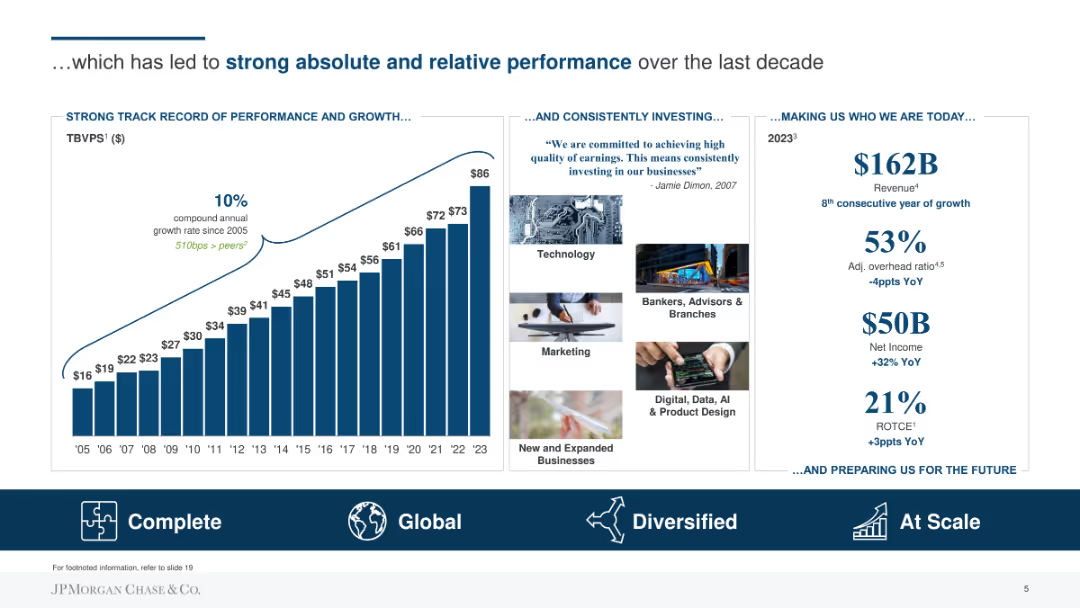
Column chart showing historical TBVPS growth with key performance indicators and future growth commitments on the right.
Performance Metrics and KPIs
Financial Services
Highlights the company's track record of performance and growth, including historical TBVPS growth and future investment commitments to maintain this trend.
performance, growth, TBVPS, investment, commitments, historical data
Mixed Chart
JP Morgan
Saved
Dark background with column charts. Text on the right discussing platform strategy considerations
Competitive Landscape
Professional Services
It outlines the increased partnership formation among platform adopters and criteria for platform strategy
Partnerships, Strategy, Market Dynamics, Technology, Ecosystem
Mixed Chart
Accenture
Saved
The slide includes large numerical data, icons representing different segments of the asset management division, and a background image of industrial equipment.
Investment Analysis
Financial Services
Details the financial performance and asset management capabilities of Macquarie, including FY19 net profit and assets under management, relevant for investment analysis and company profiling.
asset management, AUM, net profit, investment, MIRA, MIM, performance
Mixed Chart
Goldman Sachs
Saved
A structured layout with four numbered sections, each comprising bold headings and subtext. The sections are neatly arranged and use contrasting colors for readability. No charts or images are present.
Market Analysis and Trends
Technology & Software
Provides a glimpse into the future of digital commerce, detailing the norms of digital merchants. This slide is informative for discussions on the evolution of e-commerce and business strategies.
Digital Merchant, 2030, SEA, Online, Digital Payment, BNPL, Digital Tools, Operational Efficiency
Linear Flow
Bain
Saved
The slide features a line chart comparing the likelihood of listing investment properties for sale from Fall 2018 to Fall 2020.
Market Analysis and Trends
Real Estate & Construction
This slide presents data on the likelihood of investment property owners listing their properties for sale, comparing trends over three years.
property sale, market trends, investment, likelihood, line chart, historical data, real estate
Single Chart
IPSOS
Saved
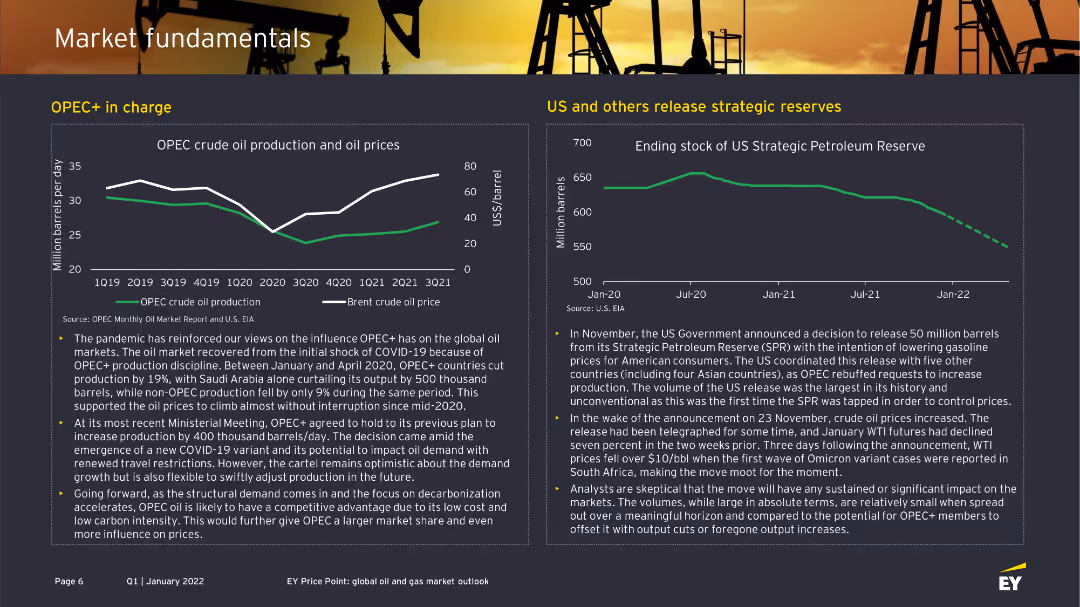
The slide is split into two main sections: one with a line chart showing OPEC crude oil production and oil prices, and the other with a line chart showing the US Strategic Petroleum Reserve. Descriptive text supports each chart.
Market Analysis and Trends
Energy & Utilities
This slide explores the influence of OPEC+ on global oil production and prices, and the US's release of its Strategic Petroleum Reserve. It discusses production cuts and the strategic reserve's impact on the market.
OPEC+, oil production, strategic reserve, US, prices
Multiple Chart
EY
Saved
This slide utilizes a combination of horizontal bar charts to show confidence levels in the ability to buy and sell various assets, including crypto assets, in the future, with detailed percentages.
Market Analysis and Trends
Financial Services
It explores the confidence of Canadians in their ability to buy and sell different types of assets, such as the US dollar, Canadian dollar, mutual funds, and crypto assets, with detailed confidence levels.
confidence, buy/sell, future, assets, percentages
Mixed Chart
IPSOS
Saved
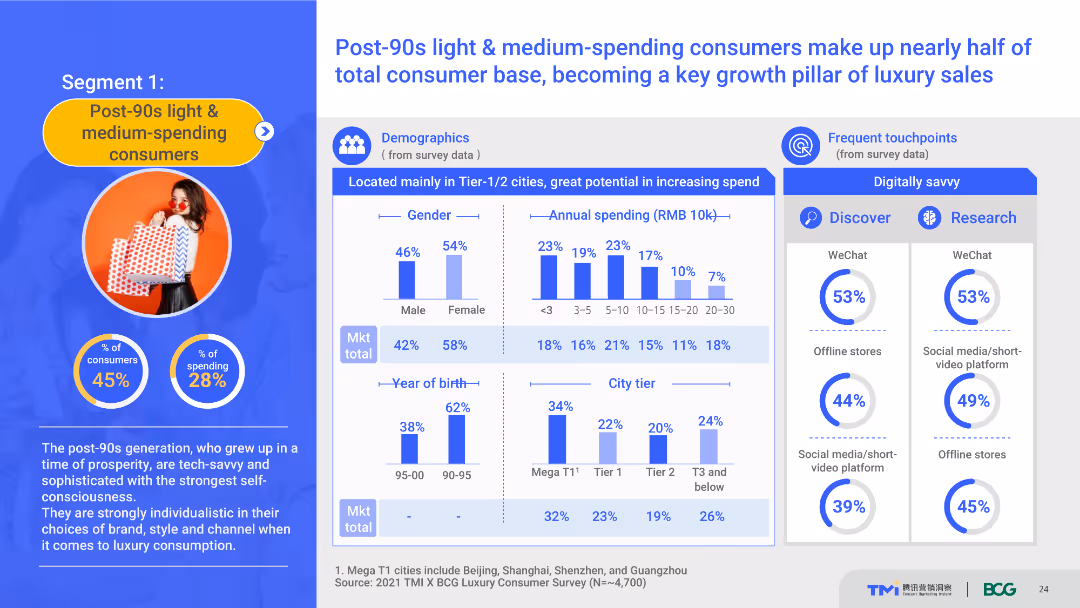
The slide uses a content layout with demographic charts, spending data, and touchpoint information. It details the demographics and spending behavior of post-90s light & medium-spending consumers, highlighting their role in luxury sales growth. The visual complexity is moderate, with well-organized sections.
Customer and Market Segmentation
Consumer Goods
This slide provides a detailed profile of post-90s light and medium-spending consumers, including demographics, spending habits, and preferred touchpoints. It emphasizes their importance in driving luxury sales growth.
post-90s consumers, demographics, spending behavior, luxury market, touchpoints
Multiple Chart
BCG
Saved
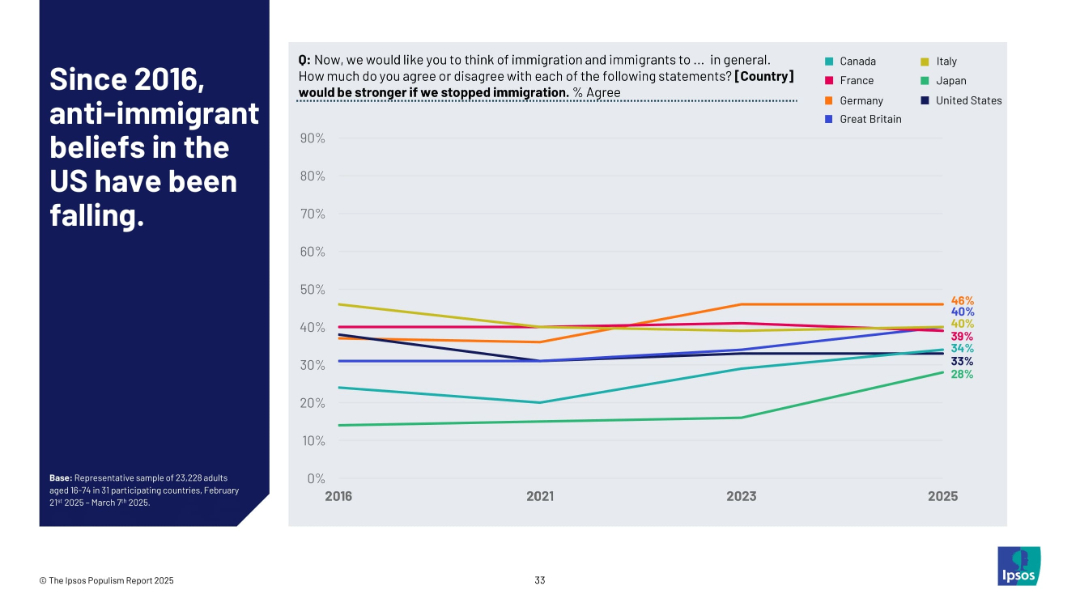
Split slide with left-aligned title text and a line graph tracking belief trends about immigration across selected countries from 2016–2025.
Market Analysis and Trends
Government & Public Sector
The chart shows how belief in the idea that a country would be stronger without immigration has shifted. It highlights a notable decline in anti-immigrant sentiment in the U.S. over time, with Japan showing a recent rise.
immigration, anti-immigration, United States, trend, public opinion, Ipsos, belief decline, 2025, policy attitude
Mixed Chart
IPSOS
Saved
Bar charts displaying U.S. employment and revenue by sector during COVID-19, segmented by contact intensity and susceptibility to lockdown measures.
Market Analysis and Trends
Professional Services
Examines the impact of COVID-19 on various U.S. economic sectors, offering insights into employment and revenue changes under different restrictions.
COVID-19, economic sectors, employment, revenue, U.S., impact analysis, lockdown, sector analysis
Multiple Chart
BCG
Saved
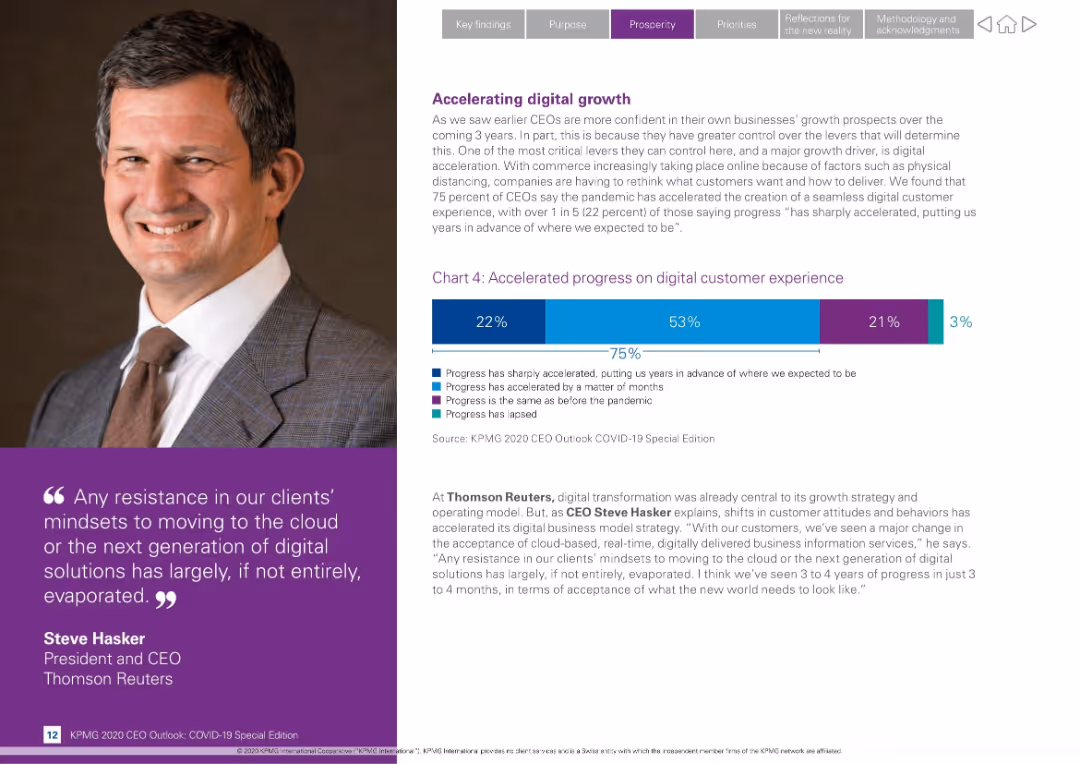
Split layout with CEO photo left, bar chart and narrative on right; features quote and digital transformation stats
Technology and Digital Transformation
Technology & Software
Highlights how the pandemic has accelerated digital transformation, especially customer experience. 75% of CEOs say progress accelerated; includes quote from Steve Hasker of Thomson Reuters on cloud adoption.
digital growth, transformation, customer experience, Steve Hasker, COVID-19, technology, progress acceleration, cloud adoption, KPMG
Mixed Chart
KPMG
Saved
This slide includes a central diagram depicting three interconnected cycles labeled as Inner Loop, Huddle, and Outer Loop, surrounded by various process steps and feedback loops.
Organizational Structure and Change
Professional Services
Describes the feedback and process improvement cycles within a business context. Useful for understanding organizational dynamics and improving customer service efficiency.
process improvement, customer service, feedback loops, organizational dynamics, business efficiency
Diagram
Bain
Saved
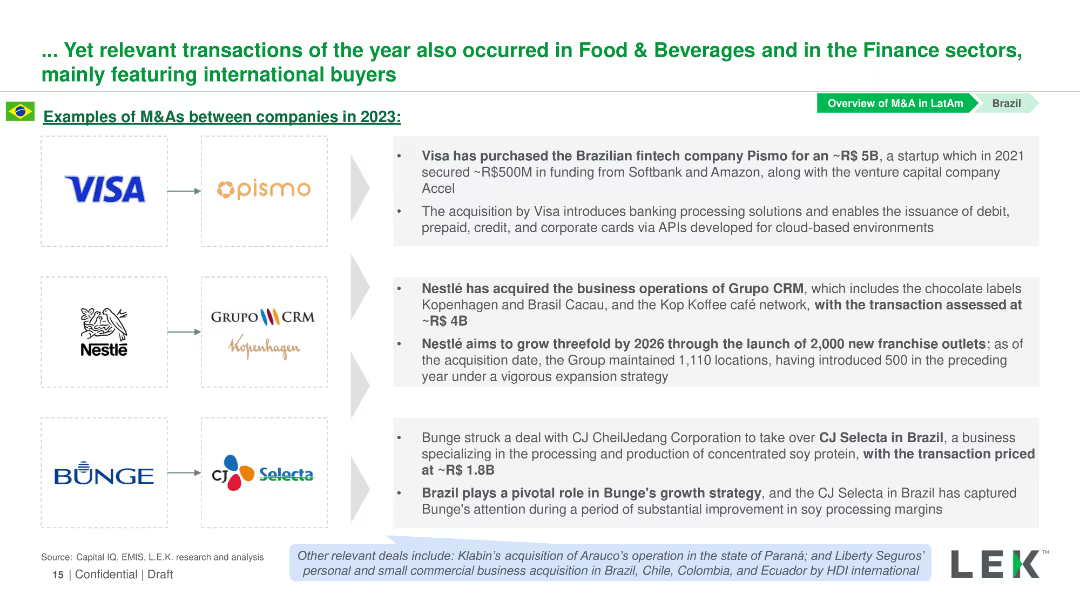
Contains logos of companies involved in M&A deals in 2023, with text descriptions next to each logo detailing the transactions.
Mergers and Acquisitions
Financial Services
Highlights significant M&A transactions in Brazil’s Food & Beverages and Finance sectors, listing the companies involved and details of each deal.
M&A, Brazil, Finance, Food & Beverages, Transactions
Table
LEK
Saved
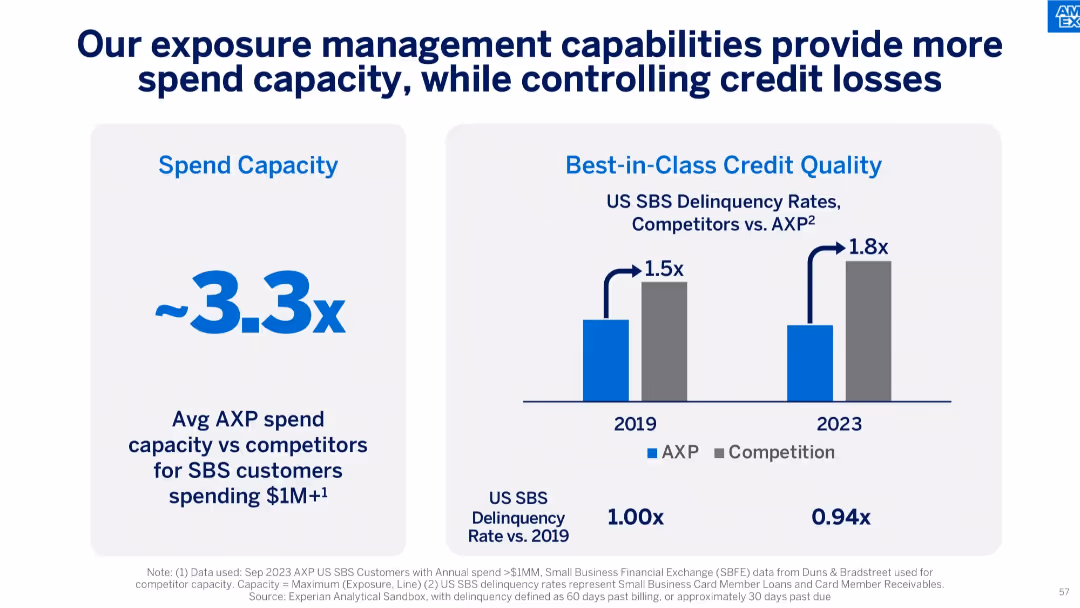
Two-panel layout: left shows 3.3x spend capacity advantage, right shows comparative delinquency rates between AXP and competitors for 2019 and 2023.
Risk Assessment and Management
Financial Services
This slide highlights AXP’s superior exposure management capabilities, offering higher spend capacity while maintaining industry-leading low delinquency rates, enhancing both growth and risk control.
credit risk, delinquency, spend capacity, AXP, exposure management, small business, financial discipline
Mixed Chart
McKinsey
Saved
A column chart displaying priorities in operational strategies using yellow to color up its bars.
Strategic Planning
Financial Services
This slide outlines CEOs' strategies for revenue growth, focusing on operational efficiencies and organic growth. Suitable for strategic planning and operational management discussions.
Revenue Growth, CEOs, Strategy, Operational Efficiency, Organic Growth, Planning
Mixed Chart
PwC/Strategy&
Saved
Previous
Next
If nothing, comes up, please save your slides first
Create a FREE account to continue browsing
Receive Instant Access to 1,000+ slides from companies like McKinsey, Google, and Goldman Sachs
First Name
Last Name
Email
Password
I agree to all
Terms & Privacy Policy
Thank you! Your submission has been received!
Oops! Something went wrong while submitting the form.
Have an account?
Sign in
Column Chart
Heatmap
Chevron
Org Chart
Infographic
Callouts
Timeline
List
Graphic
Picture
Process Flow
Diagram
Paragraph
Map
Table
Framework
Subtitle
Takeaway Box
Icon
Other Chart
Radar Chart
Waterfall Chart
Mekko Chart
Pie Chart
Scatter Plot
Line Chart
Bar chart
Bullet points