My Account
My Slides
Search by Category
Templates
Leave Feedback
Login
Logout
Get Started
Browse all Slides
Browse all Slides
Create a FREE Account
Instant access to 1,000+ real slides from top companies like McKinsey, BCG, Goldman Sachs, Google and many more!
First Name
Last Name
Email
Password
I agree to all
Terms & Privacy Policy
Thank you! Your submission has been received!
Oops! Something went wrong while submitting the form.
Have an account?
Sign in
Saved Slides
This slide has a central Goldman Sachs logo with surrounding text describing different roles such as "Investor," "Business," "Operator," "Issuer," and "Employer." The layout is organized with clear, readable segments.
Strategic Planning
Government & Public Sector
It explains the role of Goldman Sachs' Sustainable Finance Group in mobilizing expertise to address clients' ESG needs. The slide is pertinent for discussing strategic planning and commercial opportunities within sustainable finance, detailing how the firm engages with various stakeholders.
ESG, sustainable finance, Goldman Sachs, strategic planning, expertise
Framework
Goldman Sachs
Saved
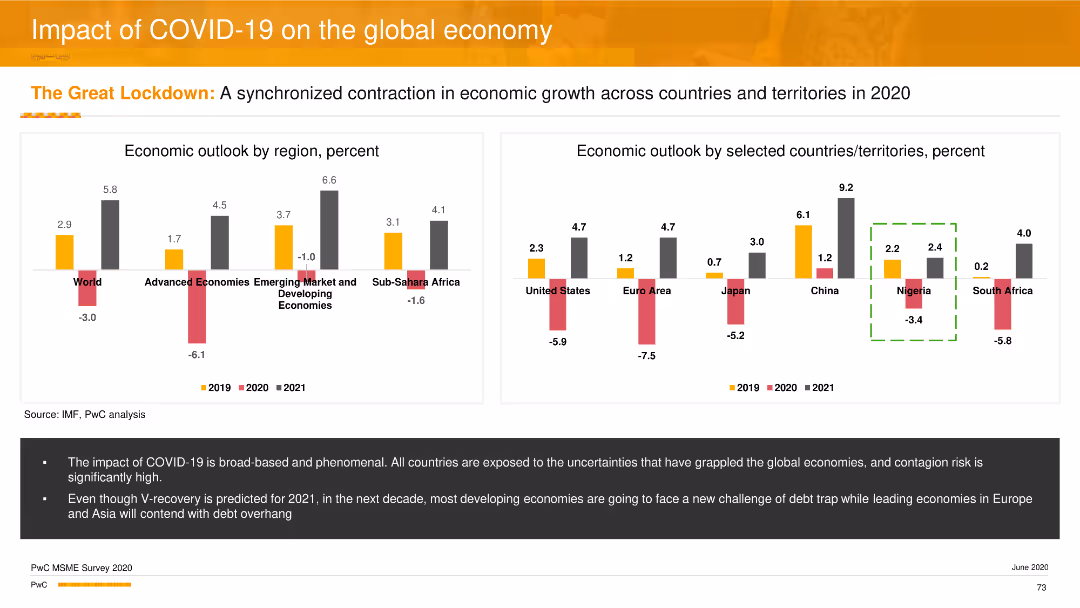
Two column charts showing the economic outlook by region and by selected countries for 2019, 2020, and 2021, highlighting the contraction due to COVID-19. Orange, grey, and black bars represent different years.
Risk Assessment and Management
Professional Services
This slide assesses the economic impact of COVID-19 globally, showing a synchronized contraction in economic growth across various regions and countries, with predictions for recovery in 2021.
COVID-19 impact, economic outlook, global economy, professional services, column chart
Multiple Chart
PwC/Strategy&
Saved
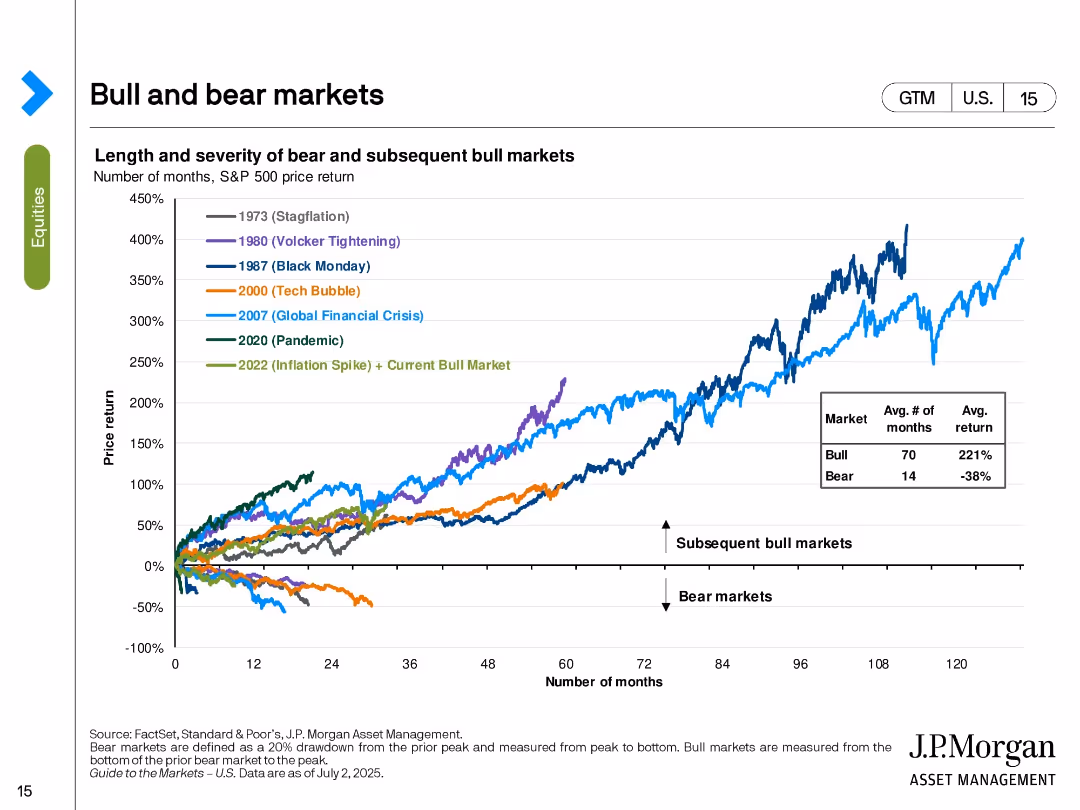
Line chart tracking the S&P 500’s performance in various historical bull and bear markets. Color-coded by major economic events.
Strategic Planning
Financial Services
The slide shows the price return trajectories of the S&P 500 in different market cycles including stagflation, tech bubble, GFC, and pandemic. It contrasts the length and return of bear vs. bull markets, with bull markets averaging 70 months and 221% return. The current bull market (since 2022) is included.
bull markets, bear markets, S&P 500, historical returns, market cycles, investment strategy, macroeconomic events, recovery
Single Chart
JP Morgan
Saved
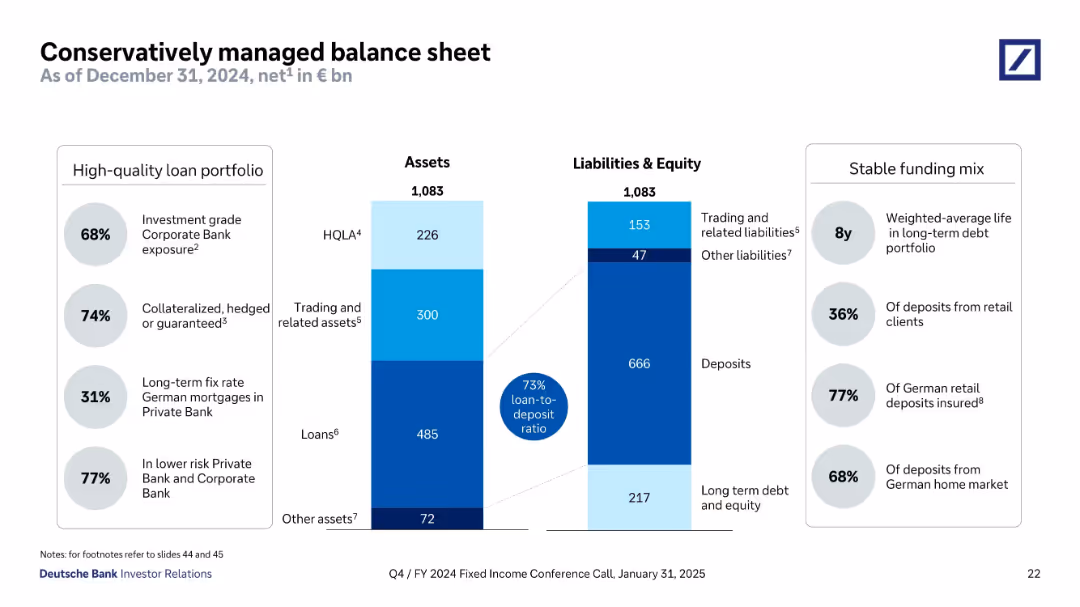
Split panel design showing assets and liabilities side-by-side using stacked bar formats. Flanked by callout bubbles for metrics (loan-to-deposit, quality, maturity). Structured with clean lines and shaded color segments.
Operational Efficiency
Financial Services
This slide provides a breakdown of Deutsche Bank’s assets and liabilities as of December 2024, showcasing a conservative balance sheet. Key data include 73% loan-to-deposit ratio, long average debt maturity, and high levels of investment-grade and collateralized loans. It underscores stability, funding quality, and prudent risk management.
balance sheet, assets, liabilities, loan-to-deposit, collateralized loans, HQLA, long-term debt, Deutsche Bank
Mixed Chart
Deutsche Bank
Saved
Dominated by graphical data, this slide displays two main charts: the Eurozone real GDP forecast and the Eurocoin index, represented by bars and dots respectively. Text is limited, providing only sources and brief descriptions. The color palette includes shades of blue, black, and white. The slide design is clear, with each chart labeled and axis demarcated, promoting easy data interpretation.
Market Analysis and Trends
Financial Services
The slide illustrates IMF's economic forecasts and the Eurozone Eurocoin index, comparing them against other projections and historical data. It's typically used in economic or financial presentations to analyze trends, guide investment decisions, or provide economic forecasts.
IMF, GDP forecast, Eurozone, Eurocoin index, economic indicators
Multiple Chart
McKinsey
Saved
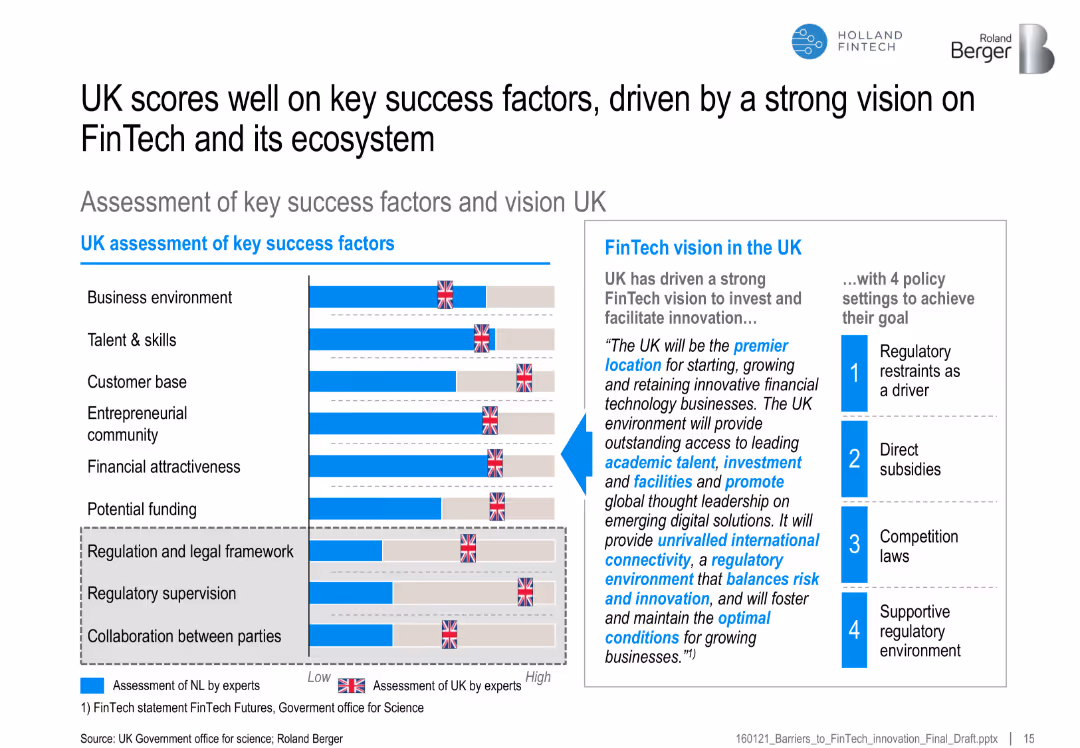
Bar chart of UK vs. benchmark on FinTech success factors, with a vision statement and four supporting policy actions
Strategic Planning
Financial Services
Highlights the UK’s strong performance across FinTech-enabling factors, backed by a clear vision and regulatory framework, promoting its position as a FinTech hub.
UK FinTech, ecosystem, regulatory vision, success factors, funding, policy, entrepreneurship, talent
Mixed Chart
Roland Berger
Saved
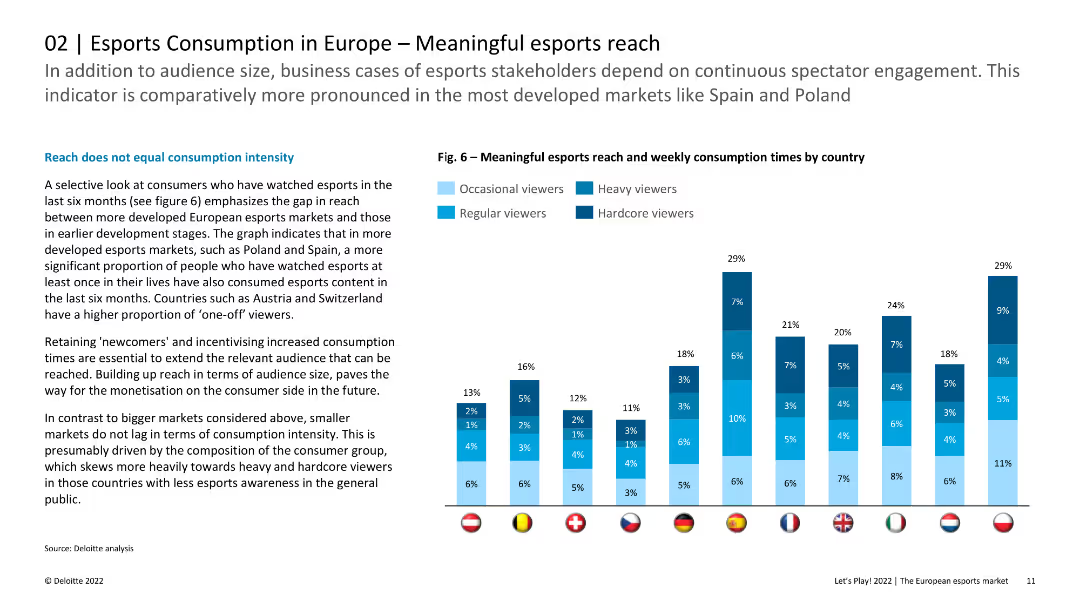
The slide includes a column chart illustrating meaningful esports reach and weekly consumption times by country. The layout is informative with clear data presentation.
Market Analysis and Trends
Media & Entertainment
The slide analyzes the reach of esports content in Europe, emphasizing that larger markets show higher consumption intensity. It highlights the importance of retaining new viewers and incentivizing increased consumption times for monetization.
Esports, Reach, Consumption, Europe, Audience
Mixed Chart
Deloitte
Saved
The slide features a column chart showing the number of countries supporting hydrogen initiatives in various sectors like transportation, refueling stations, buses, and trucks.
Regulatory and Compliance
Energy & Utilities
Highlights global initiatives supporting hydrogen deployment across different sectors, emphasizing the number of countries involved in each initiative.
Hydrogen, support initiatives, countries, deployment, transportation, refueling, buses, trucks
Single Chart
Kearney
Saved
Bar graphs with trend lines show the deal value and number of deals in the technology venture investing market by region from 2011 to 2017, with color differentiation for regions.
Market Analysis and Trends
Technology & Software
Analyzing global technology venture investing, this slide compares regional deal values and numbers, highlighting the continued growth against a backdrop of contracting deal numbers. It is useful for regional market analysis.
Venture, Technology, Global, Region, Market Analysis
Multiple Chart
Oliver Wyman
Saved
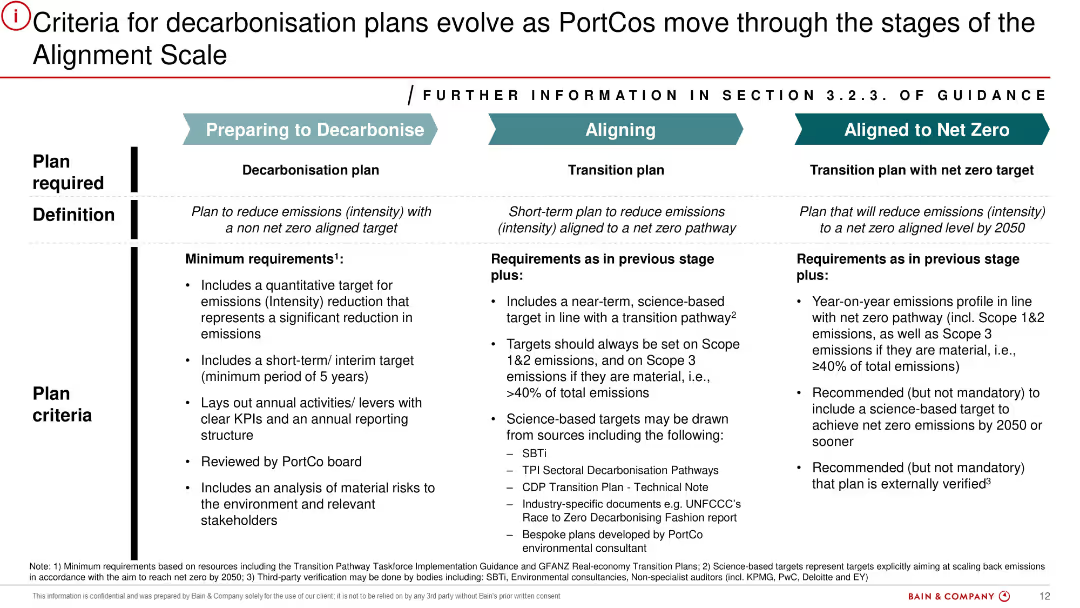
Three-column structured slide with vertical dividers and horizontal row labels. Each column corresponds to a decarbonisation stage: Preparing to Decarbonise, Aligning, Aligned to Net Zero. Includes detailed bullets under “Definition” and “Plan Criteria”. Color-coded headers for clarity.
Strategic Planning
Financial Services
Outlines progressive criteria for PortCos (portfolio companies) to qualify for decarbonisation plan classifications. It defines each stage and sets minimum requirements like emissions targets, science-based alignment, and board review. The goal is to help firms advance towards net-zero emissions through structured guidance.
decarbonisation, net zero, emissions, PortCo, strategic planning, KPI, transition, sustainability, compliance, board review
Table
Bain
Saved
Contains bar charts showing disparities between gender in workplace satisfaction and promotion rates.
Human Resources and Talent Management
Professional Services
Examines gender disparities in workplace outcomes, crucial for developing diversity and inclusion policies.
Gender Disparity, Workplace Equality, HR Practices, Diversity Policies, Inclusion Strategies
Single Chart
PwC/Strategy&
Saved
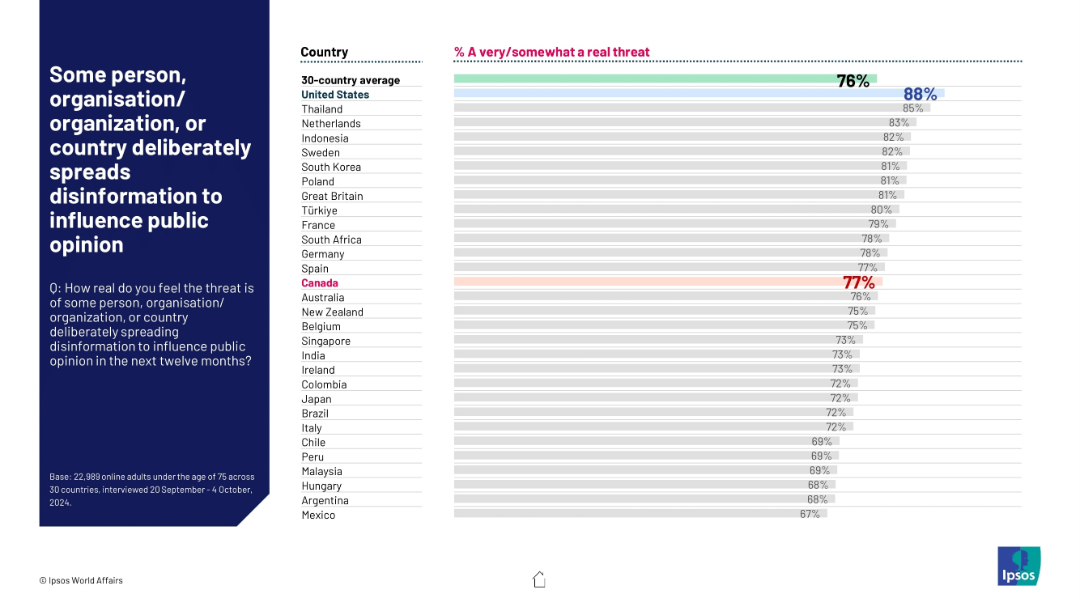
Horizontal bar chart by country with strong pink title emphasis; percentage agreement shown; global average marked.
Risk Assessment and Management
Government & Public Sector
This slide captures public concern about disinformation campaigns. 76% globally see this as a real threat. The United States tops the list at 88%, followed closely by Thailand and the Netherlands. Canada is highlighted at 77%, indicating high awareness across regions.
disinformation, media trust, public opinion, misinformation, perception, security threat, Ipsos, global survey, political influence, digital risk
Mixed Chart
IPSOS
Saved
Column chart comparing the proportion of prominent and practical green consumers in different regions: APAC, LATAM, MEA.
Customer and Market Segmentation
Consumer Goods
The slide presents data on the prevalence of prominent versus practical green consumers across various regions, suggesting market strategies.
green consumers, APAC, LATAM, MEA, market strategy, segmentation, consumer behavior
Mixed Chart
Accenture
Saved
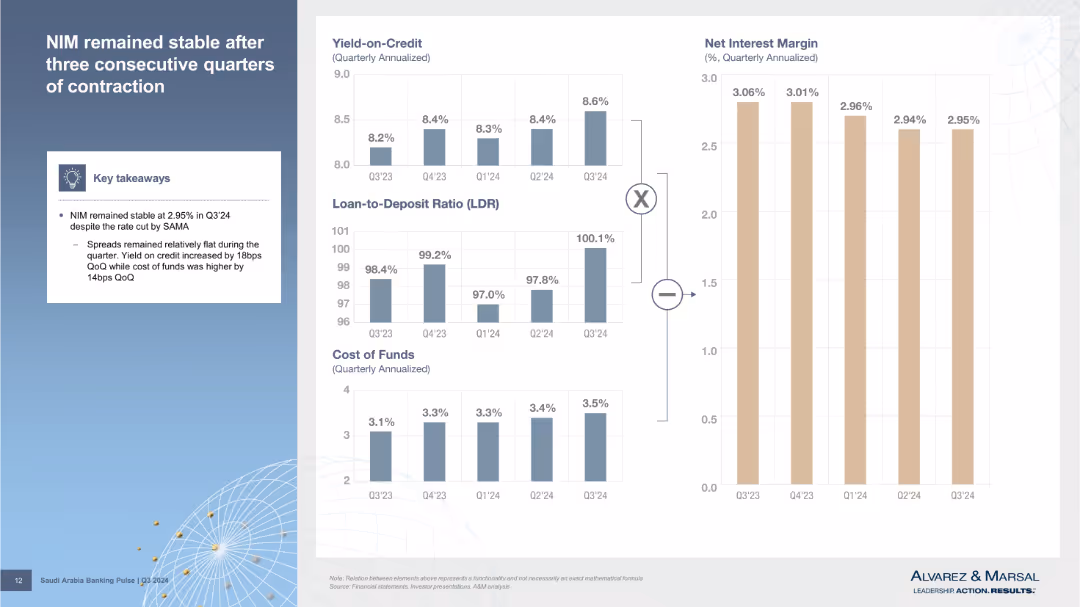
Left column features key takeaways; right contains small stacked bar charts for yield on credit, LDR, CoF, and NIM trends. Clean, modular layout.
Performance Metrics and KPIs
Financial Services
Discusses Net Interest Margin (NIM) stability in Q3’24. Shows relationships between yield on credit, loan-to-deposit ratio, and cost of funds using visual breakdowns.
NIM, yield, cost of funds, LDR, interest margin, Q3’24, SAMA, bank metrics, credit spreads
Multiple Chart
Alvarez & Marsal
Saved
The slide features a column chart, a table, and color-coded timelines.
Investment Analysis
Financial Services
The slide presents the history and innovation in investment types over time with a focus on alternatives. It includes historical timelines, net IRR percentages, and growth in asset mix.
Alternatives, Investment, Growth, IRR, Timeline
Mixed Chart
JP Morgan
Saved
Features four circular icons representing different actions (CEO and board engagement, employee and stakeholder engagement, performance measures, and cultural integration), each with a brief descriptor.
Organizational Structure and Change
Professional Services
This slide outlines four critical actions to successfully integrate sustainability into a company’s core strategy, emphasizing the roles of leadership, employee engagement, performance metrics, and cultural adaptation to embed sustainability deeply within organizational practices.
Leadership, Sustainability, Engagement, Performance Metrics, Organizational Culture
Pillar
McKinsey
Saved
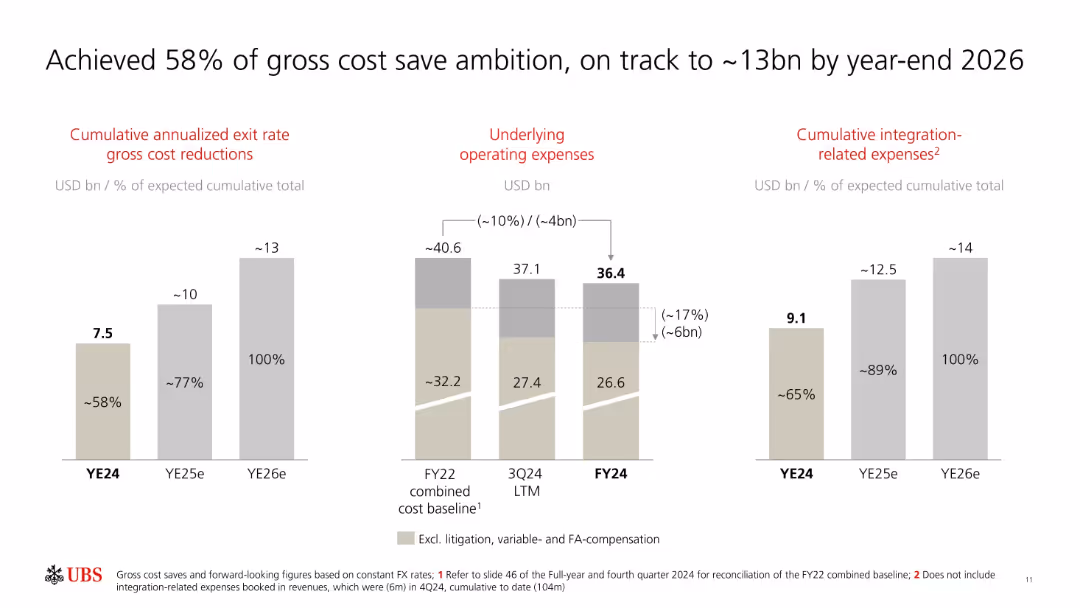
Three sets of vertical bar charts for cumulative cost savings, operating expenses, and integration-related costs. Data is shown by year.
Operational Efficiency
Financial Services
UBS reports achieving 58% of its cost save target by YE24 and projects reaching 13bn in savings by YE26. The slide details declines in operating expenses and outlines cumulative integration costs.
UBS, cost savings, integration, operating expenses, YE24, YE26, targets, financial strategy, efficiency
Multiple Chart
UBS
Saved
The slide contains text and bar charts analyzing the impact of ESG commitments on business operations and the prevalence of corporate greenwashing.
Regulatory and Compliance
Environmental Services & Sustainability
Discusses the importance of ESG (Environmental, Social, and Governance) performance, its impact on business operations, and the risks of corporate greenwashing.
ESG, corporate responsibility, greenwashing, business impact, regulatory compliance
Multiple Chart
IPSOS
Saved
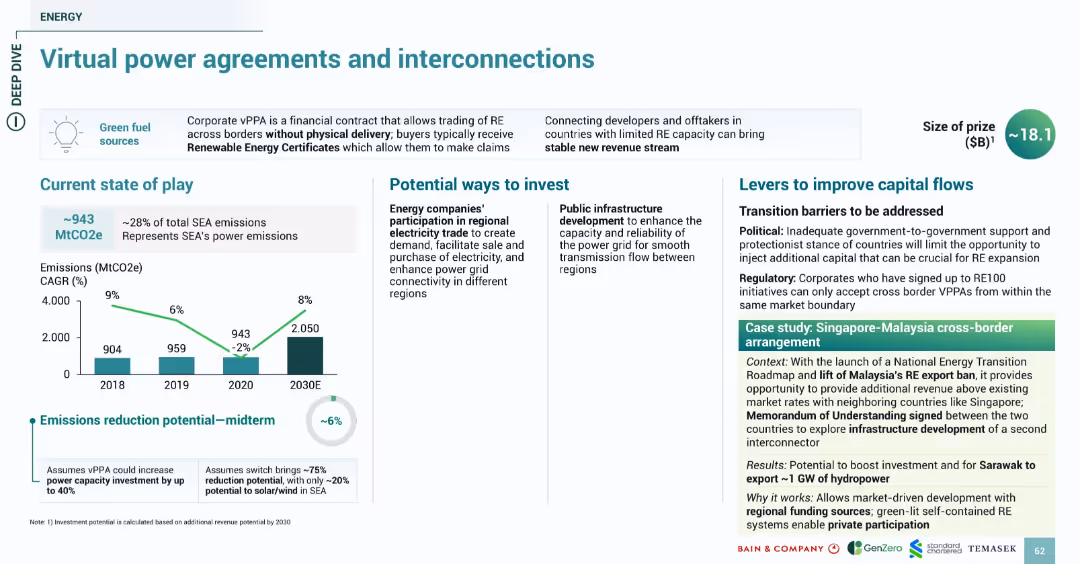
Includes emissions chart, bullet-pointed content blocks, and case study highlighting cross-border collaboration. Designed with a clean, organized layout using teal and white space.
Market Analysis and Trends
Energy & Utilities
Describes the role of virtual power purchase agreements (vPPAs) in facilitating renewable energy adoption through cross-border deals. Emissions reduction potential is estimated at 6%. Investment suggestions include regional electricity trade participation and public infrastructure development. The Singapore-Malaysia cross-border agreement is highlighted as a model for grid-linked expansion.
vPPA, interconnection, cross-border, RE, emissions, SEA, grid, Singapore, Malaysia
Multiple Chart
Bain
Saved
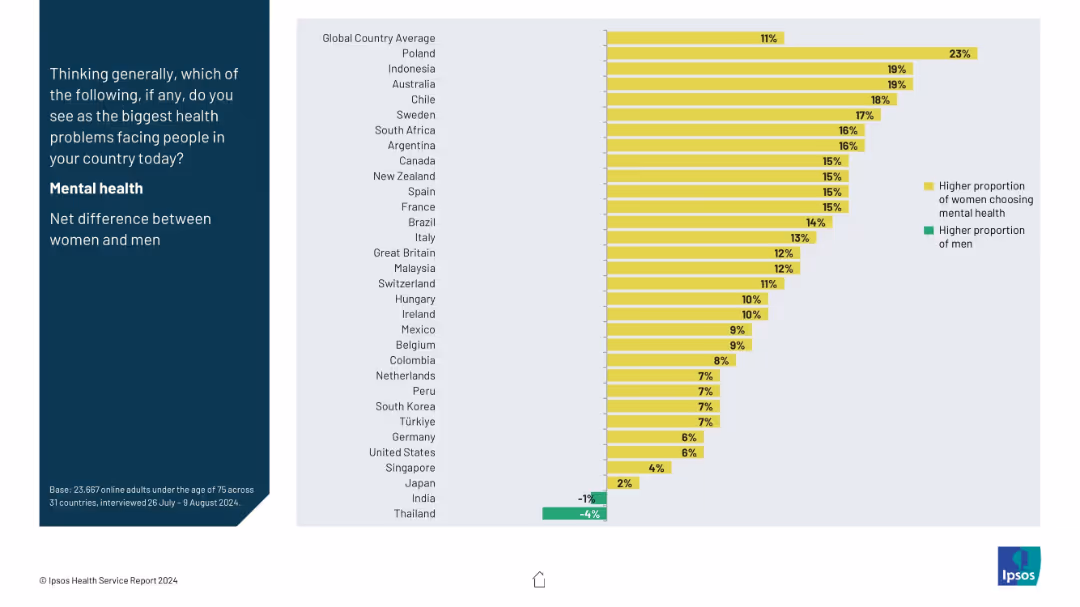
Split-panel layout with a vertical question prompt on the left in a dark blue block, and a horizontal bar chart on the right side using yellow and green bars.
Market Analysis and Trends
Healthcare & Pharmaceuticals
This slide shows the gender-based net difference in selecting mental health as the biggest health concern across countries. Yellow bars represent higher female concern, while green shows male. Poland leads with the highest female-male gap, while Thailand has a higher male concern rate.
mental health, gender gap, health perception, global comparison, survey
Mixed Chart
IPSOS
Saved
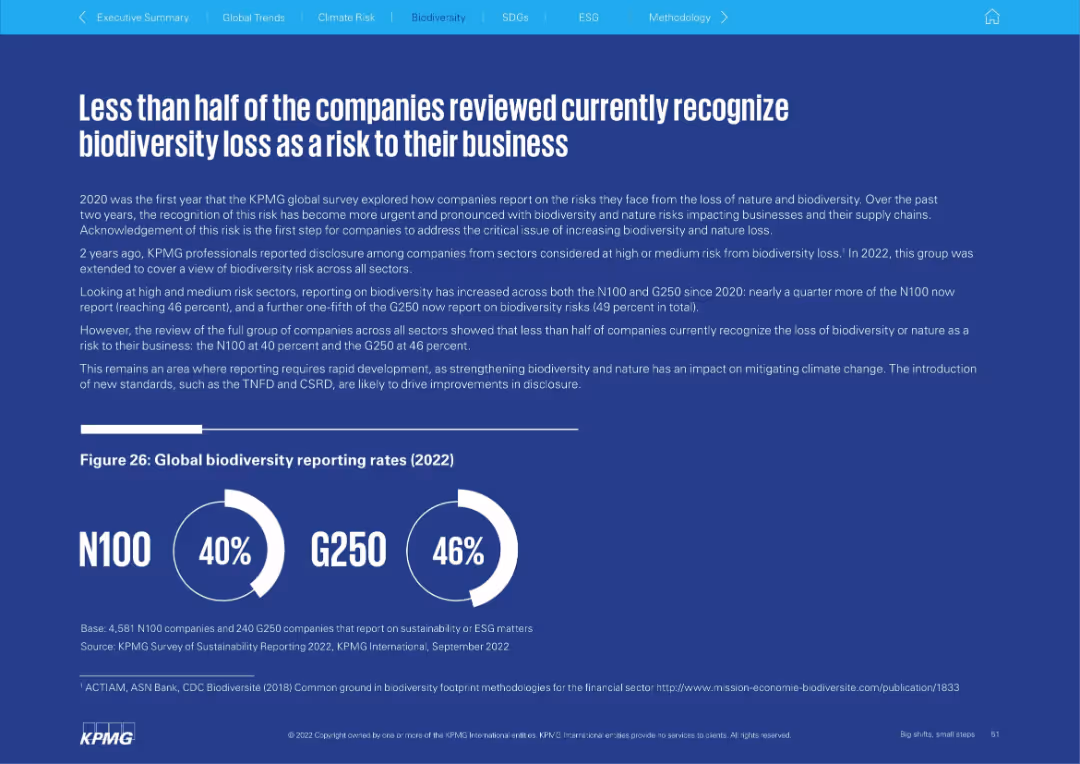
Solid blue background with left-aligned narrative and circular infographic showing biodiversity reporting rates for N100 and G250 in 2022.
Risk Assessment and Management
Environmental Services & Sustainability
The slide discusses how under half of surveyed companies recognize biodiversity loss as a business risk, despite rising urgency. It reports increased biodiversity disclosure in recent years but emphasizes the need for greater recognition and action across sectors.
biodiversity, risk management, disclosure, ESG, sustainability, N100
Mixed Chart
KPMG
Saved
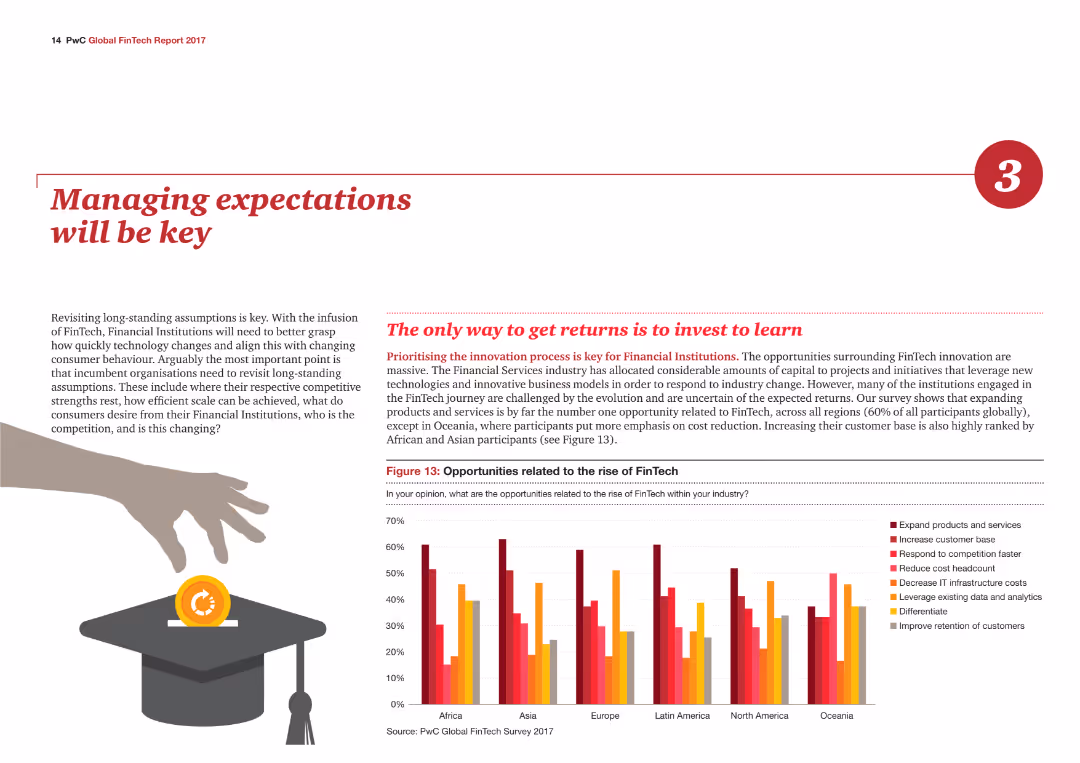
The slide contains a column chart illustrating opportunities related to the rise of FinTech by region, with different colors representing various opportunities such as expanding products.
Strategic Planning
Financial Services
The slide emphasizes the importance of managing expectations in the financial services industry, highlighting key opportunities related to FinTech across different regions.
Expectations, FinTech, Opportunities, Regions, Strategic
Mixed Chart
PwC/Strategy&
Saved
This slide features a complex line chart with multiple data series. It includes annotations and colored markers to indicate specific data points. The layout is dense with significant textual information on the right side.
Strategic Planning
Professional Services
The slide analyzes differences in focus on diversity targets among different groups within HR, emphasizing gaps in initiatives.
diversity, inclusion, HR, data analysis, line chart, gender gap, organizational focus, disparities
Single Chart
Accenture
Saved
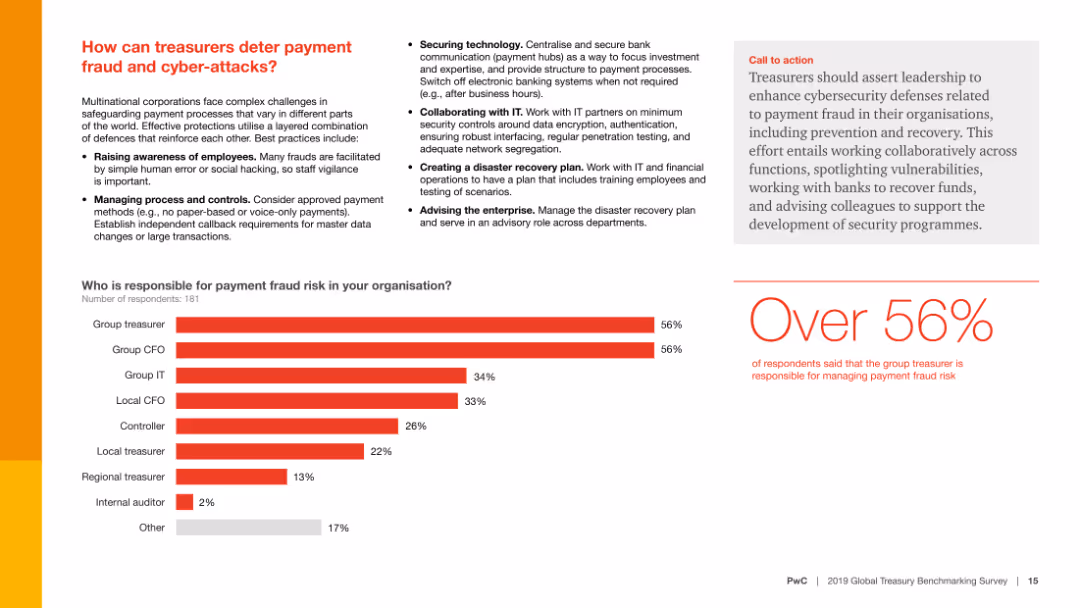
Contains text, a column chart, and a call-to-action section. The column chart shows who is responsible for managing payment fraud risk.
Risk Assessment and Management
Financial Services
This slide presents strategies for preventing payment fraud and cyber-attacks and identifies who within an organization is responsible for managing these risks.
Fraud prevention, cyber-attacks, risk management, survey, responsibility
Mixed Chart
PwC/Strategy&
Saved
The slide includes text descriptions of positive and negative power control opportunities, supported by two bar charts showing power output from TAC and renewable sources.
Financial Performance
Energy & Utilities
This slide explores monetization opportunities for hydrogen producers by providing grid services. It details positive and negative power control scenarios and discusses how these services can reduce the Levelized Cost of Hydrogen (LCOH).
H2 producer, monetization, power control, LCOH, grid services
Multiple Chart
Kearney
Saved
Previous
Next
If nothing, comes up, please save your slides first
Create a FREE account to continue browsing
Receive Instant Access to 1,000+ slides from companies like McKinsey, Google, and Goldman Sachs
First Name
Last Name
Email
Password
I agree to all
Terms & Privacy Policy
Thank you! Your submission has been received!
Oops! Something went wrong while submitting the form.
Have an account?
Sign in
Column Chart
Heatmap
Chevron
Org Chart
Infographic
Callouts
Timeline
List
Graphic
Picture
Process Flow
Diagram
Paragraph
Map
Table
Framework
Subtitle
Takeaway Box
Icon
Other Chart
Radar Chart
Waterfall Chart
Mekko Chart
Pie Chart
Scatter Plot
Line Chart
Bar chart
Bullet points