My Account
My Slides
Search by Category
Templates
Leave Feedback
Login
Logout
Get Started
Browse all Slides
Browse all Slides
Create a FREE Account
Instant access to 1,000+ real slides from top companies like McKinsey, BCG, Goldman Sachs, Google and many more!
First Name
Last Name
Email
Password
I agree to all
Terms & Privacy Policy
Thank you! Your submission has been received!
Oops! Something went wrong while submitting the form.
Have an account?
Sign in
Saved Slides
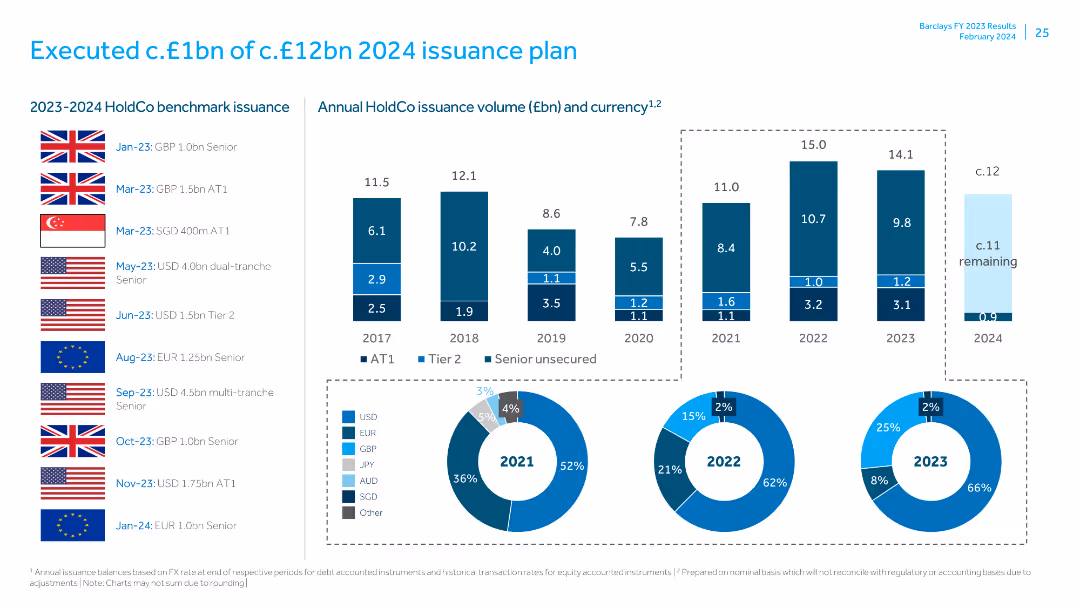
Features flags and column charts showing HoldCo benchmark issuance volumes and currency distribution for different years.
Financial Performance
Financial Services
Reviews the progress and details of the HoldCo issuance plan, including executed and remaining issuance volumes, and the distribution across different currencies.
issuance plan, HoldCo, financial performance, benchmark issuance, currency distribution, annual issuance, financial review, executed issuance, remaining issuance, financial planning
Multiple Chart
Barclays
Saved
The slide includes two column charts comparing managers' and investors' preferences for the frequency of private investment valuations. The left side features an image of professionals discussing work.
Investment Analysis
Financial Services
Discusses differences between managers and investors on how often private investment valuations should be performed, highlighting monthly, quarterly, semiannual, and annual preferences.
investment, valuation, managers, investors, frequency, private equity, venture capital, preferences, hedge funds, analysis
Mixed Chart
EY
Saved
This slide presents a column chart showing the number of truck drivers and road freight demand over several years. Bullet points provide insights into driver shortages and their impacts on costs.
Operational Efficiency
Industrial & Manufacturing
The slide highlights the shortage of heavy vehicle drivers in the cement industry and its impact on labor costs, particularly in metropolitan areas, with projected trends and reasons for the shortage.
truck drivers, cement industry, labor cost, shortage, metropolitan areas
Mixed Chart
LEK
Saved
Table comparing various financial metrics and sector weights across different indices like S&P 500, R2000, R1000G, R1000V, MSCI World, etc. Includes a sector weight pie chart.
Market Analysis and Trends
Financial Services
This slide provides a detailed comparison of financial characteristics and sector weights for various indices, highlighting key metrics and distribution of sector weights.
sector, weights, indices, comparison, metrics
Multiple Chart
Morgan Stanley
Saved
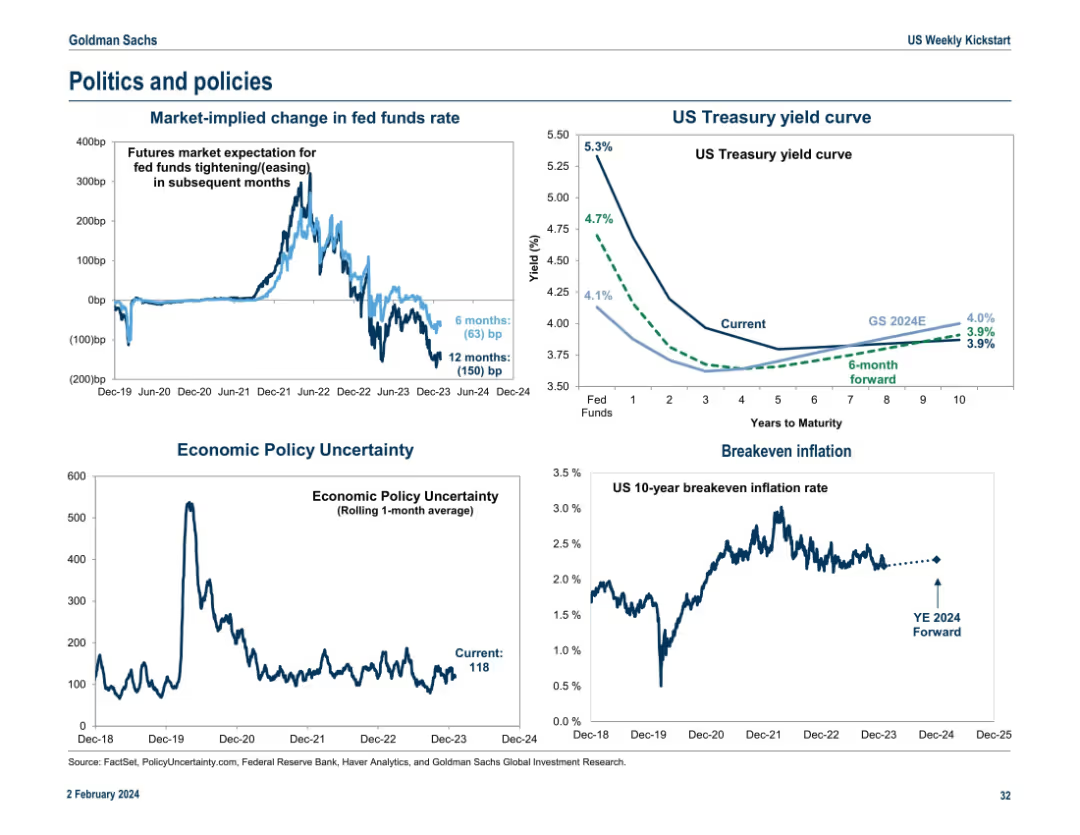
Four-part layout showing charts on fed funds expectations, Treasury yield curve, economic policy uncertainty, and breakeven inflation. Clean, with emphasis on policy impact indicators.
Regulatory and Compliance
Government & Public Sector
This slide illustrates the market's expectations for changes in interest rates, the yield curve, economic policy uncertainty, and breakeven inflation. It’s focused on projecting policy-related market impacts and assessing forward-looking economic and inflation expectations.
interest rates, yield curve, inflation, policy uncertainty, regulation
Multiple Chart
Goldman Sachs
Saved
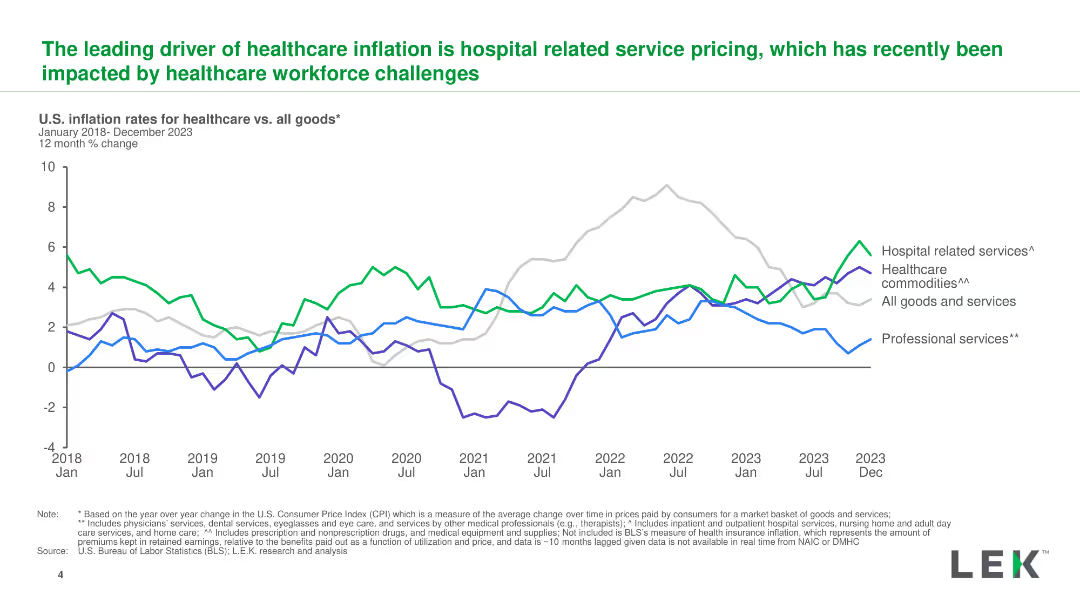
A line chart displaying U.S. inflation rates for healthcare services, commodities, and professional services from 2018 to 2023, with distinct color coding for each category.
Market Analysis and Trends
Healthcare & Pharmaceuticals
The slide explains the main drivers of healthcare inflation, emphasizing the impact of hospital service pricing and workforce challenges on recent trends.
inflation, healthcare, services, pricing, trends
Single Chart
LEK
Saved
Features a column chart displaying 'Asset & Wealth Management Net Revenues' and a financial results table detailing various types of fees and revenues, with year-over-year and quarter-over-quarter comparisons.
Investment Analysis
Financial Services
The slide provides a financial summary of the Asset & Wealth Management sector, showing revenue generation from management fees, private banking, and investments. Useful for evaluating financial health and opportunities in asset management.
Asset Management, Wealth Management, Net Revenue, Management Fees, Private Banking, Investment, Revenue Analysis, Financial Results
Mixed Chart
Goldman Sachs
Saved
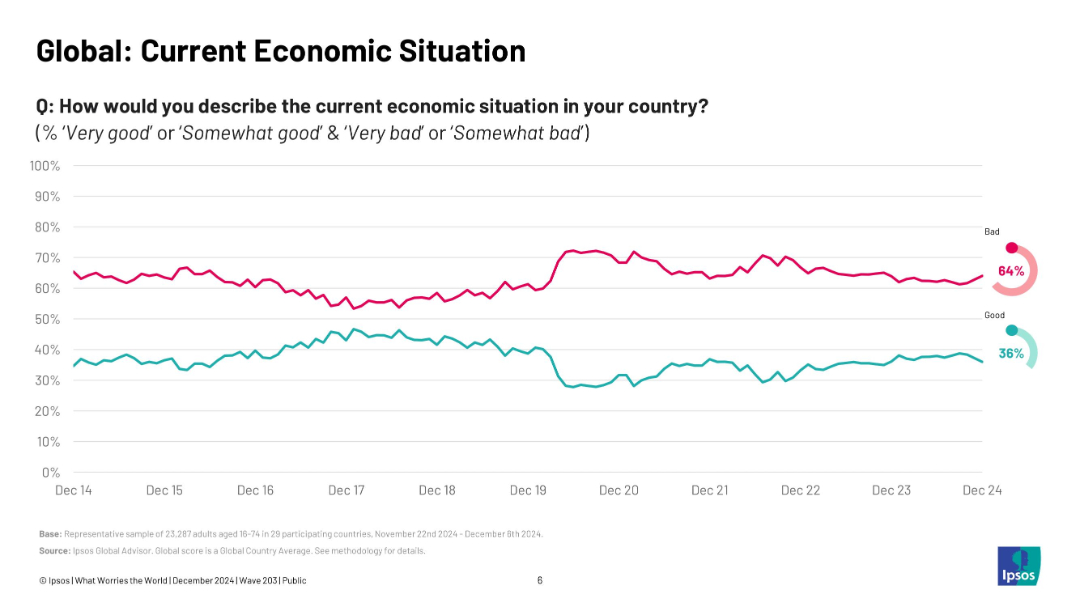
Line chart tracking public sentiment over time; two lines (good vs. bad); minimal text; annotated endpoints.
Market Analysis and Trends
Financial Services
The slide shows a long-term trend of public perception regarding national economic situations globally. Since 2020, sentiment has been increasingly negative, with a persistent majority rating conditions as "bad."
economy, perception, Ipsos, long-term trend, financial sentiment, economic health, global view, timeline, data tracking, public outlook
Multiple Chart
IPSOS
Saved
The slide includes a line chart showing the decline in foreign direct investment (FDI) in China over 25 years. It provides commentary and implications for corporates.
Market Analysis and Trends
Financial Services
The slide analyzes the trend of declining FDI in China due to geopolitical tensions and economic factors. It discusses the potential impacts on foreign companies and investment strategies.
FDI, China, geopolitical tension, economic analysis, financial services
Mixed Chart
Accenture
Saved
A title slide with a gradient background, featuring the presentation's title, a short subtitle, and a corporate logo.
Industry Overview
Financial Services
This introductory slide sets the stage for a discussion on trade working capital finance strategies and execution in 2018.
trade finance, working capital, strategy, 2018, overview
Title
Citigroup
Saved
Features a world map background with key details on global presence and expertise areas in transaction advisory highlighted alongside.
Investment Analysis
Professional Services
Highlights the global reach and expertise of Alvarez & Marsal’s Transaction Advisory Group, focusing on financial and tax diligence and industry specialization.
Global, Advisory, Transaction, Financial, Tax
Linear Flow
Alvarez & Marsal
Saved
The slide shows a timeline of newspaper revenue from 2003 to 2019 in Western Europe, with stacked column charts depicting revenue sources such as print and online. The decline in total revenue is clearly marked, showing a significant reduction over the years.
Industry Overview
Media & Entertainment
Analyzes the decline in newspaper revenues in Western Europe, focusing on changes in revenue sources such as print and online advertising. This information is critical for understanding the shifting landscape of the media industry and could influence strategic decisions in media management and business model adaptation.
media trends, revenue decline, print advertising, online growth, market analysis
Mixed Chart
Accenture
Saved
The slide contains a column chart showing changes in CCB revenue from 2012 to 2022 with different factors labeled.
Financial Performance
Financial Services
It presents a decade-long financial trend analysis of the Consumer and Community Banking revenue, including net interest income forecasts.
CCB, revenue, net interest, forecast, financial trend, 2012-2022, JPMorgan Chase & Co, banking
Single Chart
JP Morgan
Saved
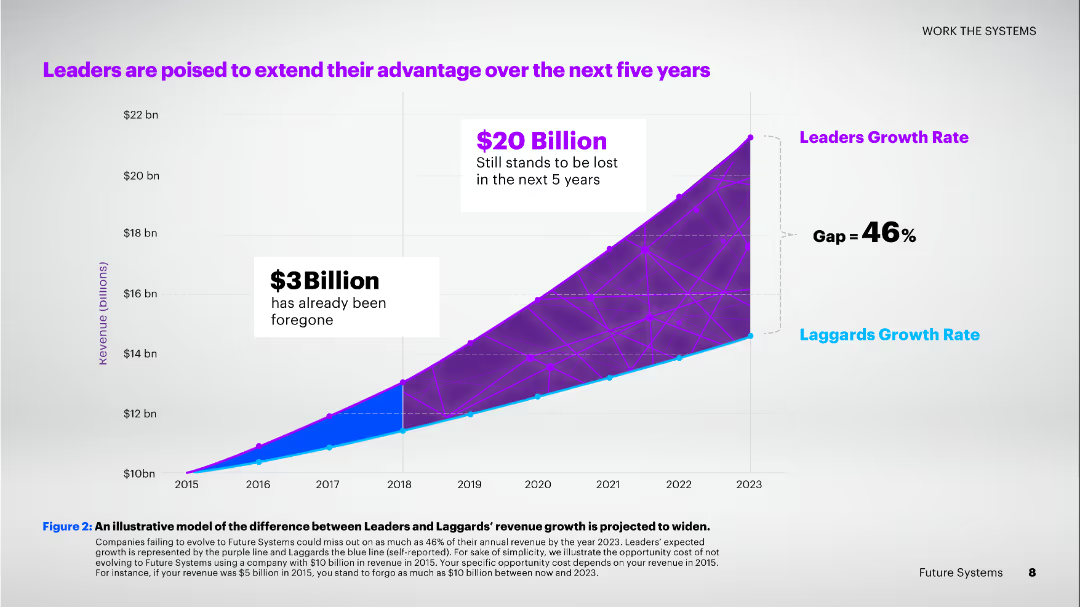
A slide with a line chart comparing the revenue growth rates of leaders and laggards over time, with projections extending to 2023.
Strategic Planning
Technology & Software
This slide illustrates the projected widening revenue growth gap between leaders and laggards, emphasizing the potential future losses for laggards if they fail to evolve their systems and adopt new technologies.
revenue growth, leaders, laggards, projections, future, advantage, technology, evolution, systems, gap
Single Chart
Accenture
Saved
The slide provides a breakdown of preparers responsible for dining and hotel sales journal entries, with detailed tables showing percentage of activity by preparer.
Regulatory and Compliance
Financial Services
This slide details the number of preparers for dining and hotel sales, analyzing their activity percentages to identify any discrepancies or patterns that warrant further investigation.
journal entries, preparers, dining sales, hotel sales, financial oversight
Mixed Chart
EY
Saved
Includes a simple column chart and detailed bullet points on cost actions.
Operational Efficiency
Financial Services
Highlights the importance of various cost management actions to maintain a competitive advantage in 2024, emphasizing supply chain and manufacturing costs.
cost management, supply chain, manufacturing, competitive advantage
Mixed Chart
BCG
Saved
This slide includes a column chart rating the difficulty of communicating climate impact ideas across different industries, complemented by insight boxes.
Organizational Structure and Change
Environmental Services & Sustainability
Discusses the challenges industries face in communicating the impact of their climate-related business practices to customers and partners.
communication challenges, climate impact, industry comparison, business strategy, environmental concerns
Mixed Chart
Deloitte
Saved
This slide includes a line graph tracking the percentage change in marketing budgets over several periods, and an insights section with bullet points.
Market Analysis and Trends
Professional Services
Analyzes shifts in traditional advertising spend over recent months and projections, with sector-specific insights on how industries adapt their marketing strategies post-Covid.
traditional advertising, marketing spend, Covid-19, industry analysis, budget forecast
Mixed Chart
Deloitte
Saved
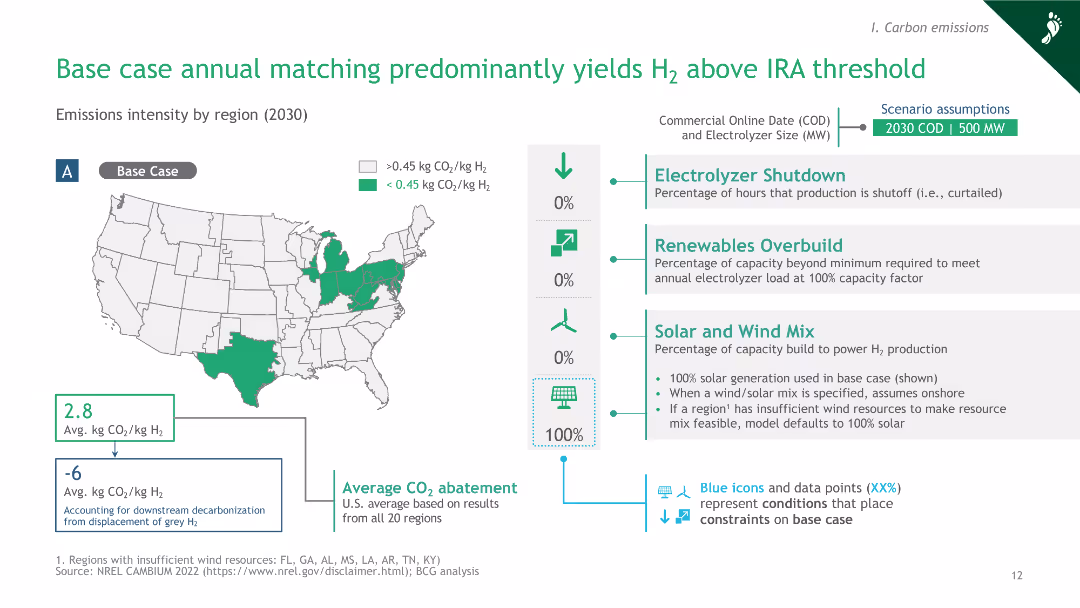
The slide includes a map of the U.S. with colored regions indicating emissions intensity, and a column chart summarizing assumptions and emissions outcomes.
Market Analysis and Trends
Energy & Utilities
This slide presents the base case scenario for annual matching, showing that most regions yield hydrogen emissions above the IRA threshold, with detailed assumptions and average CO2 abatement data.
green hydrogen, annual matching, IRA threshold, emissions intensity, U.S. regions
Graphic
BCG
Saved
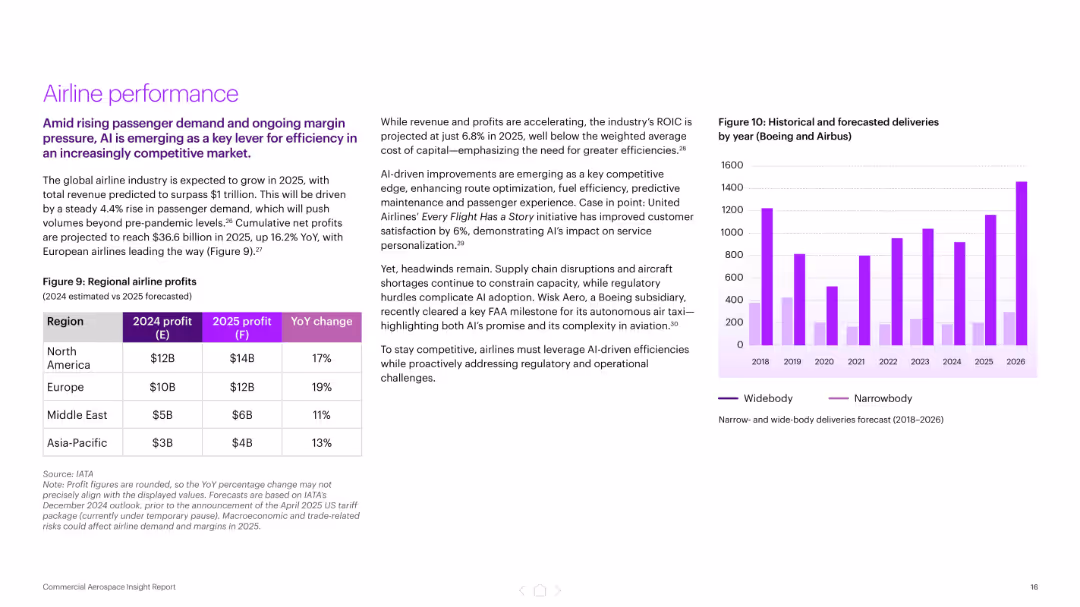
Split layout with left-side text and table showing regional airline profits, right side includes a bar chart of aircraft deliveries by type (2018–2026). Purple color palette.
Financial Performance
Industrial & Manufacturing
Highlights projected industry growth to $1 trillion by 2025, led by rising passenger demand and AI-driven efficiencies. Includes regional airline profit forecasts and delivery trends by aircraft type. AI’s role in improving customer satisfaction and cost efficiency is emphasized.
airline profits, AI, aerospace, passenger demand, aircraft deliveries, United Airlines, predictive maintenance, financial performance
Mixed Chart
Accenture
Saved
This slide has a dark background with a yellow highlight. It features a header, body text, and a column chart displaying three circular percentage indicators, each with a different percentage, representing the most valued aspects of healthcare.
Customer and Market Segmentation
Healthcare & Pharmaceuticals
The slide emphasizes the most important factors for Irish consumers in healthcare: access to care when needed, a cost-effective system, and achieving better health outcomes. It underlines the complexity of consumer decision-making in healthcare.
healthcare, consumer values, Ireland, access, cost
Mixed Chart
EY
Saved
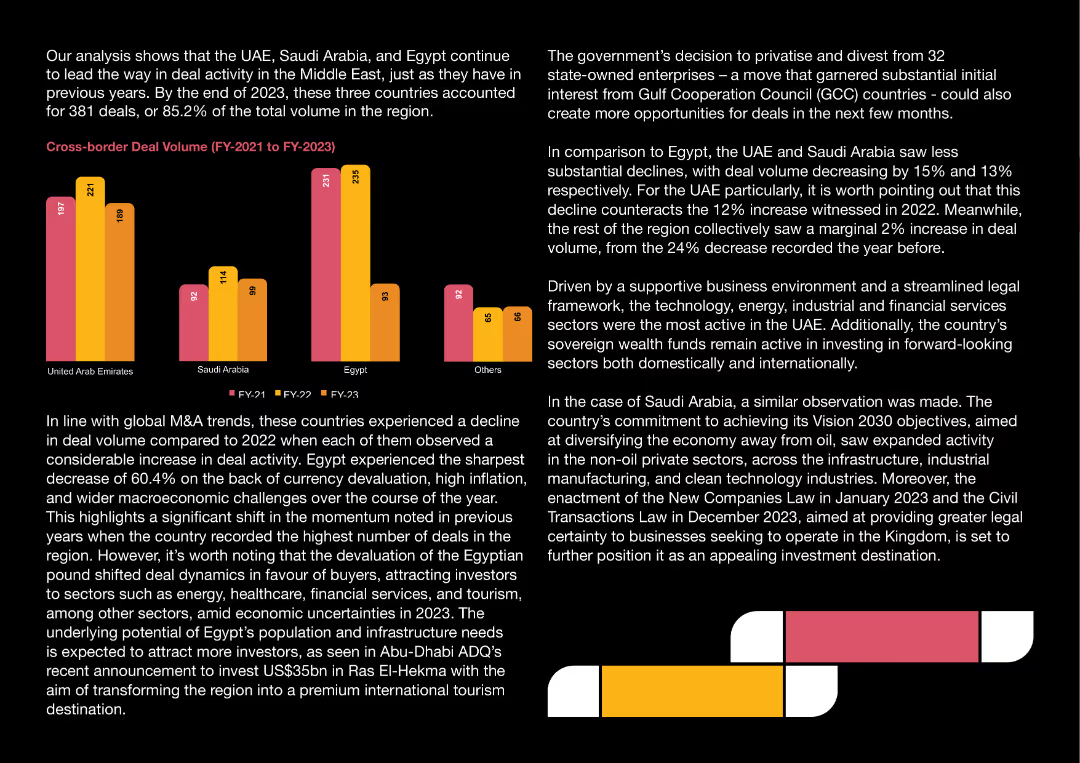
Column chart with three years (FY-21, FY-22, FY-23) of cross-border deal volumes for UAE, Saudi Arabia, Egypt, and Others. Colored bars represent each year.
Market Analysis and Trends
Financial Services
Analyzes the decline in cross-border deal volumes across the Middle East in 2023 compared to previous years. Highlights factors impacting the decline.
Cross-border, Deal Volume, UAE, Saudi Arabia, Egypt
Mixed Chart
PwC/Strategy&
Saved
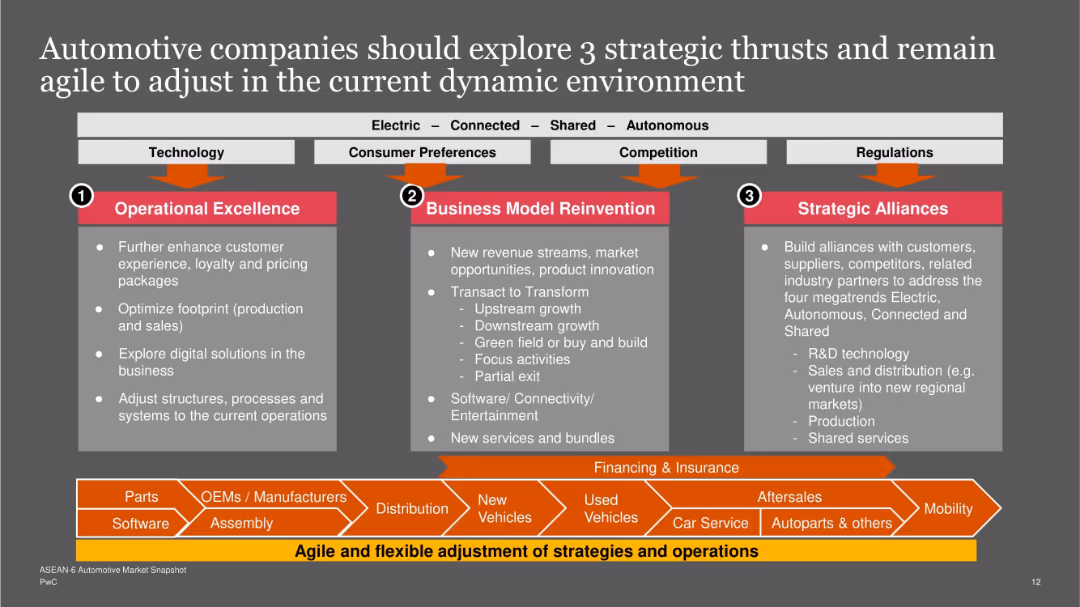
Three vertical columns for "Operational Excellence", "Business Model Reinvention", and "Strategic Alliances"; each with bullet points; top banner shows forces (tech, regulation, etc.) impacting strategy.
Strategic Planning
Industrial & Manufacturing
Recommends three strategic areas for automotive firms: optimizing operations, reinventing business models, and forming alliances. Anchored in adapting to electrification, consumer shifts, and competitive pressures. Flow diagram at bottom visualizes the full value chain and areas of potential agility.
strategy, automotive, business model, alliances, operations, flexibility, transformation
Diagram
PwC/Strategy&
Saved
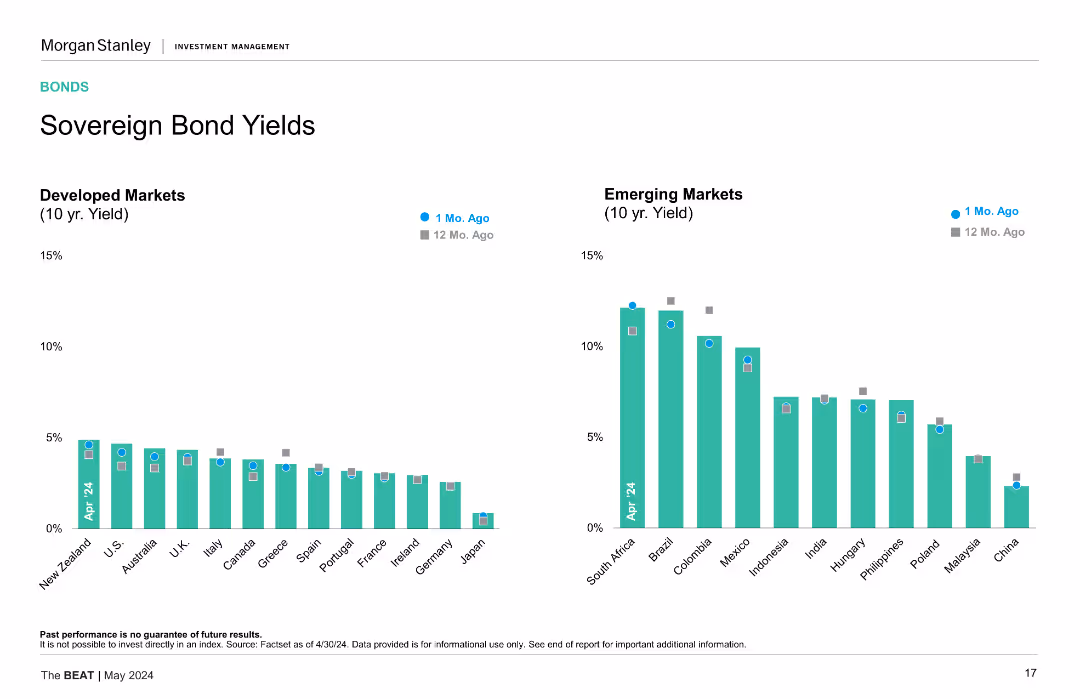
This slide displays two vertical bar charts side by side. The left chart shows 10-year yields for developed markets, while the right chart shows the same for emerging markets, comparing data from 1 month ago and 12 months ago.
Market Analysis and Trends
Financial Services
The slide presents a comparison of sovereign bond yields between developed and emerging markets over the past year, highlighting yield changes and potential market implications.
Sovereign Bonds, Yields, Developed Markets, Emerging Markets, Comparison, Financial Analysis
Multiple Chart
Morgan Stanley
Saved
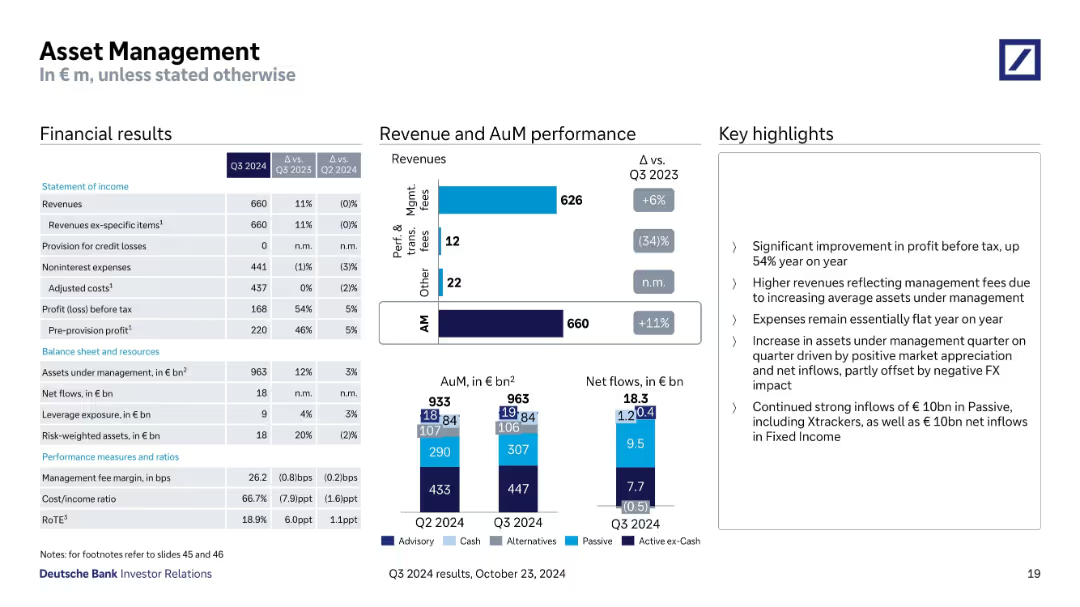
Three-column layout with financial tables, bar charts for revenue & AuM, and bullet-point key highlights; clean, data-dense design with corporate branding and subtle blue color palette.
Financial Performance
Financial Services
This slide provides quarterly financial data for Deutsche Bank's Asset Management division. It includes income statement metrics, AuM performance, net inflows, and fee breakdowns. Key messages highlight revenue growth, flat expenses, and strong passive inflows.
asset management, revenue, inflows, AuM, profit, fees, Q3, Deutsche Bank
Multiple Chart
Deutsche Bank
Saved
Previous
Next
If nothing, comes up, please save your slides first
Create a FREE account to continue browsing
Receive Instant Access to 1,000+ slides from companies like McKinsey, Google, and Goldman Sachs
First Name
Last Name
Email
Password
I agree to all
Terms & Privacy Policy
Thank you! Your submission has been received!
Oops! Something went wrong while submitting the form.
Have an account?
Sign in
Column Chart
Heatmap
Chevron
Org Chart
Infographic
Callouts
Timeline
List
Graphic
Picture
Process Flow
Diagram
Paragraph
Map
Table
Framework
Subtitle
Takeaway Box
Icon
Other Chart
Radar Chart
Waterfall Chart
Mekko Chart
Pie Chart
Scatter Plot
Line Chart
Bar chart
Bullet points