My Account
My Slides
Search by Category
Templates
Leave Feedback
Login
Logout
Get Started
Browse all Slides
Browse all Slides
Create a FREE Account
Instant access to 1,000+ real slides from top companies like McKinsey, BCG, Goldman Sachs, Google and many more!
First Name
Last Name
Email
Password
I agree to all
Terms & Privacy Policy
Thank you! Your submission has been received!
Oops! Something went wrong while submitting the form.
Have an account?
Sign in
Saved Slides
This slide includes multiple triangular diagrams illustrating the impact of technology, process, data, and talent on operational maturity. The visuals are effectively used to compare the influence of each factor.
Strategic Planning
Professional Services
Highlights how different operational levers affect the maturity and efficiency of business operations. Essential for strategic decision-making and resource allocation in organizational development.
Operational Efficiency, Maturity Levels, Strategy
Mixed Chart
Accenture
Saved
The slide includes a bar chart comparing the usage of various social media platforms (Facebook, Instagram, Twitter, YouTube, Snap, LinkedIn) between non-winners and winners. Bars are vertically oriented with labeled percentages.
Market Analysis and Trends
Media & Entertainment
This slide discusses the role of social media platforms like Facebook and Instagram in effective campaigns, highlighting differences in platform usage between winners and non-winners.
social media, Facebook, Instagram, effective campaigns, bar chart
Mixed Chart
IPSOS
Saved
World map in purple shades, percentage yields by country, clearly labeled.
Market Analysis and Trends
Financial Services
Displays global equity yields, offering a geographic perspective for investment opportunities.
Equity Yields, Global, Investment Opportunities, Map, Geographic Distribution, Morgan Stanley, Market Monitor
Graphic
Morgan Stanley
Saved
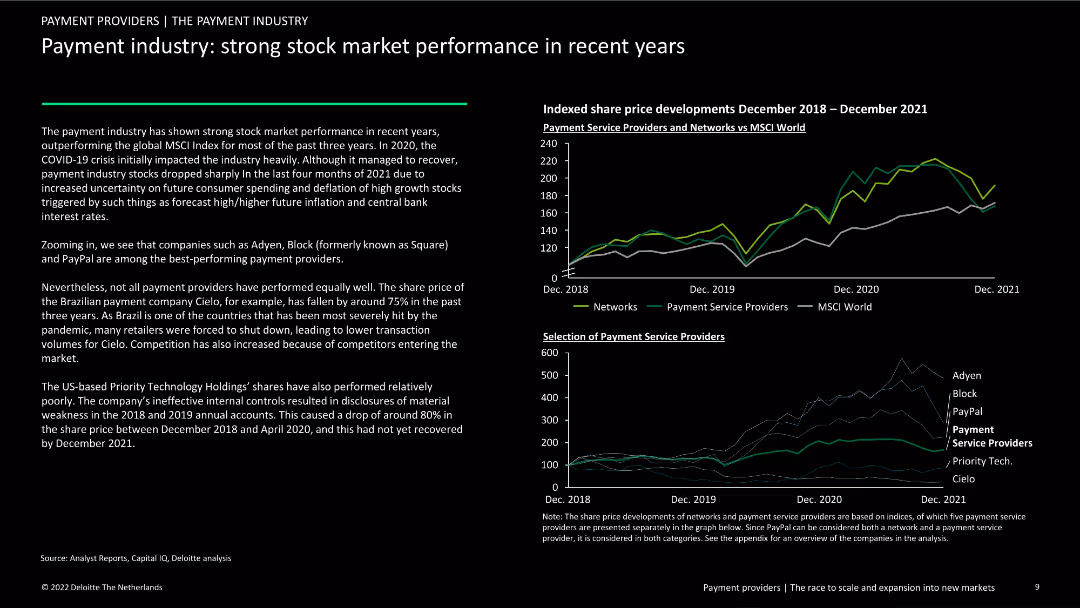
The slide includes two column charts: one showing the indexed share price developments of payment service providers and networks vs. MSCI World, and another comparing the performance of selected payment service providers. Text analyzes trends.
Financial Performance
Financial Services
This slide reviews the stock market performance of payment industry players from December 2018 to December 2021, comparing them with the MSCI World index. It highlights top performers like Adyen and PayPal and discusses the impact of COVID-19.
payment industry, stock market, performance, trends, COVID-19
Multiple Chart
Deloitte
Saved
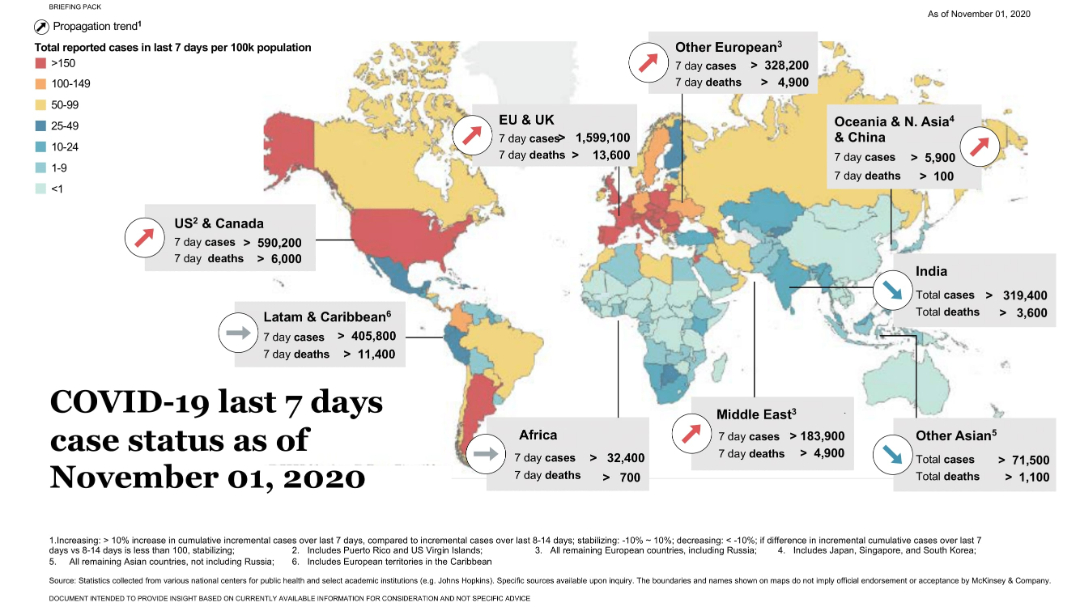
World map with heatmap coloring and arrows for trend direction; regional stats in callouts; legend and notes at bottom.
Risk Assessment and Management
Healthcare & Pharmaceuticals
This slide presents a global heatmap of COVID-19 case rates by region for a 7-day period. Regional callouts show case and death figures, with trend indicators (rising/stabilizing/decreasing).
COVID-19, heatmap, global health, cases, deaths, McKinsey, pandemic, trend
Uncategorized
McKinsey
Saved
The slide contains text analysis and a pie chart comparing the perceived impact of COVID-19 and the 2007-08 Financial Crisis on investors. Clean white background.
Market Analysis and Trends
Financial Services
This slide compares the impact of COVID-19 and the Financial Crisis of 2007-08 on investors, highlighting differences in perception and resulting investment behavior.
COVID-19, Financial Crisis, comparison, perception, investment behavior
Mixed Chart
IPSOS
Saved
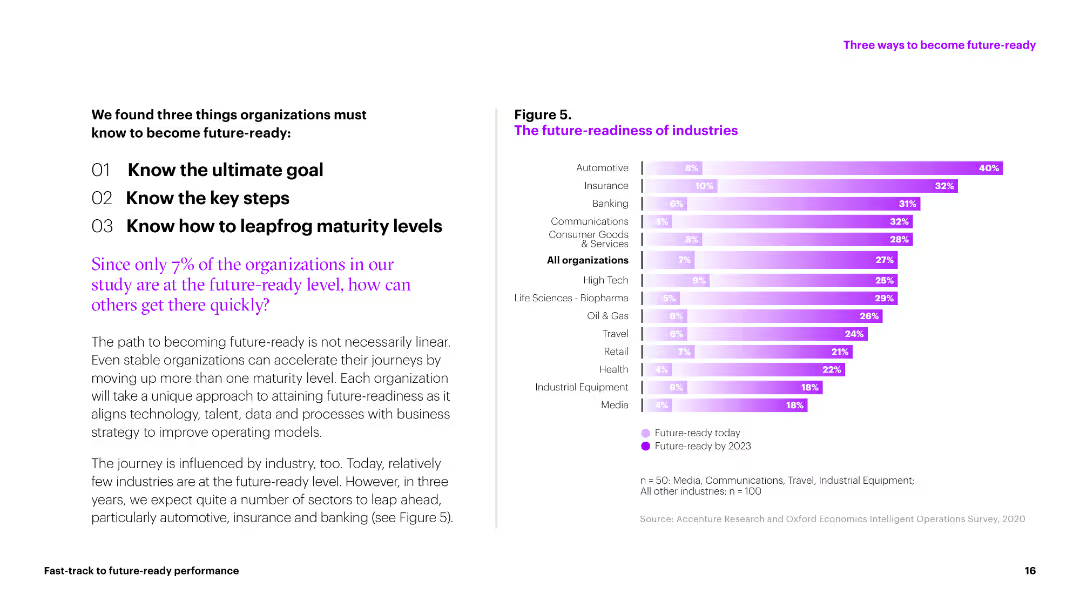
A bar chart displaying future-readiness levels across various industries. Bars represent readiness today and projected for 2023, with different colors indicating the timeline.
Market Analysis and Trends
Professional Services
This slide compares the future-readiness of different industries, showing current levels and projections for 2023. It highlights how sectors like automotive and insurance are expected to progress.
future-readiness, industries, projections, 2023, current levels
Mixed Chart
Accenture
Saved
Features multiple bar charts comparing costs in different countries with annotations for potential cost reductions.
Market Analysis and Trends
Energy & Utilities
Evaluates how Australia could become more competitive in the battery sector by refining costs and optimizing production efficiency.
cost competitiveness, refining, Australia, battery industry
Multiple Chart
Accenture
Saved
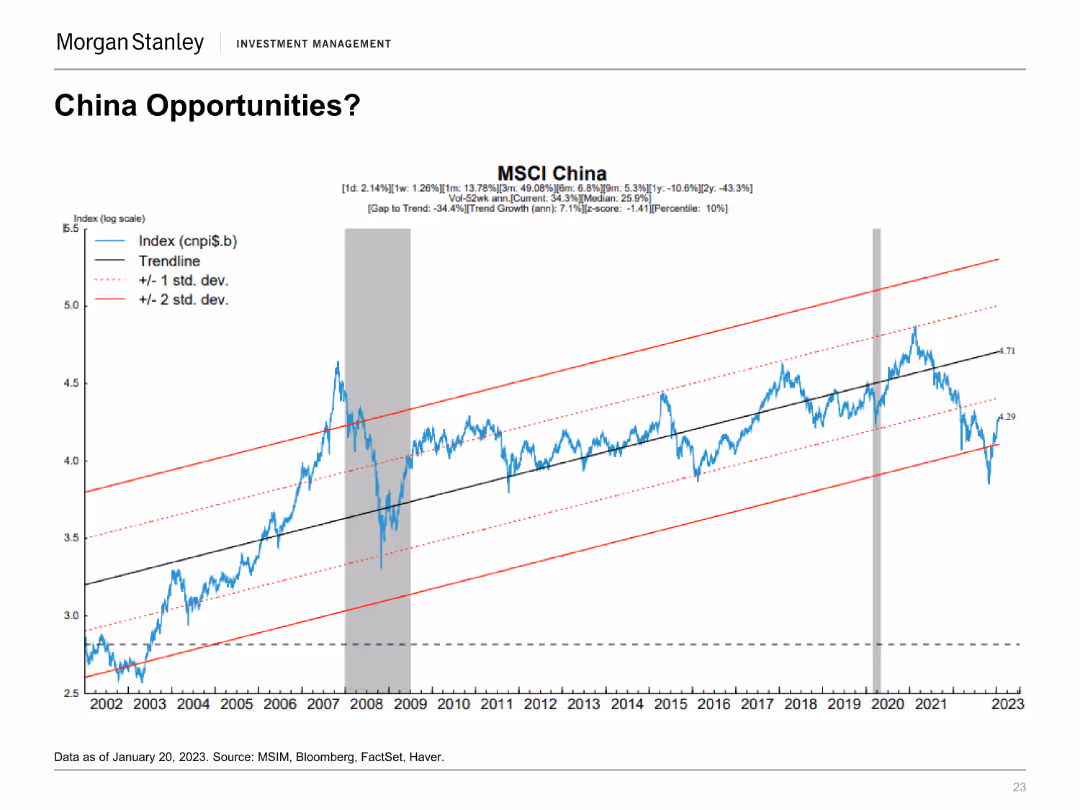
A line chart on a log scale showing the MSCI China Index with trendlines and standard deviation bands from 2002 to 2023.
Market Analysis and Trends
Financial Services
The slide examines investment opportunities in China by analyzing the MSCI China Index's performance and potential trend growth, indicating investment prospects.
MSCI China, Investment, Trends, Opportunities, Index
Single Chart
Morgan Stanley
Saved
This slide offers vertical column charts divided by consumer nationality, highlighting their market contributions and trends from 2018 to 2019.
Customer and Market Segmentation
Consumer Goods
Examines the impact of consumer nationality on the luxury goods market in 2019, with a significant focus on Chinese consumers.
Consumer nationality, Market impact, Luxury goods
Multiple Chart
Bain
Saved
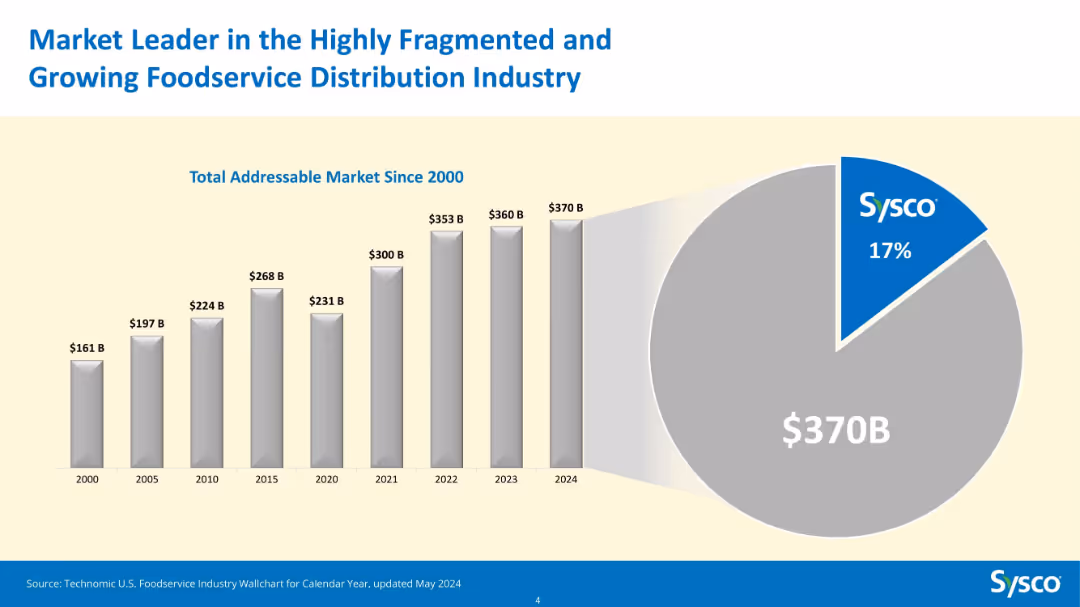
Bar chart (2000–2024) showing Total Addressable Market growth and pie chart for 2024 market share.
Market Analysis and Trends
Consumer Goods
This slide illustrates the expansion of the total addressable market for foodservice distribution in the U.S., which grew from $161B in 2000 to $370B in 2024. Sysco holds a 17% share of this growing market, highlighting its leadership.
foodservice, TAM, Sysco, market share, growth, bar chart, pie chart, distribution, industry size, leader
Multiple Chart
Barclays
Saved
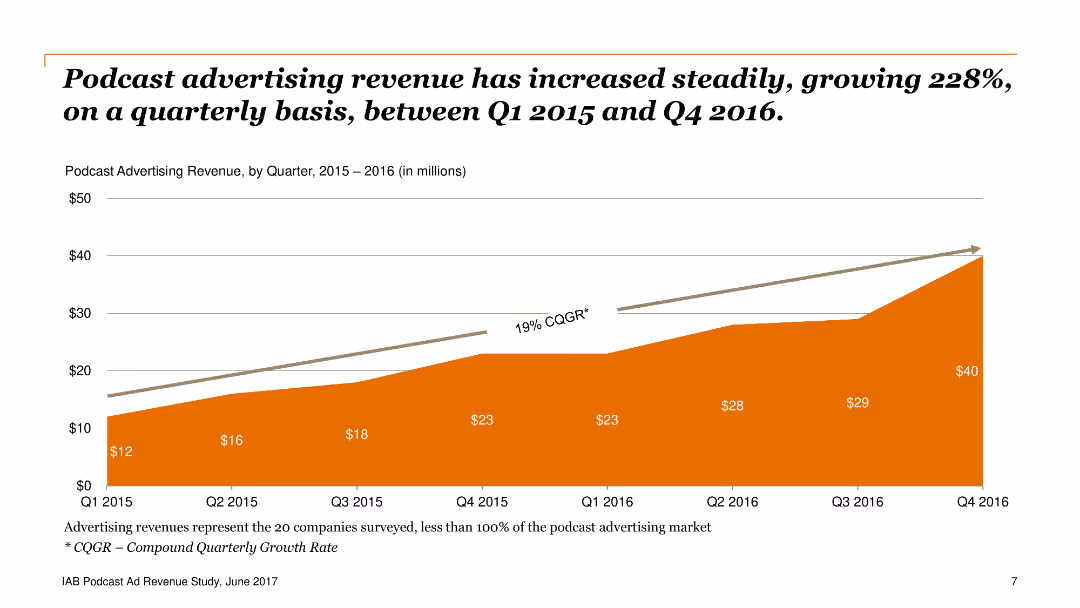
Column chart displaying podcast advertising revenue from Q1 2015 to Q4 2016, with an upward trend highlighted. Key figures include $12M in Q1 2015 and $40M in Q4 2016.
Market Analysis and Trends
Media & Entertainment
The slide shows the growth of podcast advertising revenue over time, emphasizing a 228% increase between Q1 2015 and Q4 2016. This can be used to highlight industry growth.
podcast, advertising, revenue, growth, media
Single Chart
PwC/Strategy&
Saved
Slide with line and area charts depicting trends in combined ratios and return on capital.
Financial Performance
Financial Services
Reviews Lloyd's financial performance in 2018, discussing the challenges such as soft market conditions and major loss events that influenced their financial metrics.
Financial, Performance, Challenges, 2018, Lloyd's
Multiple Chart
PwC/Strategy&
Saved
The slide features a large image of a cargo ship loaded with containers, with text blocks overlaying the image and a column chart below. The column chart has six categories with different colors.
Market Analysis and Trends
Transportation & Logistics
The slide discusses the focus of investors on business services and logistics in Greece, providing survey data on expected investment changes in various sectors over the next three years.
investors, business services, logistics, Greece, investment
Mixed Chart
EY
Saved
Features a line chart with projections of 'FTE Automation Output' against 'Historical FTE' trends, presented in blue and orange lines. The background is a simple gradient.
Financial Performance
Financial Services
Explores the impact of automation on GDP per capita growth, showing projected increases in productivity necessary to meet future GDP growth rates, based on automation scenarios.
GDP, Automation, Productivity, Economic Growth, Forecast
Single Chart
McKinsey
Saved
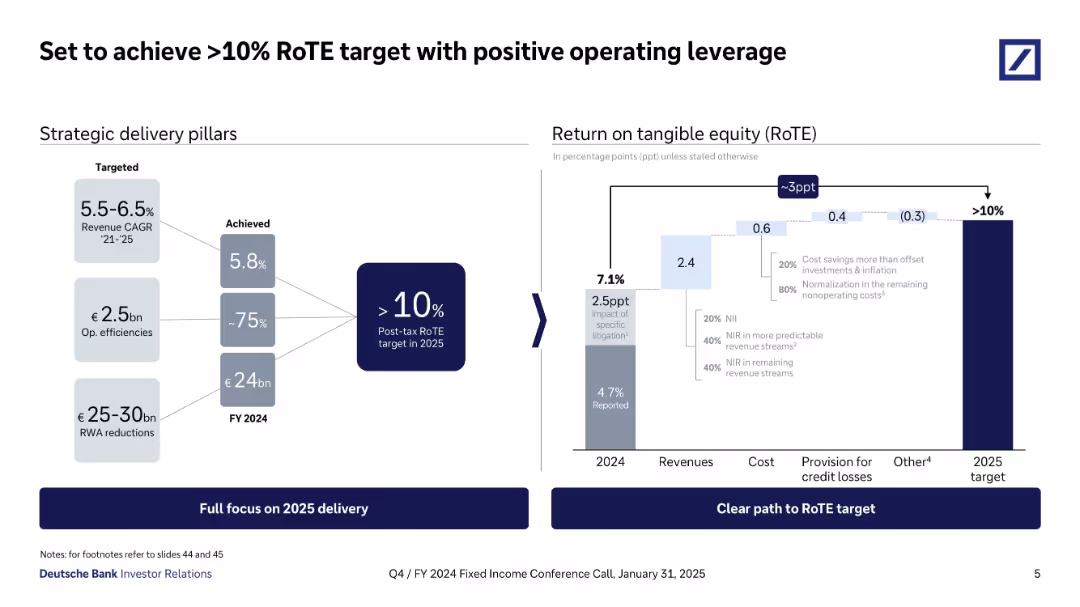
Two-part layout: strategic goals on the left, and a stacked bar chart for RoTE breakdown on the right. Uses arrows and gradients to show contributions of cost, provision, and revenue to RoTE.
Performance Metrics and KPIs
Financial Services
Deutsche Bank outlines its strategy to achieve >10% Return on Tangible Equity by 2025 through revenue growth, operational efficiencies, and risk-weighted asset reductions. The slide details how these elements cumulatively impact RoTE, with specific gains and offsets labeled clearly in the bar chart.
RoTE, return on equity, operating leverage, strategy, efficiencies, KPIs, 2025 target
Mixed Chart
Deutsche Bank
Saved
The slide includes bulleted points on collaboration initiatives and a column chart on asset management net new assets from private bank channels. It features a clean layout with blue and grey tones.
Strategic Planning
Financial Services
This slide details the initiatives to strengthen partnerships with PB through collaboration and distribution enhancement. It shows cumulative NNA growth and thematic equity fund launches.
Partnership, Collaboration, Asset Management, NNA Growth, Thematic Equity Funds
Mixed Chart
Credit Suisse
Saved
The slide features a three-part list comparing the progress of different DFS business models: pure-play fintechs, established financial services players, and digital banks. Each section has bullet points detailing strengths and weaknesses with corresponding symbols indicating their current state or trend.
Strategic Planning
Financial Services
Analysis of the development of various business models within digital financial services, highlighting specific strategies, operational strengths, and market challenges faced by each type of organization from fintechs to traditional financial institutions and emerging digital banks.
DFS, business models, fintechs, financial institutions, digital banks, progress, analysis
Header Vertical
Bain
Saved
The slide features column charts that contrast private funding values and deal counts, set against a clear white background.
Investment Analysis
Financial Services
This slide examines the digital economy's investment landscape, emphasizing the increase in deal values and activities over recent years.
private funding, digital economy, investment landscape, deal count, economy boom
Single Chart
Bain
Saved
Contains stacked area chart and a line chart displaying global COVID-19 cases over time. Utilizes a color gradient for different continents.
Regulatory and Compliance
Healthcare & Pharmaceuticals
Slide presents global COVID-19 epidemic progression with a focus on daily cases and cumulative totals by region. Analyzes trends in case growth rates.
COVID-19, epidemic, cases, global, trends
Multiple Chart
BCG
Saved
Features multiple column charts detailing the Gross Merchandise Value (GMV) growth by sector, including e-commerce and transport, with percentage increases noted.
Market Analysis and Trends
Technology & Software
Highlights the growth in all sectors of Indonesia's economy in 2021, with e-commerce showing significant increases.
Indonesia, Sector Growth, E-commerce, Transport, Double-Digit Growth, 2021, GMV
Multiple Chart
Bain
Saved
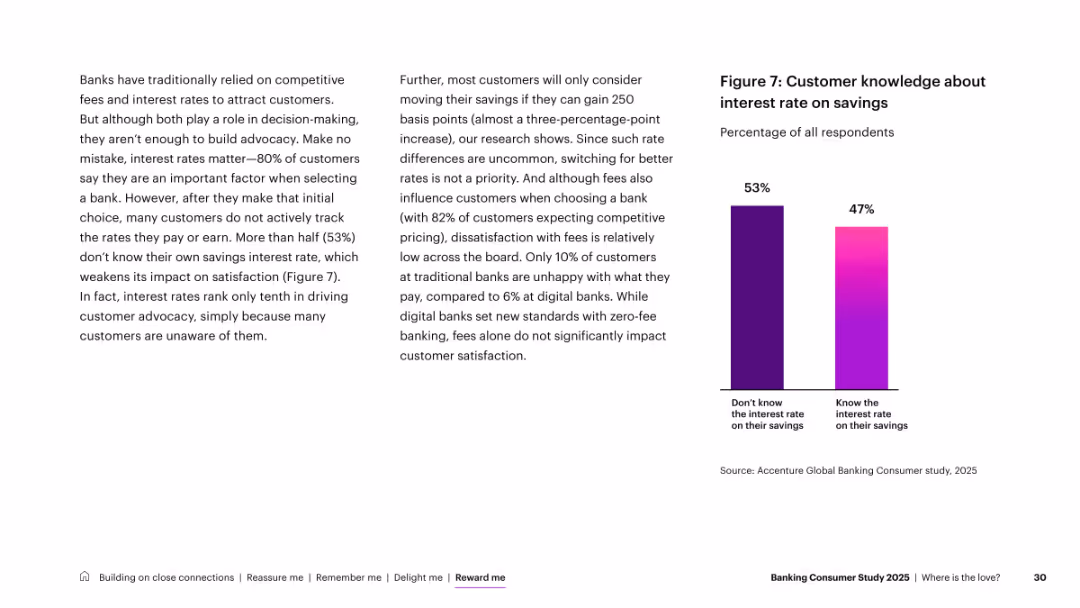
Two-column layout; left has dense explanatory text, right features a simple two-bar comparison chart
Customer and Market Segmentation
Financial Services
Discusses the limited impact of interest rates on advocacy. Although 80% consider rates when selecting banks, 53% don’t know their savings interest rate. Highlights that awareness is low, diminishing satisfaction impact.
banking branches, customer trust, digital, in-person, generational insights, physical presence
Mixed Chart
Accenture
Saved
Features dual-axis column charts showing origination volume in dark and light blue, with growth annotation. The right side has column charts depicting Home Lending ROE with a trend line indicating an increase.
Financial Performance
Financial Services
Displays growth in consumer originations and scaling of correspondent lending with a significant increase in ROE, highlighting the division’s strong financial performance over two years.
Origination Volume, Consumer, Correspondent, Return on Equity, Growth, Financial Performance
Multiple Chart
JP Morgan
Saved
Composed of a series of performance metric tables, the slide compares targets with actual results for different financial indicators over three years, using checkmarks and crosses to show if targets were met.
Financial Performance
Financial Services
The slide evaluates JPMorgan Chase's achievement against its long-term financial targets, useful for performance assessment and management discussions.
financial targets, performance assessment, JPMorgan Chase, long-term growth, revenue, profit margin, return on equity.
Table
JP Morgan
Saved
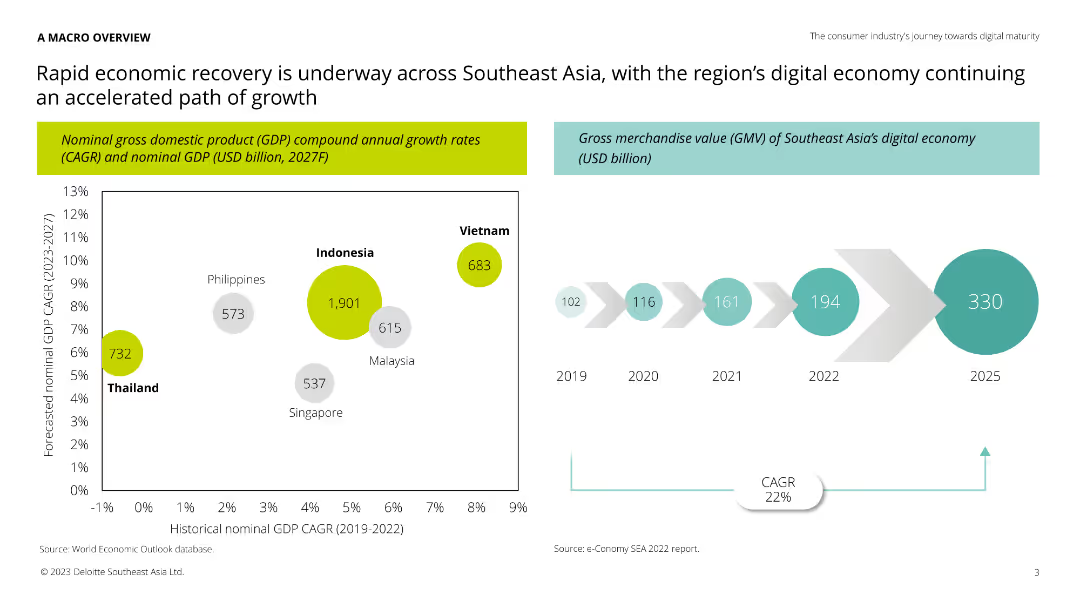
Column chart showing GDP growth rates and GMV of Southeast Asia's digital economy, alongside a timeline of historical GMV from 2019 to 2025.
Market Analysis and Trends
Technology & Software
The slide provides an overview of economic recovery in Southeast Asia, focusing on GDP growth and the digital economy's gross merchandise value. Useful for understanding market trends and growth potential in the region.
Southeast Asia, GDP, digital economy, growth, trends
Multiple Chart
Deloitte
Saved
Previous
Next
If nothing, comes up, please save your slides first
Create a FREE account to continue browsing
Receive Instant Access to 1,000+ slides from companies like McKinsey, Google, and Goldman Sachs
First Name
Last Name
Email
Password
I agree to all
Terms & Privacy Policy
Thank you! Your submission has been received!
Oops! Something went wrong while submitting the form.
Have an account?
Sign in
Column Chart
Heatmap
Chevron
Org Chart
Infographic
Callouts
Timeline
List
Graphic
Picture
Process Flow
Diagram
Paragraph
Map
Table
Framework
Subtitle
Takeaway Box
Icon
Other Chart
Radar Chart
Waterfall Chart
Mekko Chart
Pie Chart
Scatter Plot
Line Chart
Bar chart
Bullet points