My Account
My Slides
Search by Category
Templates
Leave Feedback
Login
Logout
Get Started
Browse all Slides
Browse all Slides
Create a FREE Account
Instant access to 1,000+ real slides from top companies like McKinsey, BCG, Goldman Sachs, Google and many more!
First Name
Last Name
Email
Password
I agree to all
Terms & Privacy Policy
Thank you! Your submission has been received!
Oops! Something went wrong while submitting the form.
Have an account?
Sign in
Saved Slides
Standard layout with horizontal bars colored by response; historical % agreement data on the right; title spans two lines due to length.
Strategic Planning
Government & Public Sector
This slide explores the extent to which citizens support strong leadership that challenges elite dominance. The global average is 63% agreement, highlighting support for populist-style governance. Some countries (e.g., Thailand, South Africa) show overwhelming agreement, pointing to deep frustrations with the political status quo.
leadership, elite, governance, reform, trust, populism, survey, Ipsos, inequality
Mixed Chart
IPSOS
Saved
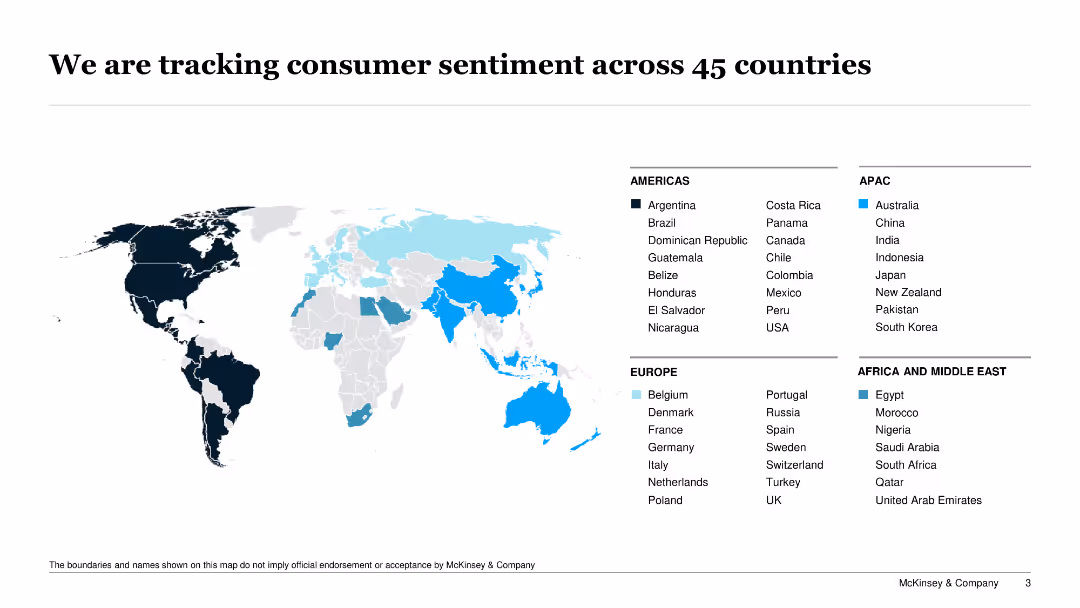
Features a world map highlighting 45 countries being monitored for consumer sentiment, with specific countries marked in different colors.
Market Analysis and Trends
Professional Services
The slide provides an overview of the global consumer sentiment tracking initiative, identifying the countries being analyzed for consumer trends and behaviors.
consumer sentiment, global tracking, market analysis, countries, trends
Graphic
McKinsey
Saved
This slide presents a gender and age-based demographic analysis through bar graphs, displaying growth factors with arrow indicators to denote the doubling or tripling of user base numbers.
Market Analysis and Trends
Retail & E-commerce
Analyzing the demographic factors driving growth in online spending, it reveals that women, non-metros, and those aged 35+ will predominantly influence the market, offering valuable insights for targeted marketing strategies.
Demographics, growth drivers, online spending
Multiple Chart
BCG
Saved
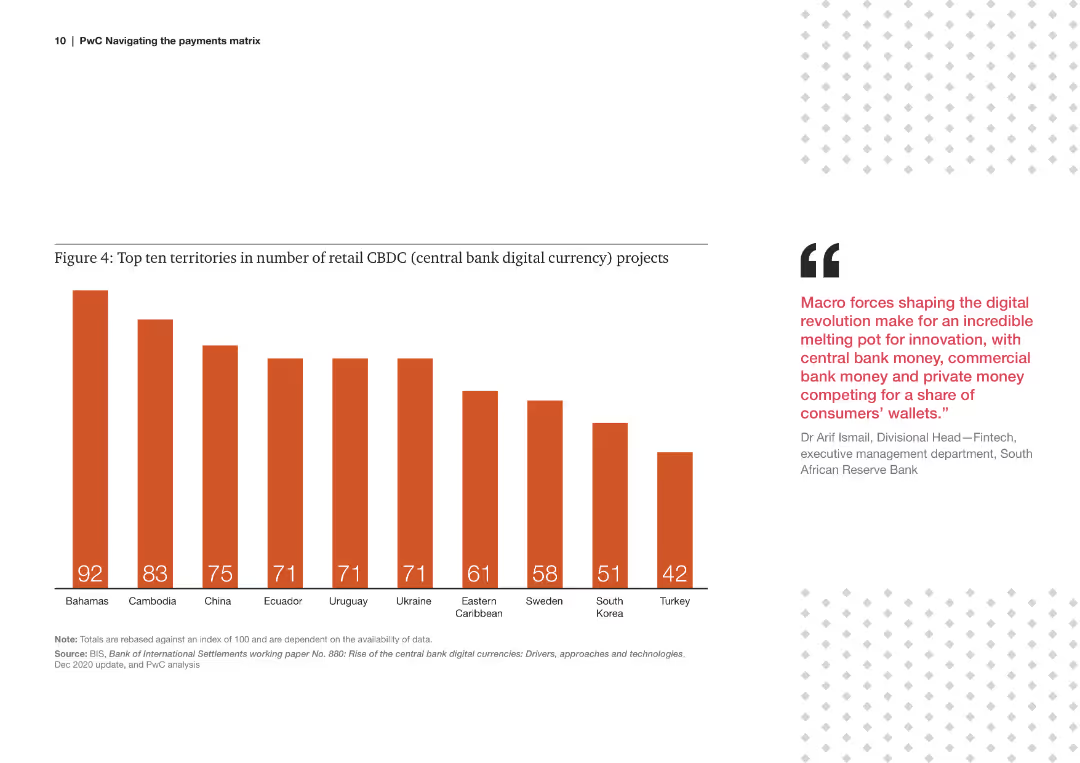
Bar chart displaying the number of retail central bank digital currency (CBDC) projects in various countries.
Technology and Digital Transformation
Financial Services
The slide highlights the leading countries in retail CBDC projects, indicating the adoption and experimentation of digital currencies.
retail, CBDC, projects, countries, digital currency, adoption, leading, territories, 2020
Mixed Chart
PwC/Strategy&
Saved
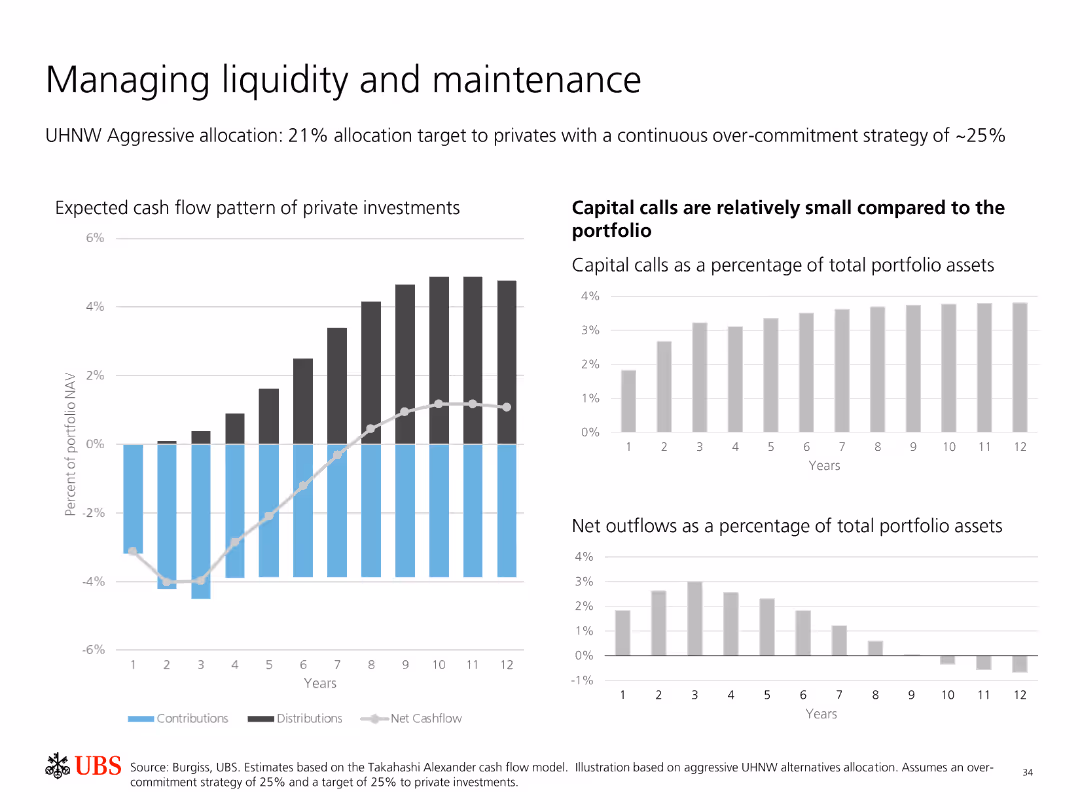
Contains multiple bar charts showing expected cash flow patterns of private investments, capital calls, and net outflows as a percentage of total portfolio assets.
Financial Performance
Financial Services
Analyzes liquidity management and maintenance in private investments, highlighting expected cash flows, capital calls, and net outflows relative to portfolio assets.
Liquidity Management, Private Investments, Cash Flow, Capital Calls, Net Outflows, Portfolio, Strategy, Analysis, Maintenance
Multiple Chart
UBS
Saved
Timeline showing the projected development of electric and hybrid-electric aviation technologies from 2020 to 2050.
Technology and Digital Transformation
Transportation & Logistics
This slide discusses the challenges and advancements in electrifying the aviation sector. It provides a timeline for the development of electric air taxis, hybrid-electric aircraft, and battery-powered planes, emphasizing their potential to reduce CO2 emissions and transform aviation.
Electric Aviation, Decarbonization, Timeline
Linear Flow
Roland Berger
Saved
Table categorizing various broadband technologies in Australia, their descriptions, and potential speeds, using a range of colors for clarity.
Product and Service Analysis
Telecommunications
Provides a comprehensive overview of broadband technologies available in Australia along with their potential speeds and nbn compatibility.
broadband, Australia, technology, internet, DSL, fibre, satellite, speeds, nbn
Table
Accenture
Saved
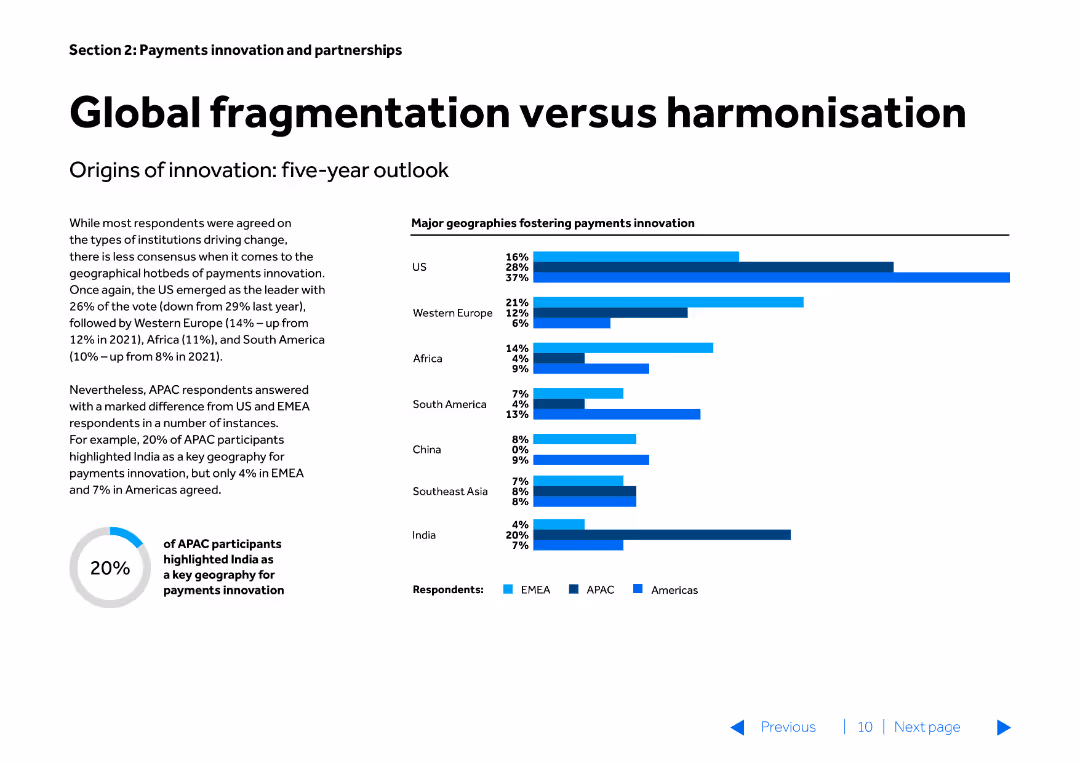
The slide features a title, a textual description, and a column chart. The column chart shows major geographies fostering payments innovation, with bars for the US, Western Europe, Africa, South America, China, Southeast Asia, and India, categorized by regions (EMEA, APAC, Americas).
Market Analysis and Trends
Financial Services
This slide examines the varying rates of payments innovation across different geographies, comparing the leading regions and highlighting the differences in innovation between US, Europe, and other regions. It is used for strategic planning in global payments innovation.
fragmentation, harmonisation, payments innovation, global, geographies, strategic planning, market trends, financial services
Multiple Chart
Barclays
Saved
The slide includes a dashboard with pie charts and column charts, showcasing customer accounts, revenue per product, and revenue per customer type, all displayed clearly.
Financial Performance
Energy & Utilities
The slide offers insights into customer accounts and revenue distribution by product and customer type, using various graphical representations to illustrate the data effectively.
customer accounts, revenue, product, customer type, utilities
Multiple Chart
EY
Saved
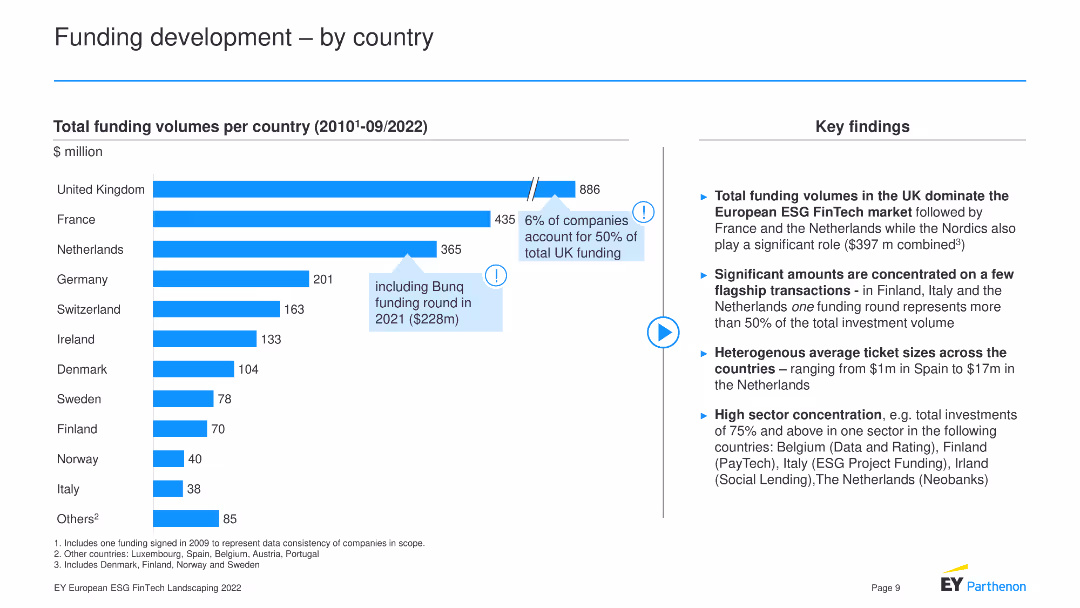
This slide features a bar chart showing funding volumes by country (2010-09/2022) and key findings.
Market Analysis and Trends
Financial Services
The slide compares total funding volumes across various countries, highlighting the UK's dominance in ESG FinTech funding, significant funding transactions in specific countries, heterogeneous average ticket sizes, and high sector concentration in certain regions.
Country Funding, ESG FinTech, Market Comparison
Mixed Chart
EY
Saved
The slide has two main sections; one is a column chart showing 'Technology and Product Investments,' with future outlook annotations, and the other is a text section detailing the impacts of these investments. The visual elements are clearly divided, using contrasting colors and icons to denote different aspects of technology development.
Technology and Digital Transformation
Technology & Software
This slide presents the financial commitments made towards technology and product development, alongside the tangible impacts of such investments on business operations and customer experience. It's utilized for illustrating the company's dedication to innovation and the concrete benefits derived from investments in modernization, likely intended for investor or stakeholder presentations.
Technology, Investment, Innovation, Digital Transformation, Impact, Business Value, Customer Experience
Mixed Chart
JP Morgan
Saved
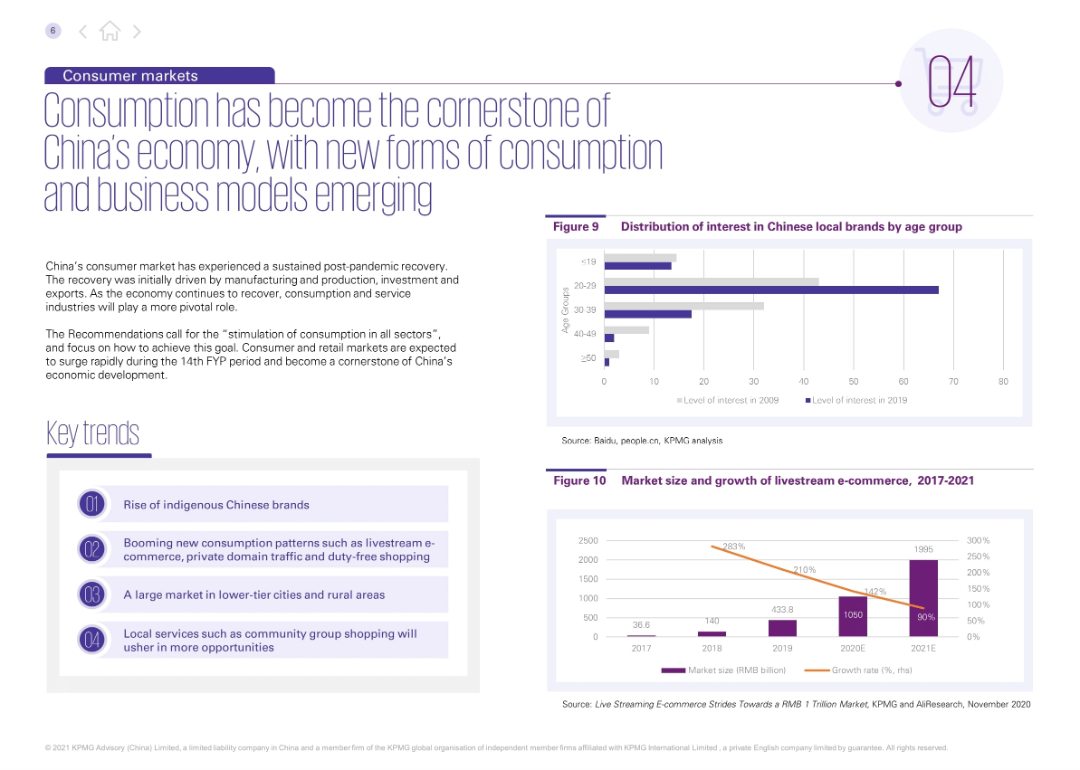
Two-column layout; left contains main text and key trends in highlighted boxes; right shows two bar and column charts (Figures 9 and 10) with age interest levels and livestream e-commerce growth.
Market Analysis and Trends
Consumer Goods
This slide discusses the rise of consumerism in China post-pandemic, emphasizing indigenous brands, livestream e-commerce, and rural market expansion. Key data visualizations highlight increasing interest among younger age groups and the explosive growth of livestream commerce from 2017 to 2021.
consumer trends, livestream e-commerce, rural markets, indigenous brands, China, retail growth, age segmentation, digital commerce, consumption, post-pandemic recovery
Multiple Chart
KPMG
Saved
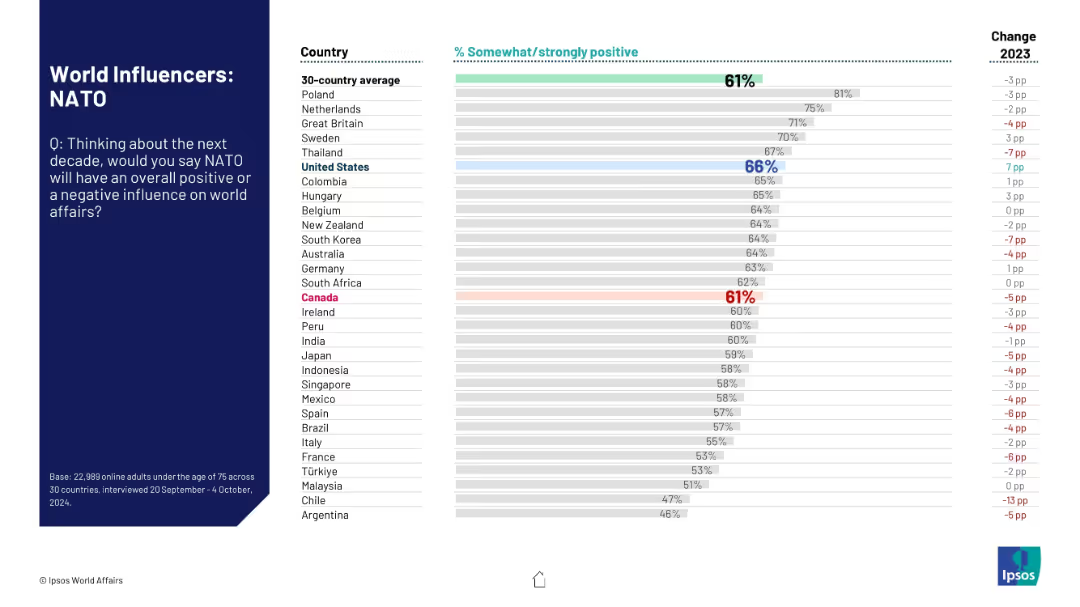
Same layout as previous: title and question on left, bar graph showing country-specific positive ratings on right.
Market Analysis and Trends
Government & Public Sector
This slide evaluates how countries perceive NATO’s future role in global affairs. It presents the percentage of people who see NATO as a positive influence, highlighting variation across nations and change from 2023.
NATO, global influence, public perception, international relations, bar chart, Ipsos, survey, 2024, alliance, opinion trends
Mixed Chart
IPSOS
Saved
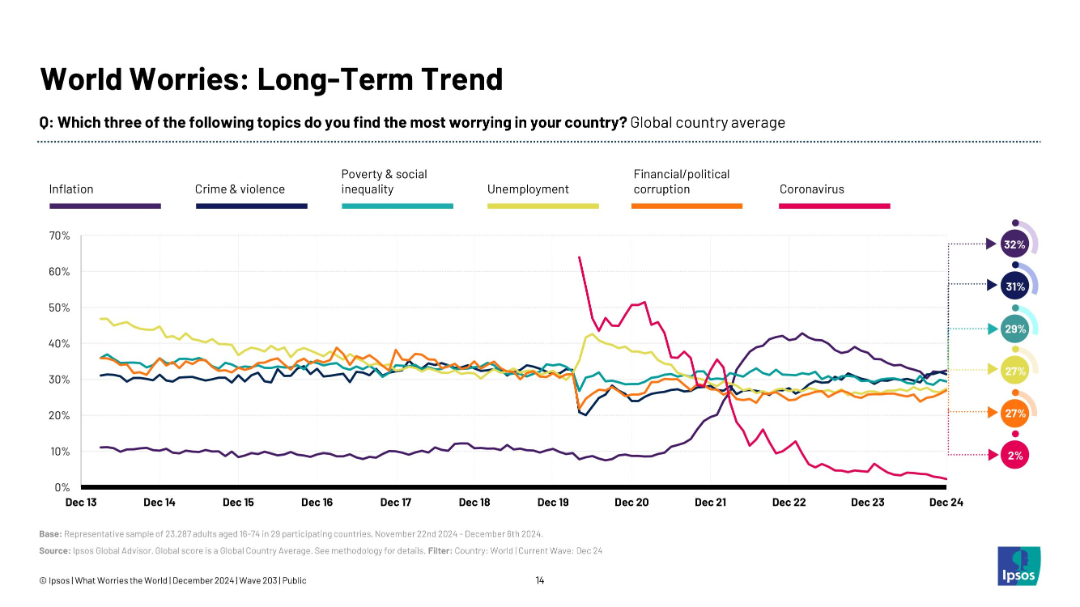
Line graph with colored trend lines tracking the percentage of global concern for various issues from Dec 2013 to Dec 2024, with a legend and summary percentages.
Market Analysis and Trends
Government & Public Sector
This slide presents long-term trends in global public concerns such as inflation, crime, poverty, unemployment, corruption, and coronavirus. It shows that inflation and crime now top the list, while concern about COVID-19 has plummeted.
global worries, trends, inflation, crime, poverty, unemployment, Ipsos, COVID-19, public opinion
Multiple Chart
IPSOS
Saved
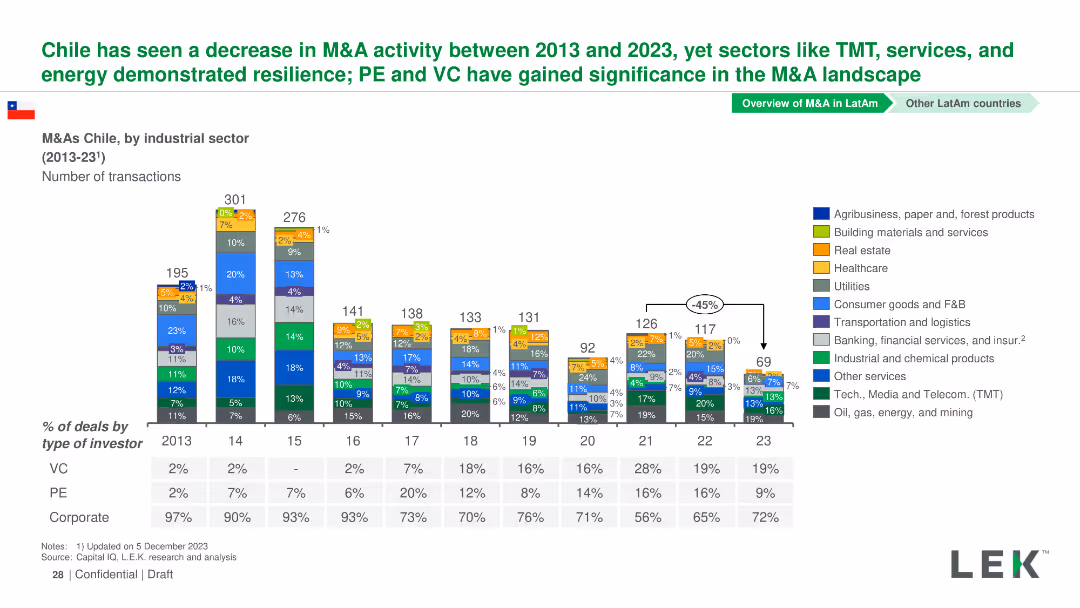
Column chart showing the number of M&A transactions by industrial sector in Chile from 2013-2023. Sectors are color-coded and detailed in a legend.
Market Analysis and Trends
Financial Services
This slide highlights M&A activity in various sectors in Chile from 2013-2023, noting significant changes and trends over the years.
Chile, M&A, Industrial Sectors, Transactions, Trends
Mixed Chart
LEK
Saved
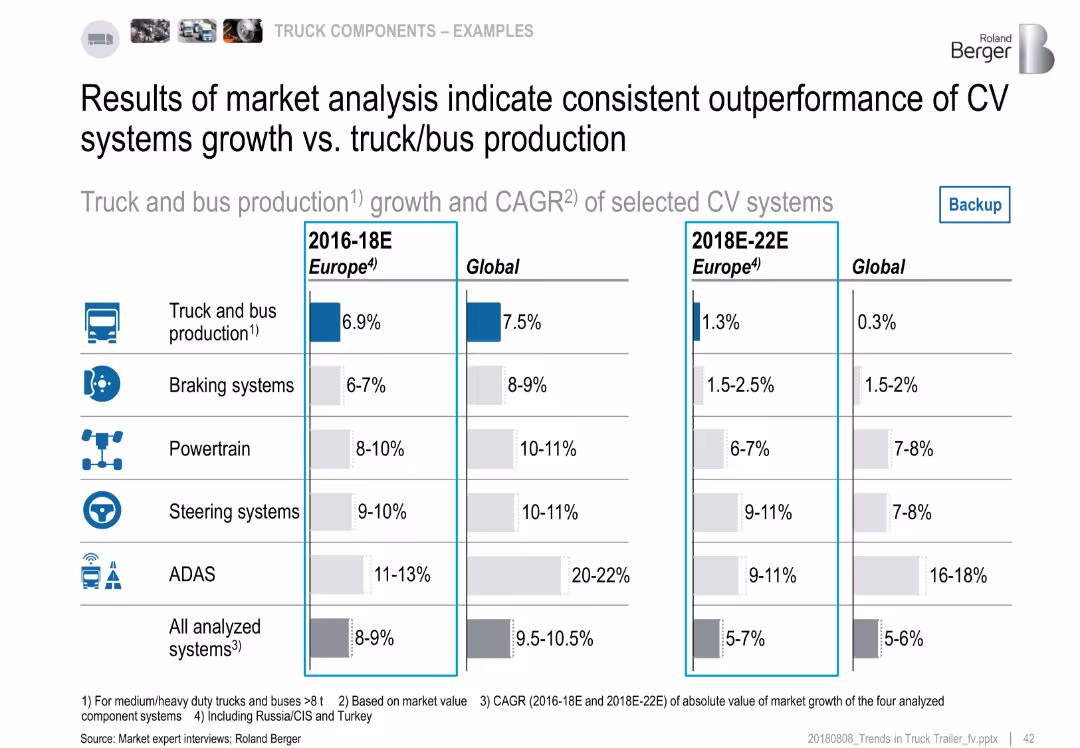
Split panel layout comparing CAGR (2016–18E and 2018E–22E) for Europe and Global in CV components and truck production
Market Analysis and Trends
Industrial & Manufacturing
This backup slide provides detailed CAGR estimates for two time periods, confirming that CV systems consistently outperform truck/bus production growth. ADAS shows the highest increase globally, while steering and powertrain components follow. The analysis is segmented by Europe and Global figures.
CAGR, CV growth, truck production, ADAS, Europe, global, forecasting
Multiple Chart
Roland Berger
Saved
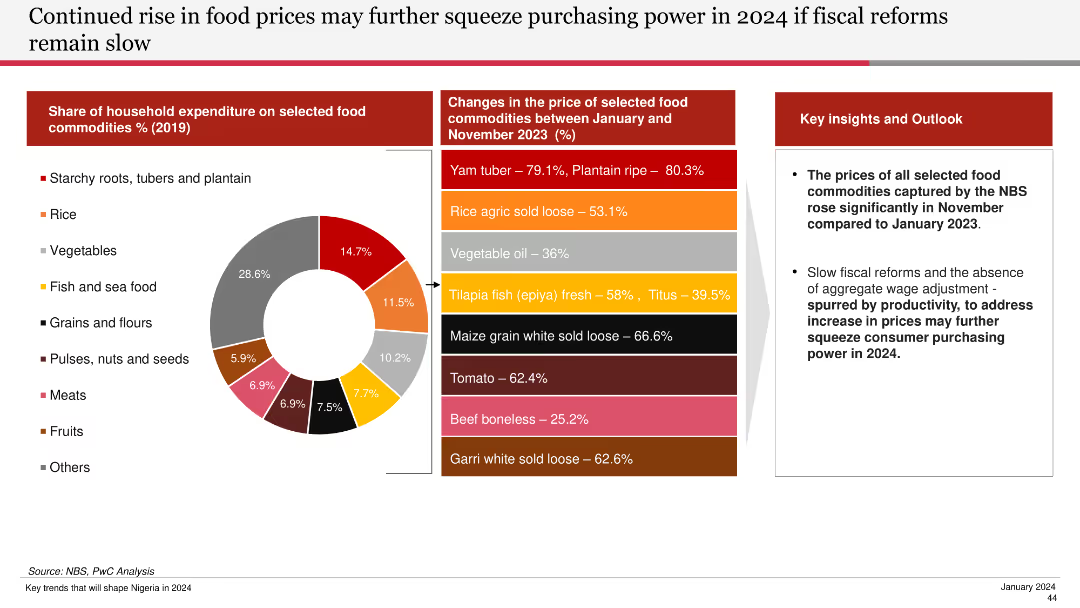
Features a pie chart of household expenditure on food commodities and a bar chart showing price changes of selected food commodities from Jan to Nov 2023.
Financial Performance
Agriculture & Food Production
Discusses the significant rise in food prices and the potential impact on purchasing power if fiscal reforms are not implemented swiftly.
food prices, purchasing power, fiscal reforms, commodities, household expenditure, 2024, food price changes
Mixed Chart
PwC/Strategy&
Saved
A graphically intensive slide illustrating growth opportunities and textual information on a dark background.
Investment Analysis
Financial Services
This slide outlines the estimated growth opportunities across different financial sectors, highlighting the engineering support for these initiatives.
Growth, Opportunities, Franchise, Investing, Banking, Revenue, Engineering
Vertical Flow
Goldman Sachs
Saved
Slide with a casual image on the left and a focused, bulleted list on the right, detailing factors that can convert detractors into promoters in the food delivery industry, providing a balance of visual appeal and informative content.
Customer and Market Segmentation
Retail & E-commerce
Offers strategic insights into consumer preferences in food delivery, highlighting key factors that affect customer satisfaction and loyalty, and suggesting ways to improve service quality to increase promoter numbers.
food delivery, customer satisfaction, service improvement, detractors, promoters, Net Promoter Score, loyalty strategies
Agenda
Bain
Saved
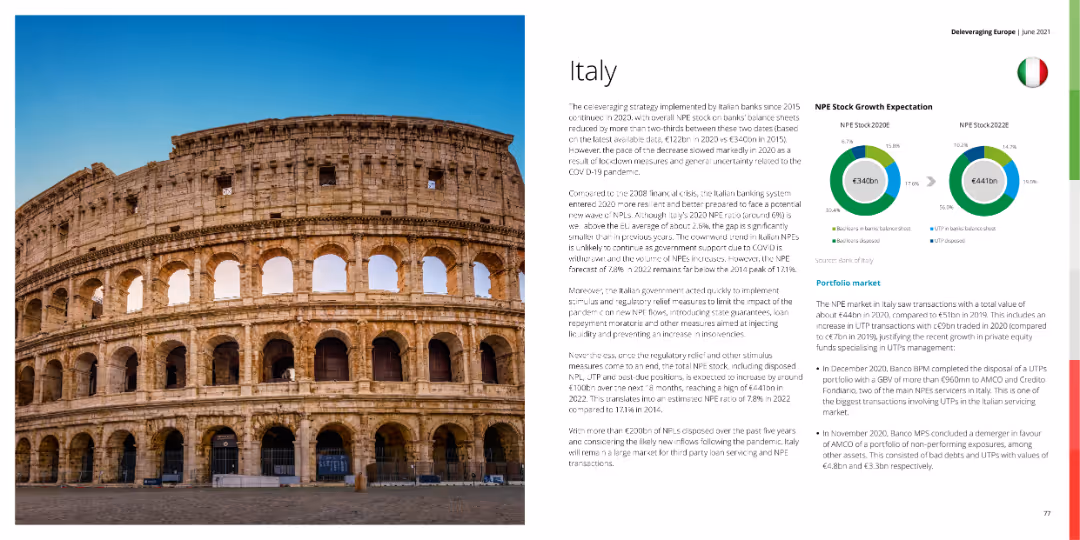
A photo of the Colosseum with circular charts showing NPE stock growth expectation and a detailed text explanation.
Market Analysis and Trends
Financial Services
This slide analyzes Italy's banking system and NPE stock growth expectations, discussing economic impacts and future outlooks.
Italy, NPE stock, banking, financial services, market analysis
Mixed Chart
Deloitte
Saved
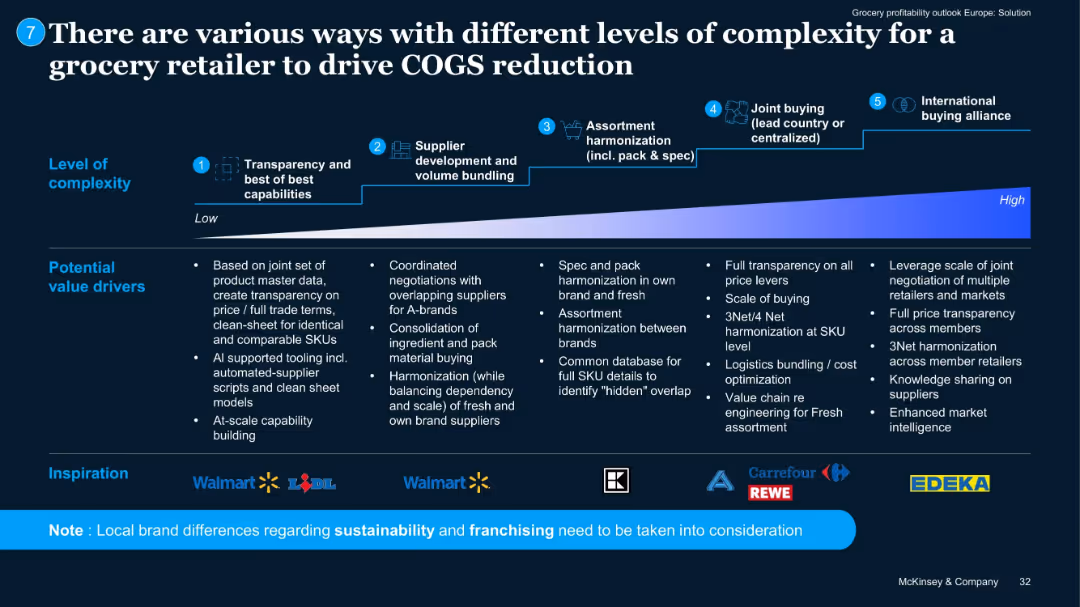
Horizontal flowchart from left to right illustrating 5 levels of complexity with icons/logos of retailers.
Operational Efficiency
Retail & E-commerce
Outlines a maturity curve for COGS reduction, from basic transparency to international alliances. Lists value drivers per stage. Shows examples from Walmart, Lidl, Carrefour, EDEKA, and others.
COGS strategy, sourcing, alliances, complexity, procurement
Pillar
McKinsey
Saved
Column chart showing the Bain Resilience Index scores across various industries like Consumer Products, Industrials, and Retail, with benchmarks for Nordics and advanced economies, presented in grey and purple bars.
Performance Metrics and KPIs
Professional Services
Introduces the Bain Resilience Index, comparing resilience scores across different industries. Valuable for discussions on industry performance, resilience benchmarking, and strategic planning.
resilience, Bain Resilience Index, industry comparison, benchmarking, performance metrics, strategic planning
Single Chart
Bain
Saved
The slide displays a dual-axis line chart of US and Euro area 5yr/5yr inflation swaps from 2005 to 2021. The US is depicted in blue and the Euro area in orange, with both lines fluctuating over time and providing a comparative view of market expectations for inflation.
Investment Analysis
Financial Services
The slide examines market perceptions of inflation through the lens of US and Euro area inflation swaps, suggesting a view of recent increases as mainly transitory. It could be used to inform discussions on investment risk, market sentiment, and long-term economic projections.
Inflation Swaps, Market Sentiment, US, Euro Area, Investment Risk, Economic Projections, Transitory Inflation
Single Chart
JP Morgan
Saved
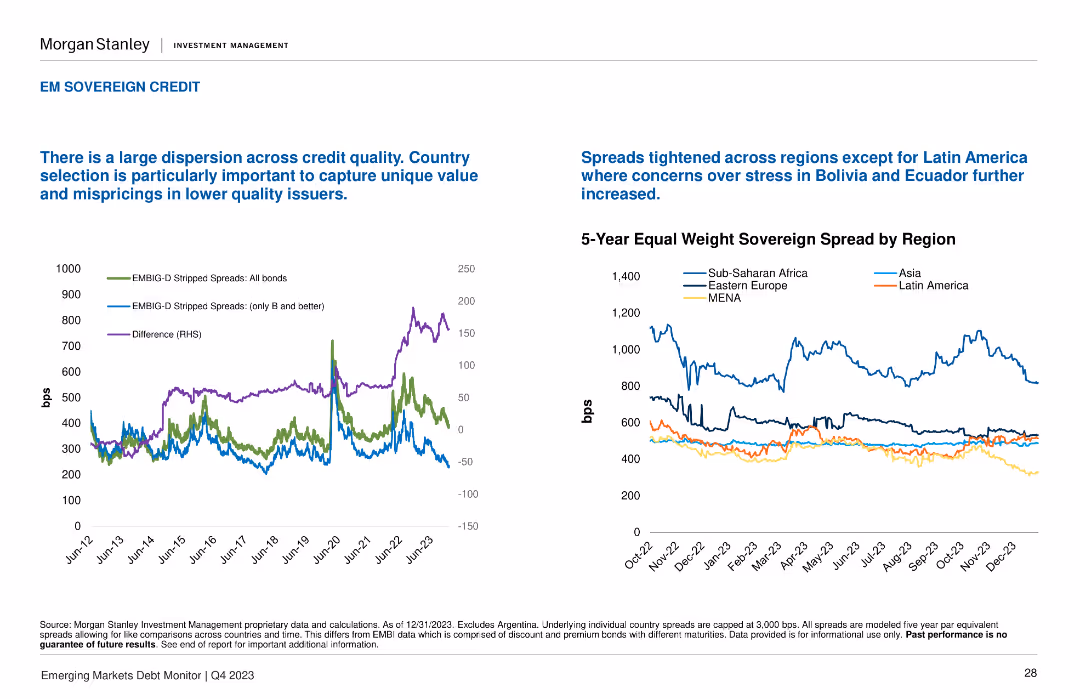
This slide includes two line charts: one showing the EMBIG-D stripped spreads and the other showing the 5-Year Equal Weight Sovereign Spread by Region.
Market Analysis and Trends
Financial Services
It discusses the dispersion across credit quality and the tightening spreads in most regions, except for Latin America. Important for regional credit risk analysis.
credit quality, regional analysis, spreads, EMBIG-D, sovereign
Multiple Chart
Morgan Stanley
Saved
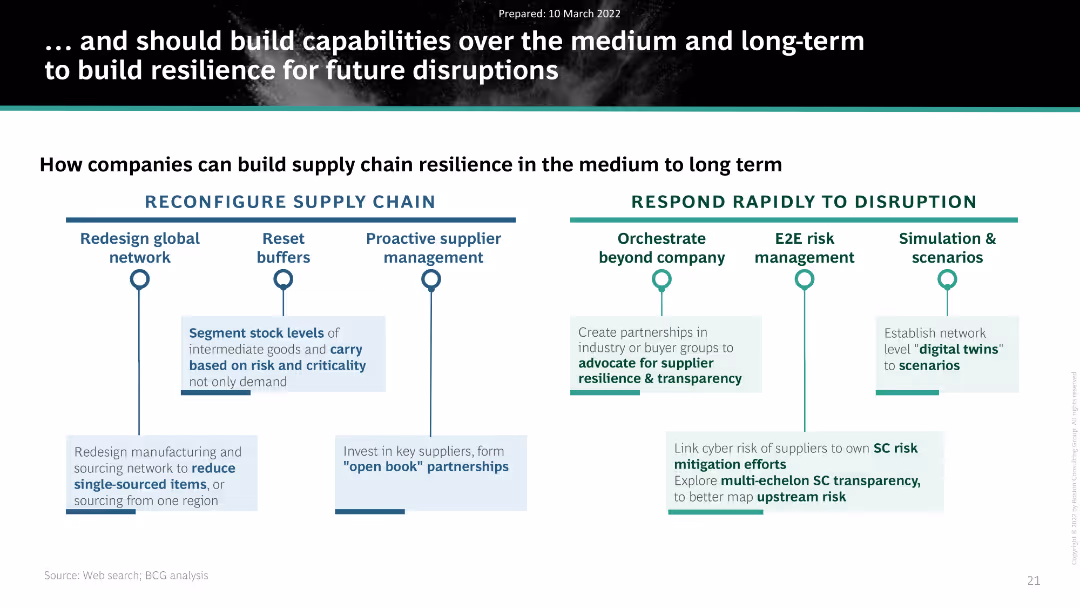
Similar to the previous slide, it uses a two-column format to show strategies for building long-term supply chain resilience.
Strategic Planning
Consumer Goods
It discusses how companies can build resilience in their supply chains over the medium and long term, focusing on various strategic actions.
Supply Chain, Resilience, Strategic Planning, Long-Term, Companies
Header Horizontal
BCG
Saved
Previous
Next
If nothing, comes up, please save your slides first
Create a FREE account to continue browsing
Receive Instant Access to 1,000+ slides from companies like McKinsey, Google, and Goldman Sachs
First Name
Last Name
Email
Password
I agree to all
Terms & Privacy Policy
Thank you! Your submission has been received!
Oops! Something went wrong while submitting the form.
Have an account?
Sign in
Column Chart
Heatmap
Chevron
Org Chart
Infographic
Callouts
Timeline
List
Graphic
Picture
Process Flow
Diagram
Paragraph
Map
Table
Framework
Subtitle
Takeaway Box
Icon
Other Chart
Radar Chart
Waterfall Chart
Mekko Chart
Pie Chart
Scatter Plot
Line Chart
Bar chart
Bullet points


![[Country] needs a strong leader to take the country back from the rich...](https://cdn.prod.website-files.com/654e70fb59937215cac87b19/6899bd3eb729b6bf115e9eef_u0_ZdJ92NzTCNHzn3Ah1dmWgF7vw7YFkZ2bFnbYyaX4.jpeg)