My Account
My Slides
Search by Category
Templates
Leave Feedback
Login
Logout
Get Started
Browse all Slides
Browse all Slides
Create a FREE Account
Instant access to 1,000+ real slides from top companies like McKinsey, BCG, Goldman Sachs, Google and many more!
First Name
Last Name
Email
Password
I agree to all
Terms & Privacy Policy
Thank you! Your submission has been received!
Oops! Something went wrong while submitting the form.
Have an account?
Sign in
Saved Slides
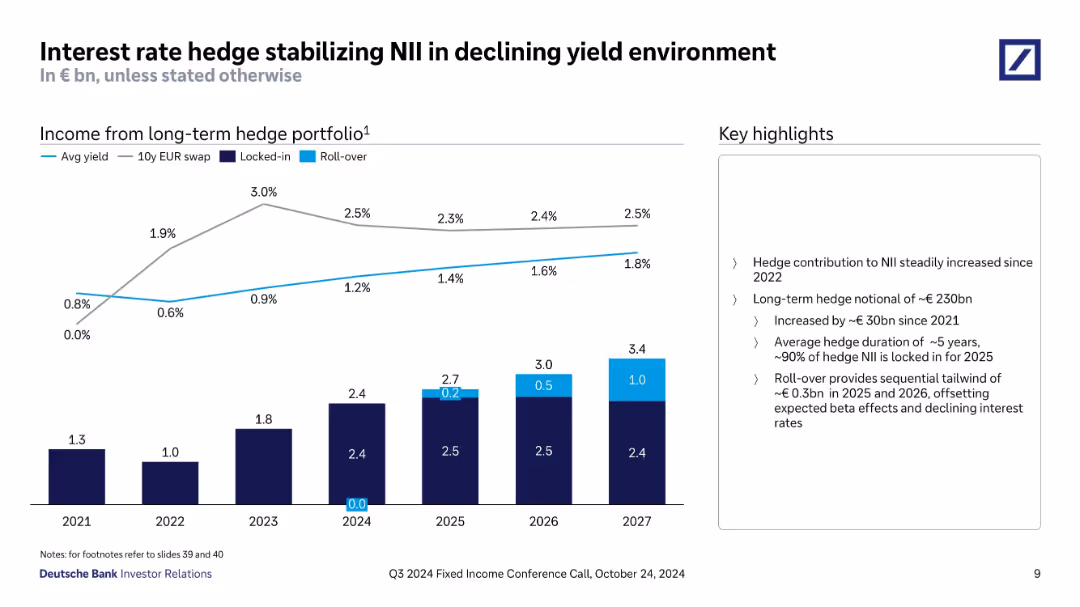
Line and stacked bar chart displaying yield trends and hedge portfolio income by year. Callouts describe hedge strategy components (locked-in vs. rollover). Sidebar includes key strategy metrics.
Risk Assessment and Management
Financial Services
Focuses on how Deutsche Bank's hedge strategy offsets yield declines and stabilizes NII. Displays projected hedge income through 2027 with increasing contributions from rollovers, and explains hedge portfolio size, duration, and income stability.
interest rate hedge, NII, yield environment, hedge duration, rollover, locked-in, hedge income, 2027 forecast
Mixed Chart
Deutsche Bank
Saved
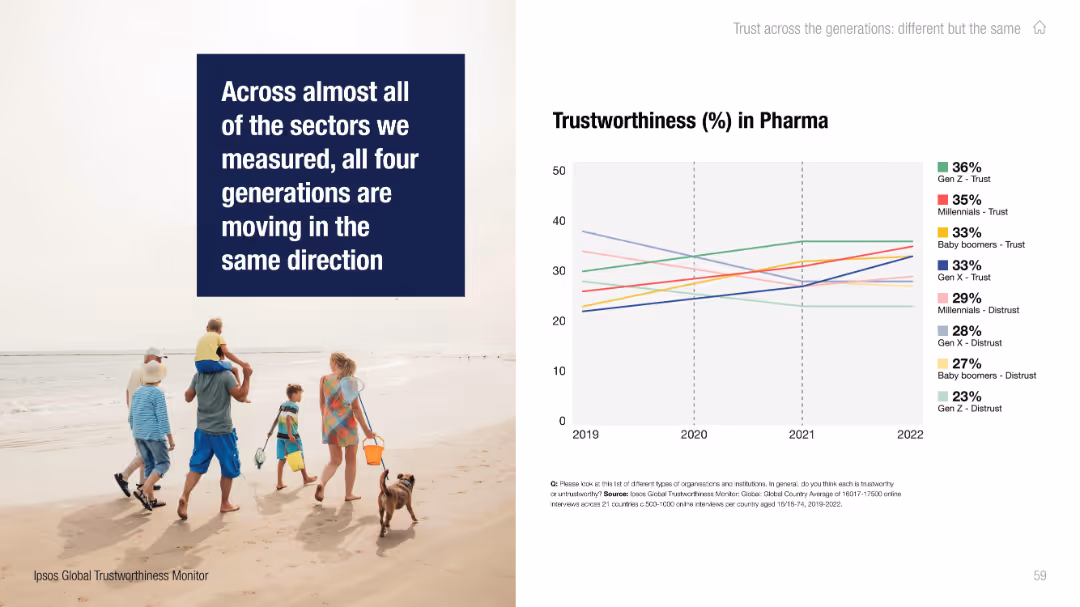
Split layout: photo of family walking on the beach with a bold quote on the left; line chart on the right.
Performance Metrics and KPIs
Healthcare & Pharmaceuticals
The slide highlights generational trends in trust toward the pharmaceutical sector, noting a general increase in trust across generations from 2019 to 2022.
pharma, trust, generational data, Ipsos, Millennials, Gen Z, Baby Boomers, Gen X, trend chart, trustworthiness
Mixed Chart
IPSOS
Saved
Slide with a mix of tables and column charts along with text panels. It shows divisional revenues and key financial statistics like revenues, costs, profits, and balance sheet data. Colors are mainly blue and white, with a clear division of data.
Financial Performance
Financial Services
Analyzing Deutsche Bank's financial performance for Q4 2023, highlighting changes in divisional revenues and key financial metrics such as profit and costs. Aimed at providing a detailed quarterly financial summary to stakeholders.
Q4 2023, financial highlights, revenue, costs, banking
Mixed Chart
Deutsche Bank
Saved
Features a pie chart and bar graphs to showcase e-commerce penetration and growth in tier 2 and tier 3 cities from 2020 to 2025.
Market Analysis and Trends
Retail & E-commerce
Predicts e-commerce market size and penetration, key for businesses and investors to gauge future e-commerce trends and opportunities.
E-commerce, market growth, penetration, tier 2, tier 3, projections, market size, business strategy
Mixed Chart
Kearney
Saved
A column chart showing the most preferred device for video streaming across different age groups, with devices color-coded and arranged vertically.
Market Analysis and Trends
Media & Entertainment
The slide indicates that smart TVs are the most preferred devices for video viewing across all age groups, with a notable preference among older viewers.
video, viewing, devices, age groups, preferences
Single Chart
Nielsen
Saved
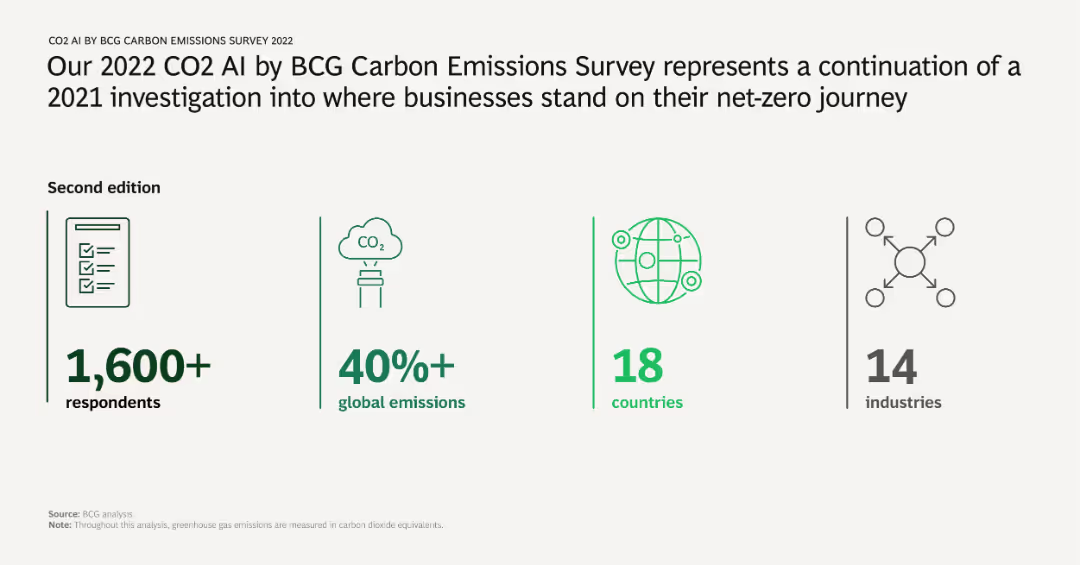
The slide features key statistics from the CO2 AI by BCG Carbon Emissions Survey 2022, including the number of respondents, percentage of global emissions covered, countries involved, and industries surveyed. Icons and brief text highlight these statistics.
Market Analysis and Trends
Environmental Services & Sustainability
Summarizes the scope and reach of the 2022 CO2 AI by BCG Carbon Emissions Survey, indicating the survey's extensive coverage across respondents, global emissions, countries, and industries. This sets the context for the following analysis and findings.
carbon emissions, survey, global reach, industries, respondents
Pillar
BCG
Saved
Three line charts comparing cumulative real wage gaps between nominal wages and consumer prices (CPI) for the US, UK, and Euro area, showing persistent inflation outpacing wage growth and resulting in wage catchup pressures.
Market Analysis and Trends
Professional Services
This slide highlights the persistent real pay gaps over the past two years in the US, UK, and Euro area, suggesting ongoing labor cost pressures as workers seek to restore lost purchasing power due to inflation.
Wage Gap, Inflation, Labor Costs, Real Wages, Purchasing Power
Multiple Chart
Accenture
Saved
This slide features a column chart and a table detailing the breakdown of survey respondents by country, focusing on European countries and a global control set. The layout is structured and uses colors to differentiate between regions.
Market Analysis and Trends
Professional Services
Details the distribution of survey respondents across multiple countries, with specific emphasis on European nations. Useful for analyzing demographic trends and the geographic distribution of survey participation.
survey respondents, demographics, global control, Europe
Single Chart
PwC/Strategy&
Saved
The slide includes a vertical bar chart comparing net agreement with the statement on global citizenship across various countries.
Market Analysis and Trends
Technology & Software
The slide presents survey data showing mixed feelings about global citizenship, particularly in emerging markets.
Global citizenship, emerging markets, survey, public opinion, international trends
Mixed Chart
IPSOS
Saved
Comparative layout with graphics representing different types of connectivity technology across a spectrum.
Product and Service Analysis
Technology & Software
Detailed explanation of various connectivity technologies and their implications for digital solutions.
Connectivity, Technology, 5G, 6G, Wi-Fi, Satellites, Digital Solutions
Header Horizontal
McKinsey
Saved
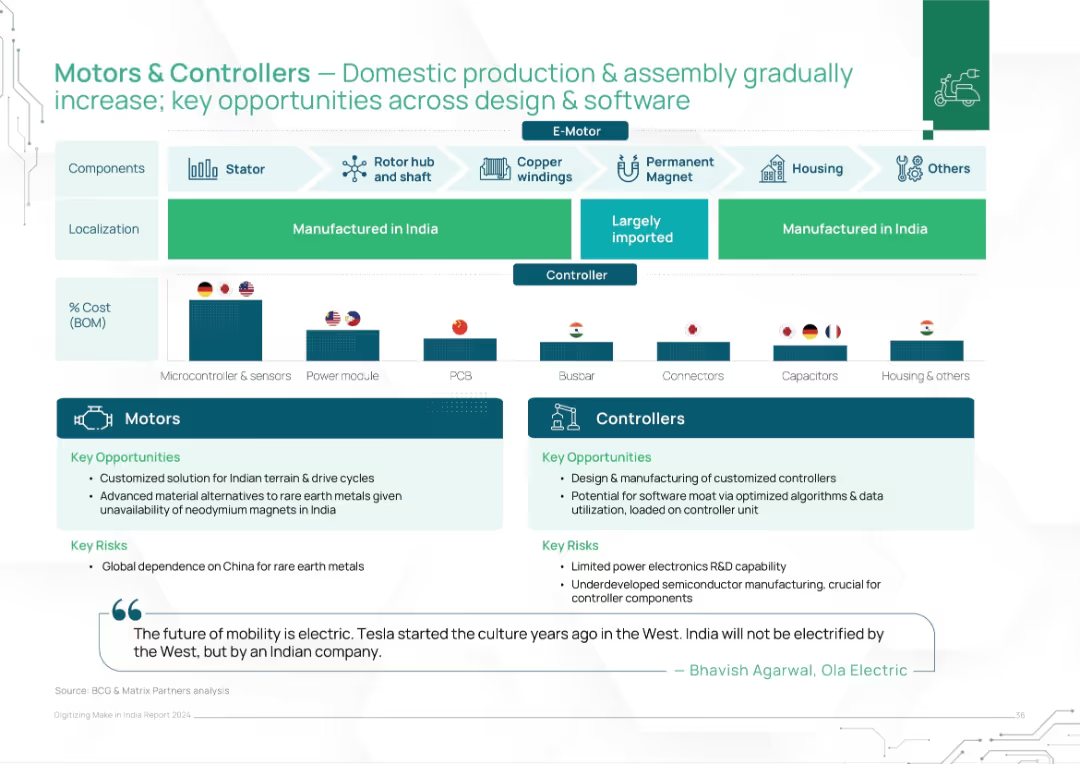
Split block layout separating motor and controller components with localization, cost %, and opportunity/risk sections. National flag icons denote sourcing.
Operational Efficiency
Industrial & Manufacturing
This slide outlines the domestic manufacturing potential for electric vehicle motors and controllers, showcasing localization levels, cost structures, and sourcing countries. It identifies key opportunities in customization, software design, and material innovation, while also flagging risks like rare earth dependence and limited semiconductor capabilities.
motors, EV, localization, manufacturing, India, components, electronics, rare earths, cost structure, R&D
Mixed Chart
BCG
Saved
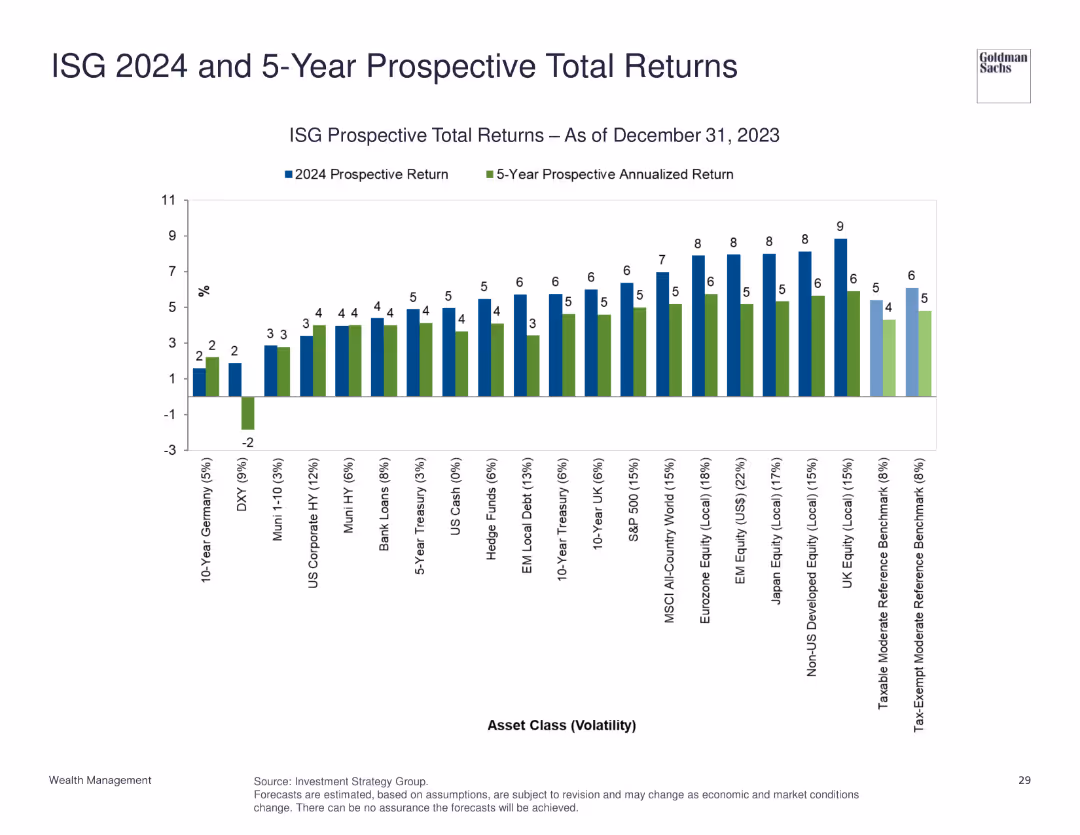
The slide shows a bar chart comparing prospective total returns and 5-year prospective annualized returns for various asset classes as of December 31, 2023.
Investment Analysis
Financial Services
This slide provides prospective total returns and annualized returns for different asset classes, assisting in investment decision-making.
prospective returns, asset classes, annualized returns, investment, financial projection
Single Chart
Goldman Sachs
Saved
This slide features multiple column charts comparing the impact of generative AI on different countries and industries. It uses shades of purple to differentiate between augmentation and automation potential, with detailed percentage labels for clarity.
Technology and Digital Transformation
Technology & Software
Analyzes the projected impact of generative AI on working hours across various industries and countries.
AI, Work, Automation, Augmentation, Industries, Countries, Impact, Technology, Labor
Multiple Chart
Accenture
Saved
The slide shows bar charts comparing concerns of different generations about technology impacting their jobs and the adequacy of training provided by employers.
Market Analysis and Trends
Professional Services
Examines generational differences in perceptions of technology's impact on job security and training adequacy. It serves to inform HR strategies to address specific concerns and training needs across different age groups, promoting a more inclusive approach to technology adoption in the workplace.
generational impact, technology training, job security, HR strategies, workforce development
Multiple Chart
PwC/Strategy&
Saved
Contains pie charts for CRE stress test results, column charts for loan modifications, and textual annotations.
Market Analysis and Trends
Financial Services
Details the scope of CRE under stress tests, loan risk management, and quarter-over-quarter changes in CRE loans and credit loss provisions. Used for financial trend analysis and risk management.
CRE, loans, stress test, risk management, Q3 2023
Multiple Chart
Deutsche Bank
Saved
This slide presents a scatter plot and column chart comparing rail freight costs across different distances and states within Australia, focusing on Western Australia's lower costs.
Market Analysis and Trends
Transportation & Logistics
The slide analyzes rail freight costs in Australia, noting that Western Australia's network is the cheapest due to higher throughput capacity and shorter turnaround times, with detailed comparative data.
Rail freight, Australia, cost analysis, transportation, logistics, Western Australia, cost comparison, market trends
Multiple Chart
LEK
Saved
A complex slide with a balance between text and structured lists, comparing traditional assets under supervision (AUS) and alternative asset strategies.
Market Analysis and Trends
Financial Services
It analyzes a financial institution's asset management depth, contrasting traditional asset supervision with alternative investment strategies, to inform about breadth of offerings and strategic asset allocation.
asset management, strategy, investment, traditional, alternatives
Table
Goldman Sachs
Saved
Two column charts depicting the average product lifetime and percentage of revenue from long-life product designs. The charts are effectively labeled to show various time spans and revenue percentages.
Product and Service Analysis
Environmental Services & Sustainability
Summarizes survey results on product lifetimes and the economic contribution of long-life product designs, emphasizing the need for enhanced durability and modularity in products.
Product Life, Durability, Revenue, Survey, Sustainability
Multiple Chart
Accenture
Saved
Similar to the previous slide, this one presents data for Great Britain, showing the mean estimate of CO2 emissions from a beef burger and the percentage of respondents who couldn't estimate the distance.
Market Analysis and Trends
Environmental Services & Sustainability
This slide focuses on the British respondents' awareness of the carbon footprint of beef burgers, highlighting that 83% couldn't estimate the distance, with an average estimate of 24 miles.
Carbon footprint, beef burger, emissions, Great Britain, public perception
Mixed Chart
IPSOS
Saved
The slide contains a bubble chart and various company logos with financial data. It is divided into two main sections, showing local execution platform and cooperation details.
Market Analysis and Trends
Financial Services
The slide highlights Credit Suisse's position in Investment Banking in Switzerland, showing execution platform details and cooperation with other divisions.
Investment Banking, Switzerland, market analysis, execution platform, cooperation
Mixed Chart
Credit Suisse
Saved
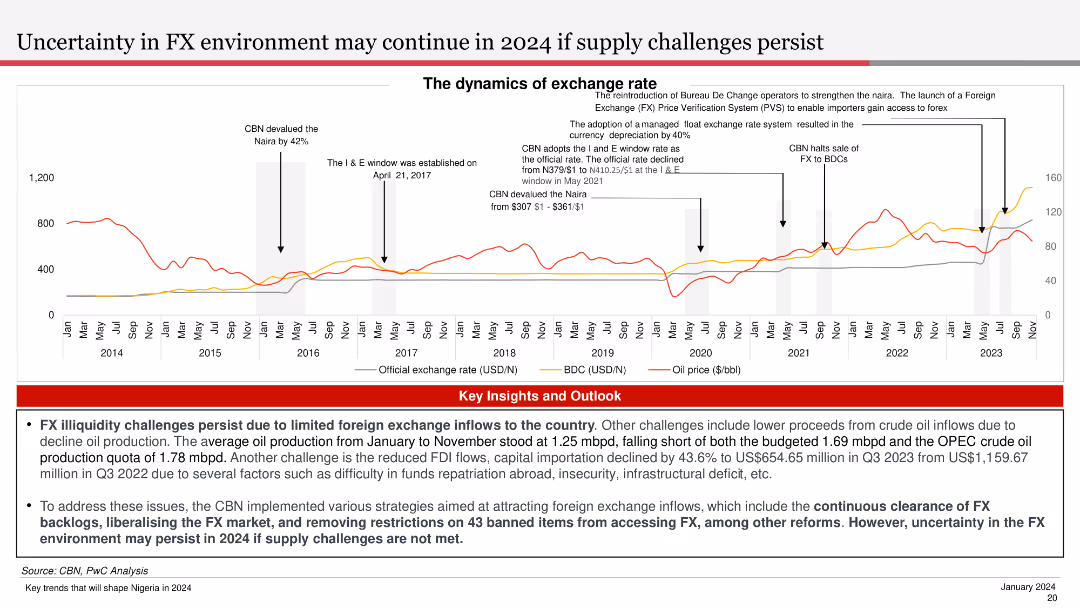
The slide features a line chart showing the exchange rate trends and oil price over time. It is visually complex, designed to provide a clear comparative analysis of key financial metrics.
Market Analysis and Trends
Financial Services
The slide discusses the dynamics of the exchange rate environment, highlighting challenges due to limited foreign exchange inflows and the impact of oil production and other factors.
FX, Exchange Rate, Oil Price, Trends, Dynamics
Mixed Chart
PwC/Strategy&
Saved
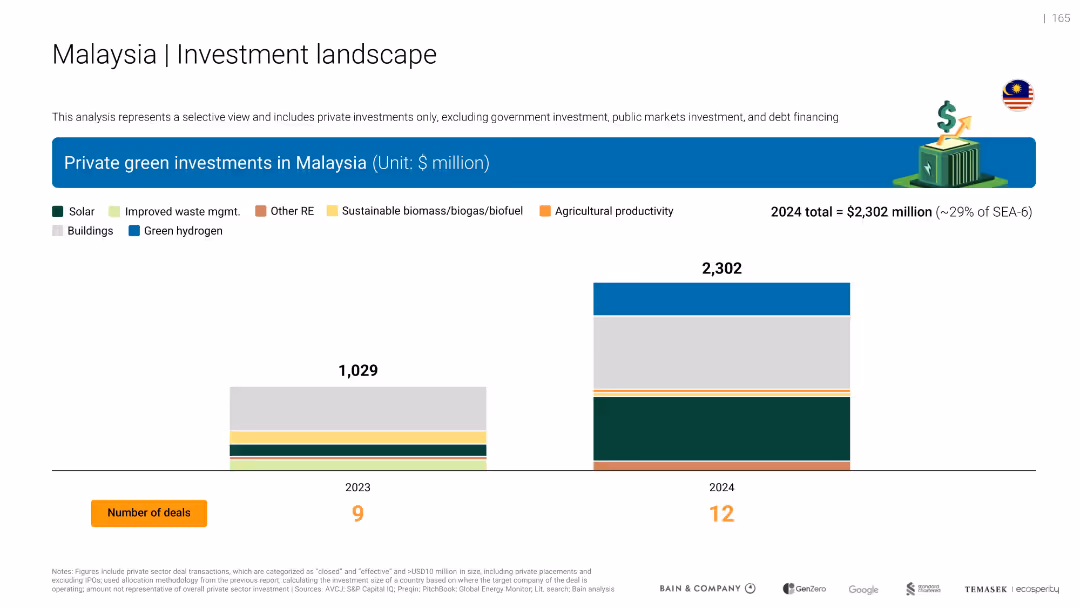
Stacked bar charts (2023 vs 2024) of green investment types with legend and total values
Financial Performance
Environmental Services & Sustainability
Malaysia saw green investment more than double, reaching $2.3B in 2024. Major contributions from solar, building efficiency, and green hydrogen. Deal count also rose from 9 to 12.
solar, efficiency
Single Chart
Bain
Saved
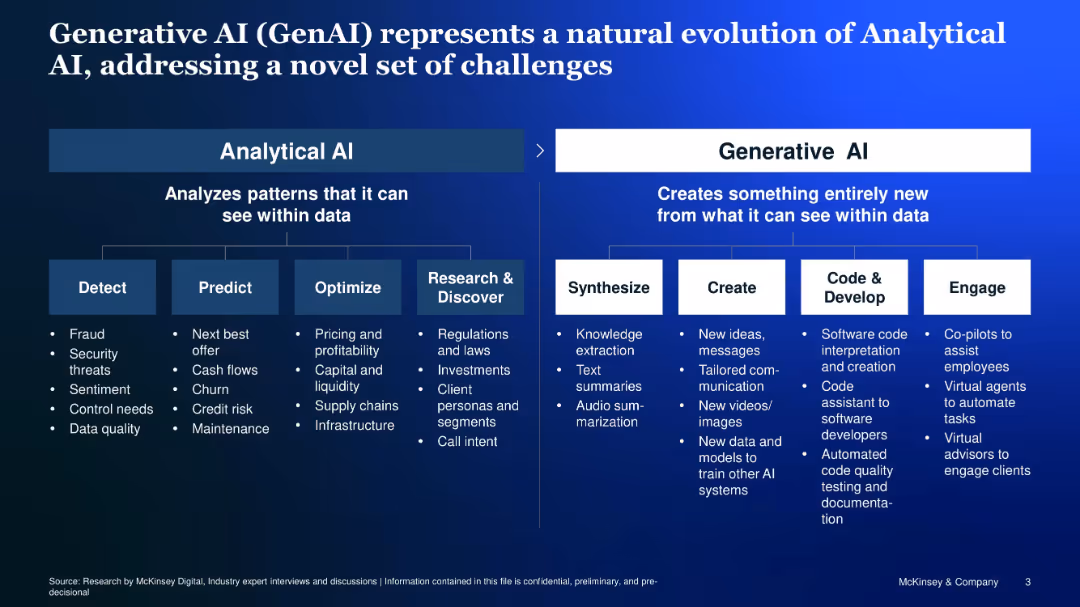
Two-panel comparison of Analytical vs. Generative AI, with icons and structured bullet points
Technology and Digital Transformation
Artificial Intelligence
Compares Analytical AI (focused on detection, prediction, optimization) with Generative AI (focused on synthesis, creation, development, engagement), showcasing how GenAI tackles a new class of problems.
Analytical AI, Generative AI, synthesis, creation, code, co-pilot
Diagram
McKinsey
Saved
Bar chart comparing factors influencing the choice of vehicle brand, differentiated by engine type (EV vs ICE). Multiple data points in a clean, professional layout.
Market Analysis and Trends
Transportation & Logistics
This slide examines the factors driving brand choice for new vehicles, with significant differences between EV and ICE buyers. It highlights the importance of price and product quality.
Brand choice, consumer preferences, EV vs ICE, market analysis, purchasing factors
Single Chart
Deloitte
Saved
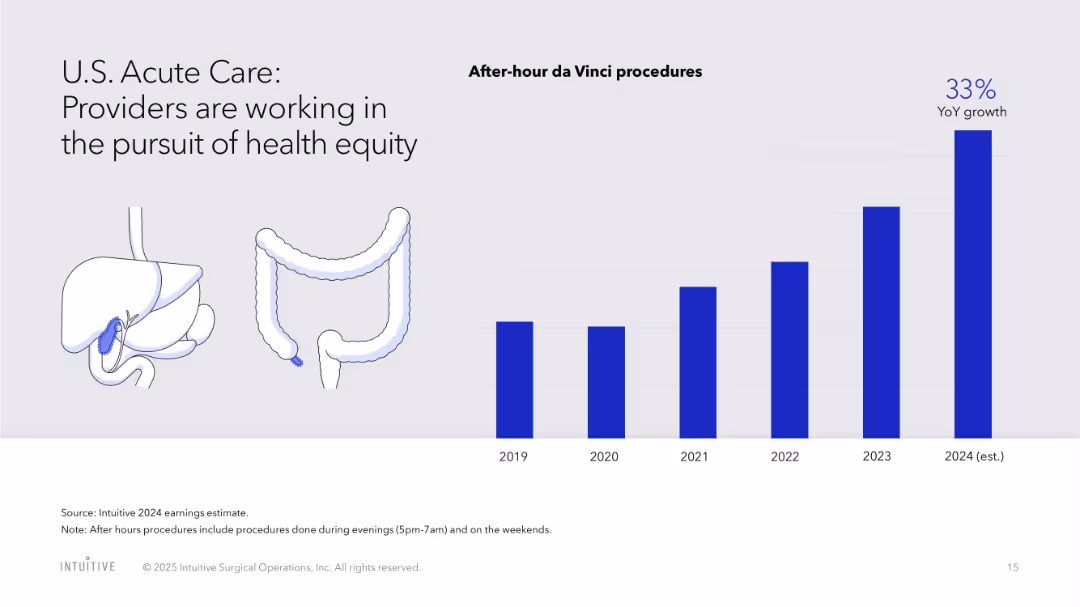
Bar chart for after-hour procedures and illustrative visuals of human anatomy
Human Resources and Talent Management
Healthcare & Pharmaceuticals
Emphasizes the expansion of after-hour da Vinci procedures to enhance healthcare equity, alongside visuals of organs typically treated.
acute care, health equity, after-hours surgery, access, da Vinci, growth, healthcare disparity
Single Chart
JP Morgan
Saved
Previous
Next
If nothing, comes up, please save your slides first
Create a FREE account to continue browsing
Receive Instant Access to 1,000+ slides from companies like McKinsey, Google, and Goldman Sachs
First Name
Last Name
Email
Password
I agree to all
Terms & Privacy Policy
Thank you! Your submission has been received!
Oops! Something went wrong while submitting the form.
Have an account?
Sign in
Column Chart
Heatmap
Chevron
Org Chart
Infographic
Callouts
Timeline
List
Graphic
Picture
Process Flow
Diagram
Paragraph
Map
Table
Framework
Subtitle
Takeaway Box
Icon
Other Chart
Radar Chart
Waterfall Chart
Mekko Chart
Pie Chart
Scatter Plot
Line Chart
Bar chart
Bullet points