My Account
My Slides
Search by Category
Templates
Leave Feedback
Login
Logout
Get Started
Browse all Slides
Browse all Slides
Create a FREE Account
Instant access to 1,000+ real slides from top companies like McKinsey, BCG, Goldman Sachs, Google and many more!
First Name
Last Name
Email
Password
I agree to all
Terms & Privacy Policy
Thank you! Your submission has been received!
Oops! Something went wrong while submitting the form.
Have an account?
Sign in
Saved Slides
The slide presents six column charts showcasing the year-to-date (YTD) performance of the S&P 500 index in terms of earnings growth, P/E ratio, ROE, market cap, beta, and dividend yield.
Performance Metrics and KPIs
Financial Services
This slide offers a YTD performance analysis of the S&P 500 index, highlighting key financial metrics such as earnings growth, P/E ratio, and ROE for the current year.
S&P 500, YTD analysis, earnings growth, P/E ratio, financial metrics
Multiple Chart
Morgan Stanley
Saved
Features bar graphs displaying the percentage of online spending by platform for the years 2020, 2021, and 2022 with clear, labeled sections and percentages.
Market Analysis and Trends
Retail & E-commerce
Highlights the dominance of eCommerce marketplaces in digital shopping space and shows a year-by-year comparison of online spend allocation by platform.
online, marketplaces, e-commerce, shopping, digital, spend allocation, comparison, dominance, platform
Multiple Chart
Bain
Saved
Features stacked column charts for pre-tax income, line graphs for the macroeconomic environment, and quantitative data points.
Financial Performance
Financial Services
Describes the growth of pre-tax income across various business units and macroeconomic conditions.
Pre-tax income, economic growth, GDP growth, federal funds rate, business units
Multiple Chart
JP Morgan
Saved
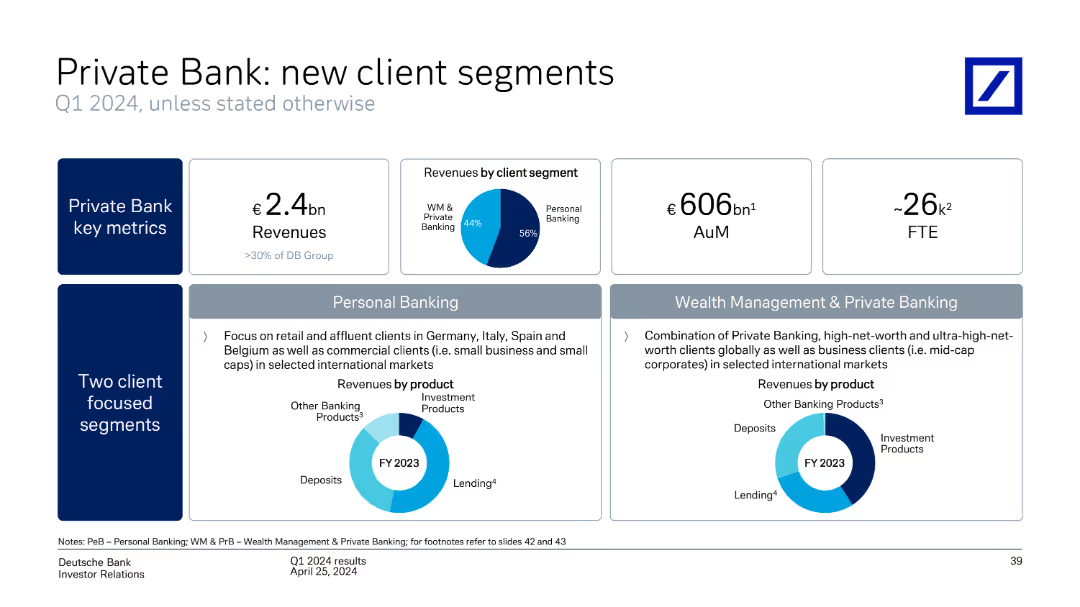
Contains several pie charts and column charts depicting revenues by client segment, assets under management, and new client segments within personal and wealth management.
Customer and Market Segmentation
Financial Services
Analyzes new client segments and key metrics for private banking, highlighting revenues, assets under management, and focused client segments.
private bank, client segments, revenues, assets under management, personal banking, wealth management
Multiple Chart
Deutsche Bank
Saved
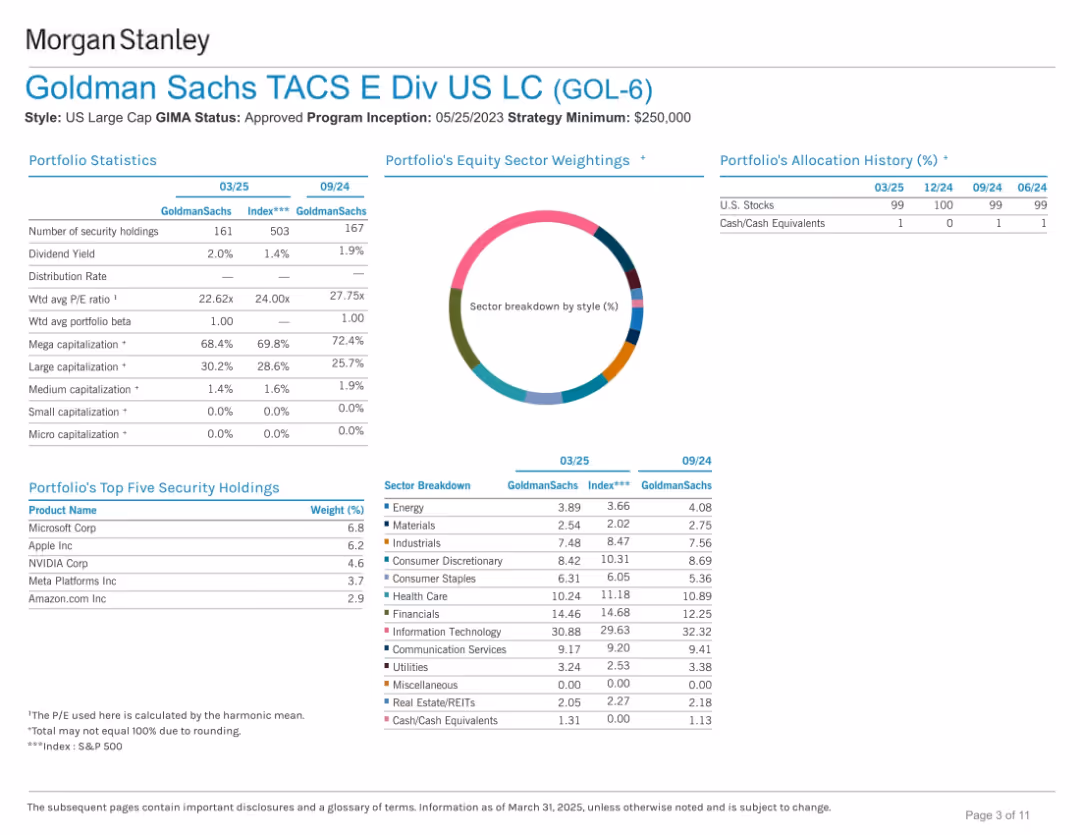
Structured dashboard layout: tables with portfolio stats, sector weighting donut chart, top holdings, and historical allocation. White background, organized layout.
Investment Analysis
Financial Services
This portfolio overview slide summarizes key statistics such as sector exposure, top holdings, and capitalization. It compares current and projected allocations, and sector weights across two quarters. Emphasis is on mega-cap equity exposure and dividend yield.
portfolio, equity, sector allocation, Goldman Sachs, US large cap, holdings, diversification, yield
Mixed Chart
Goldman Sachs
Saved
The slide includes a detailed text description, bullet points, and a graph comparing specific energy and energy density of various fuels.
Technology and Digital Transformation
Energy & Utilities
Provides an overview of hydrogen's properties, advantages, disadvantages, and physical properties, emphasizing its high energy density and applications.
Hydrogen, energy density, properties, advantages, disadvantages
Mixed Chart
Kearney
Saved
A single, wide column chart displaying 5-year spreads for various countries, illustrating the disparity in credit spreads.
Strategic Planning
Financial Services
The slide emphasizes the importance of country selection in investments due to wide variations in sovereign credit spreads, crucial for strategic planning in finance.
sovereigns, credit, spreads, country, selection, investment, strategy, planning, finance, dispersion
Single Chart
Morgan Stanley
Saved
The slide includes a pie chart and a list of areas of expertise in market and opinion research.
Strategic Planning
Professional Services
The slide highlights Ipsos' comprehensive offerings in market and opinion research across different sectors.
expertise, market research, opinion research, Ipsos, sectors, services
Single Chart
IPSOS
Saved
The slide includes pie charts and donut charts illustrating equity investments, debt investments, and consolidated investment entities by vintage, region, and industry. The color scheme uses different shades of blue and grey with clear labels.
Investment Analysis
Financial Services
Describes the asset management portfolio mix, providing insights into equity and debt investments, which is beneficial for investors and managers assessing diversification and investment strategies.
Asset Management, Investment Portfolio, Equity, Debt
Multiple Chart
Goldman Sachs
Saved
Three sections with images and accompanying text, each highlighting different aspects of real estate services. Green, blue, and red color highlights for revenue numbers.
Financial Performance
Real Estate & Construction
The slide compares strategies in commercial real estate services, including term lending, community development banking, and real estate banking, focusing on performance and strategic approaches.
Real Estate, Strategy, Lending, Banking, Performance
Header Vertical
JP Morgan
Saved
Stacked line chart depicting quarterly podcast ad revenues from 2015 to 2020.
Financial Performance
Media & Entertainment
Analyzes seasonal trends and growth in podcast advertising revenues.
podcast, ad revenue, quarterly trends, revenue distribution
Single Chart
PwC/Strategy&
Saved
This slide features a pie chart showing the impact of regulations on short-term rental decisions. Segments include no longer purchase (teal), have tenants rent (light blue), and no impact (dark blue).
Regulatory and Compliance
Real Estate & Construction
The slide analyzes survey data on the impact of short-term rental regulations, indicating how regulatory changes affect investment property purchasing decisions.
short-term rentals, regulations, survey, rental decisions, investment property
Single Chart
IPSOS
Saved
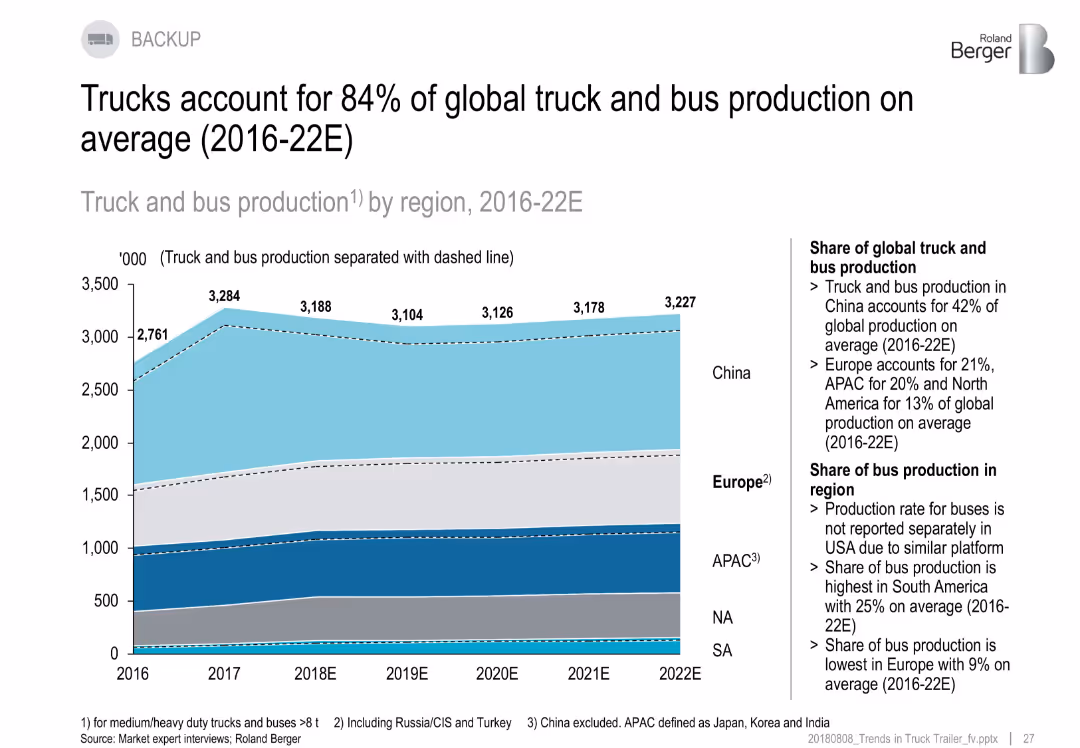
Area chart with shaded regional production segments, notes on right side providing key insights.
Market Analysis and Trends
Industrial & Manufacturing
Trucks dominate global commercial vehicle production, making up 84% on average from 2016–2022. China leads global share (42%), followed by Europe and APAC. Bus production varies significantly by region, being lowest in Europe and highest in South America.
trucks vs buses, regional share, production average, 2016–2022, China, APAC, Europe
Mixed Chart
Roland Berger
Saved
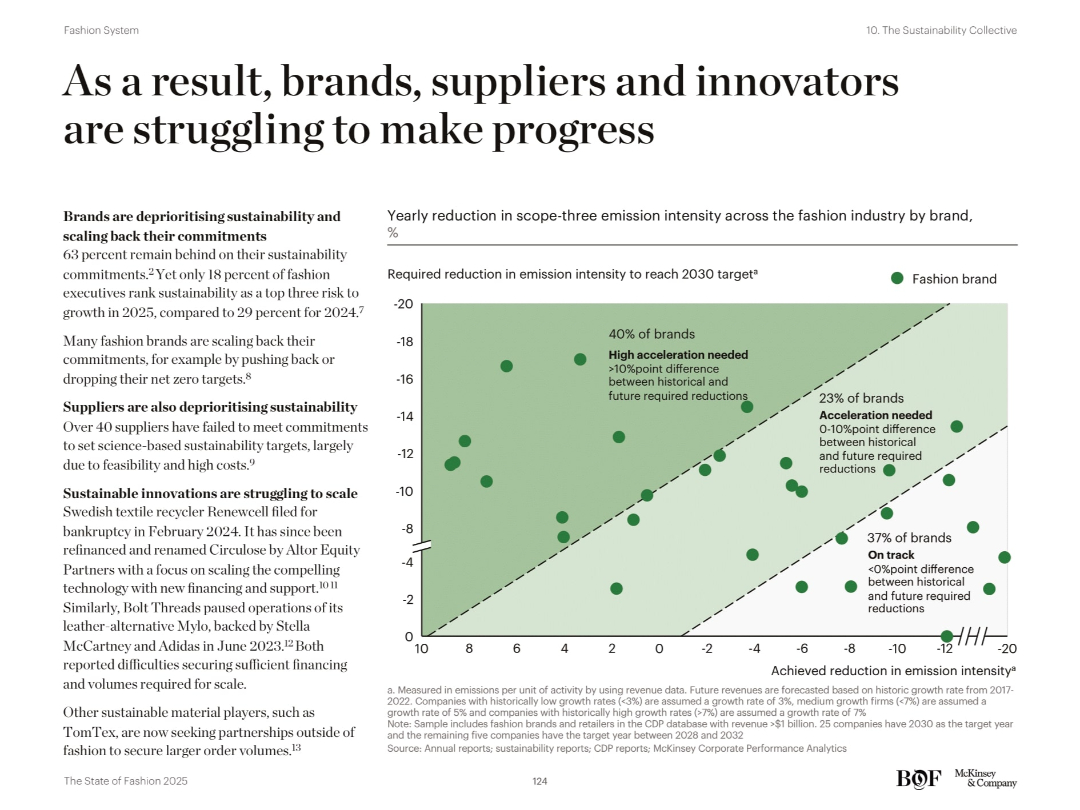
Left-aligned text and right-side scatterplot chart. Text outlines barriers to sustainability progress. The chart maps required vs. achieved emission intensity reductions.
Regulatory and Compliance
Retail & E-commerce
The slide emphasizes the fashion industry's lagging sustainability progress, with many brands deprioritizing climate goals. A scatterplot shows how most brands are far from achieving necessary reductions in emission intensity, revealing urgent gaps in alignment with 2030 targets.
Sustainability, emissions, supply chain, carbon targets, fashion brands, net zero, innovation, scope-three, ESG, green strategy
Mixed Chart
McKinsey
Saved
Slide features colored blocks diagramming key strategies for SEA's Net Zero journey, including energy transition and nature valuation, with supportive icons.
Strategic Planning
Environmental Services & Sustainability
Outlines strategic initiatives for achieving Net Zero in SEA, focusing on energy, agriculture, and waste management, useful for environmental strategists and policy makers.
SEA, Net Zero, strategy, energy transition, nature valuation, waste management, diagram, strategic planning, icons
Pillar
Bain
Saved
Multiple line charts showing sovereign EMD spreads, corporate EMD spreads, and local EMD yields over time.
Market Analysis and Trends
Financial Services
Updates on emerging market bonds with data on sovereign and corporate EMD spreads, and local EMD yields, providing a comprehensive view of the emerging markets bond environment.
Emerging markets, bond spreads, yields
Multiple Chart
Morgan Stanley
Saved
Three circle diagrams and a column chart depict consumer preferences for domestic vs. foreign vehicle brands and the importance of local manufacturing. Clear, minimalistic design.
Market Analysis and Trends
Transportation & Logistics
This slide explores consumer attitudes towards domestic versus foreign vehicle brands and the importance they place on local manufacturing, showing a predominant indifference to brand origin if the vehicle meets their needs.
Brand preference, consumer behavior, domestic vs foreign, local manufacturing, vehicle purchase
Mixed Chart
Deloitte
Saved
A stacked column chart illustrates the segmentation of the tourism industry in Europe by revenue, highlighting the high-end sector.
Market Analysis and Trends
Hospitality & Tourism
Discusses the market size and economic value of the high-end tourism sector within the broader European tourism industry.
High-end tourism, Market segmentation, Revenue, Europe
Multiple Chart
Bain
Saved
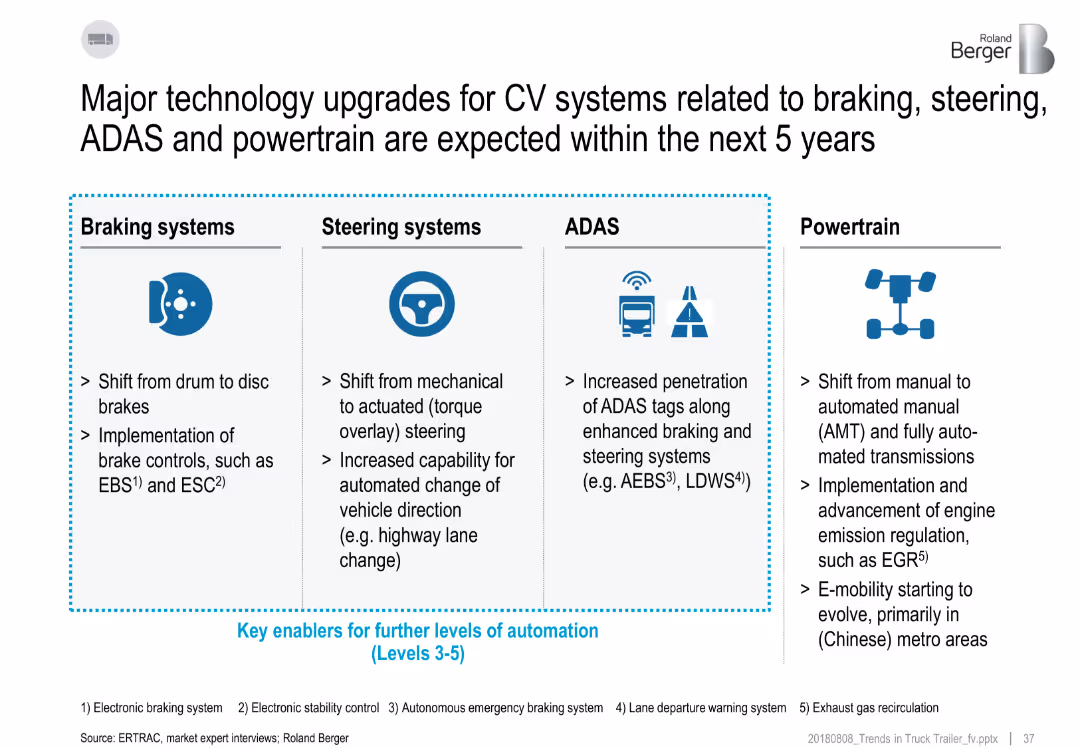
4-column layout detailing advancements in braking, steering, ADAS, and powertrain systems; includes icons and bullet points
Technology and Digital Transformation
Industrial & Manufacturing
This slide outlines expected advancements in commercial vehicle systems over five years. Braking will shift to disc systems, steering will become actuated, ADAS will expand with automated features, and powertrains will move to automation and e-mobility. These are seen as enablers for higher vehicle automation levels.
CV systems, braking, steering, ADAS, powertrain, automation, trends, upgrades
Pillar
Roland Berger
Saved
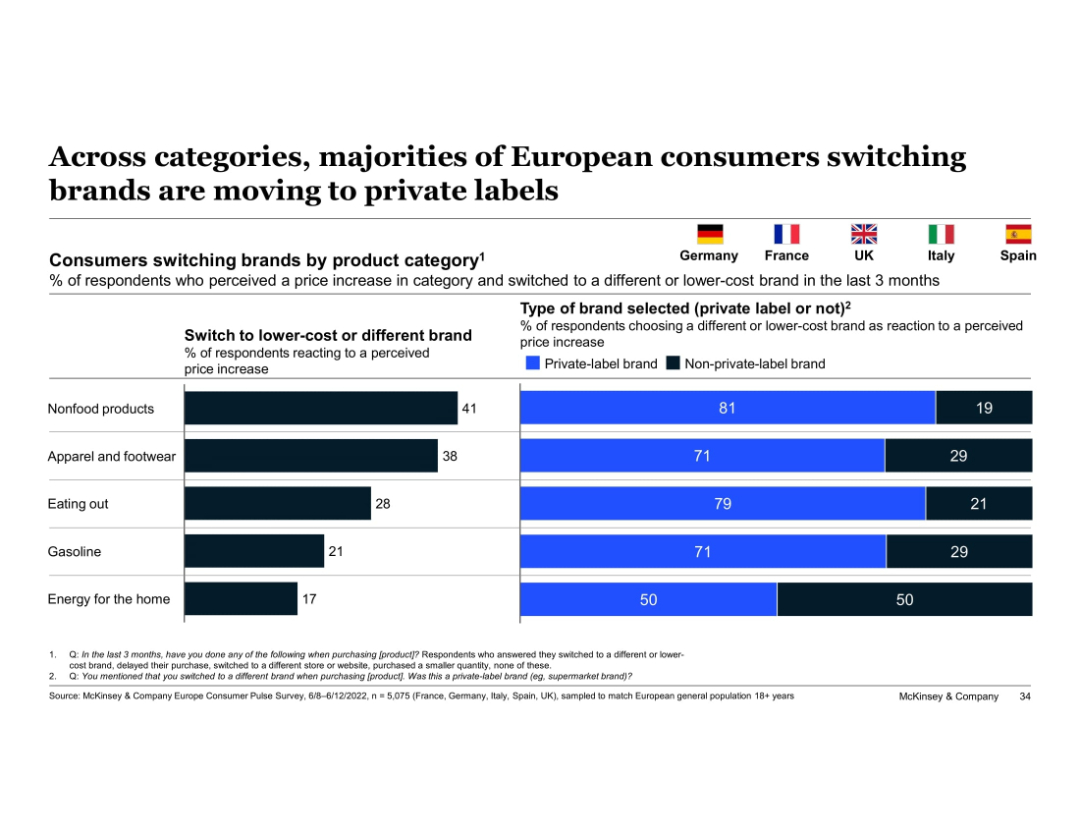
Split bar chart and horizontal bars; flags represent countries; uses blue and black color coding
Customer and Market Segmentation
Consumer Goods
Shows the percentage of consumers switching to lower-cost brands by category and highlights the share selecting private-label brands. Key insight: majority prefer private-label options in response to price increases across categories.
private-label, price sensitivity, brand switching, consumer behavior, categories, Europe, McKinsey, apparel, nonfood, eating out
Single Chart
McKinsey
Saved
Slide presents a series of blue column charts tracking EBIT Margin Benefit from Cost Savings over several years.
Financial Performance
Consumer Goods
This slide demonstrates the company’s financial efficiency over time, highlighting consistent cost savings as reflected in EBIT margin improvements.
cost savings, EBIT margin, financial, yearly, analysis
Single Chart
Barclays
Saved
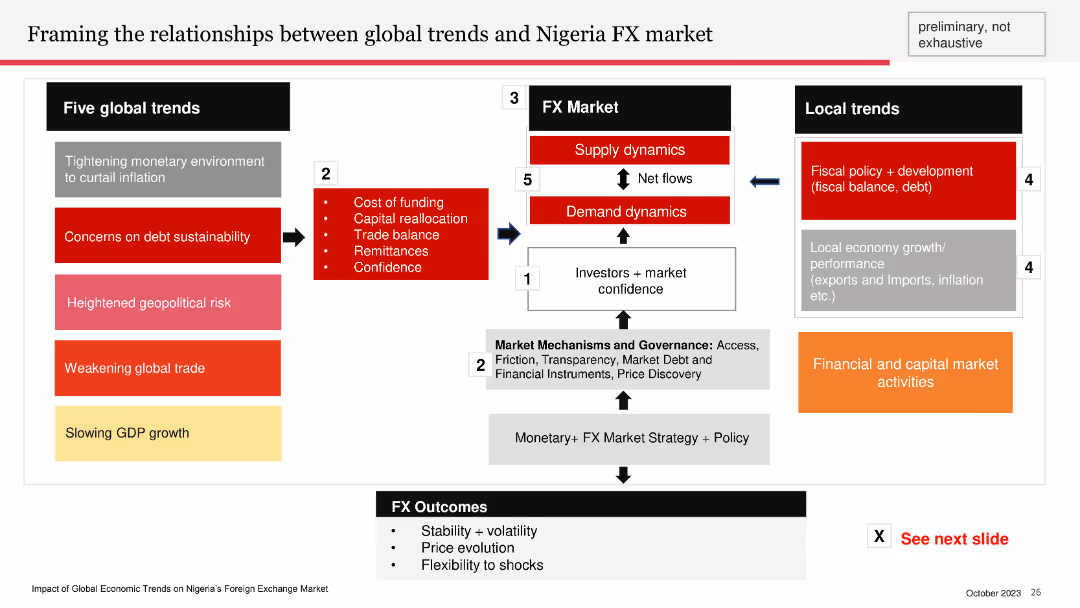
Flow diagram showing the relationships between global trends, the FX market, and local trends in Nigeria. Includes sections on global trends, FX market dynamics, and local trends.
Market Analysis and Trends
Financial Services
The slide frames the impact of global trends like inflation and geopolitical risk on Nigeria's FX market. It details the supply and demand dynamics, fiscal policy, and financial market activities influencing Nigeria's foreign exchange outcomes.
global trends, FX market, Nigeria, supply dynamics, demand dynamics
Diagram
PwC/Strategy&
Saved
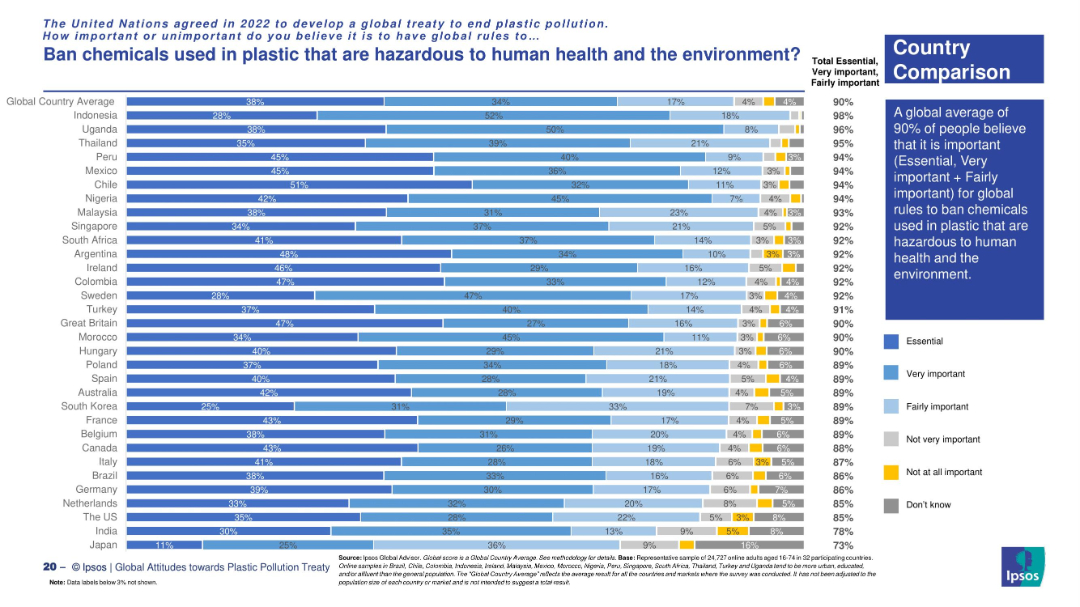
Vertical bar chart showing public opinion across countries. Uses multiple shades to represent importance levels, with a global insight box.
Risk Assessment and Management
Environmental Services & Sustainability
The chart reveals that 90% of global respondents support banning hazardous chemicals in plastics. The strongest support is seen in countries like Indonesia, Uganda, and Peru.
hazardous chemicals, plastic ban, public health, environment, UN treaty, global support, Ipsos
Mixed Chart
IPSOS
Saved
Features a bar chart outlining the percentage of consumers willing to adopt MaaS and preferred transport types included in MaaS.
Strategic Planning
Transportation & Logistics
Details consumer willingness to adopt Mobility-as-a-Service as their primary transport, with a focus on age demographics and preferences for transport types.
MaaS, consumer preferences, transportation types, age demographics, adoption rates
Mixed Chart
Deloitte
Saved
The slide includes a column chart comparing challenges in upskilling initiatives, with different colors representing the beginning and advanced stages of such programs.
Organizational Structure and Change
Professional Services
Discusses the initial challenges organizations face when starting upskilling programs, such as motivation, resource allocation, and employee retention.
Upskilling Challenges, Resource Allocation, Employee Retention, Skill Development
Single Chart
PwC/Strategy&
Saved
Previous
Next
If nothing, comes up, please save your slides first
Create a FREE account to continue browsing
Receive Instant Access to 1,000+ slides from companies like McKinsey, Google, and Goldman Sachs
First Name
Last Name
Email
Password
I agree to all
Terms & Privacy Policy
Thank you! Your submission has been received!
Oops! Something went wrong while submitting the form.
Have an account?
Sign in
Column Chart
Heatmap
Chevron
Org Chart
Infographic
Callouts
Timeline
List
Graphic
Picture
Process Flow
Diagram
Paragraph
Map
Table
Framework
Subtitle
Takeaway Box
Icon
Other Chart
Radar Chart
Waterfall Chart
Mekko Chart
Pie Chart
Scatter Plot
Line Chart
Bar chart
Bullet points