My Account
My Slides
Search by Category
Templates
Leave Feedback
Login
Logout
Get Started
Browse all Slides
Browse all Slides
Create a FREE Account
Instant access to 1,000+ real slides from top companies like McKinsey, BCG, Goldman Sachs, Google and many more!
First Name
Last Name
Email
Password
I agree to all
Terms & Privacy Policy
Thank you! Your submission has been received!
Oops! Something went wrong while submitting the form.
Have an account?
Sign in
Saved Slides
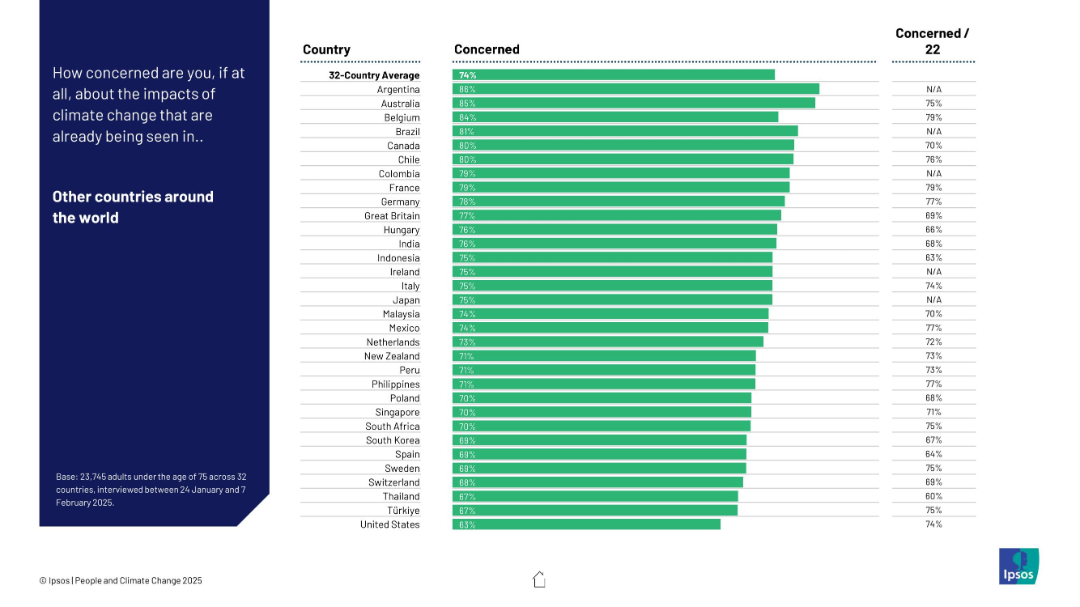
Bar chart sorted by highest to lowest concern; includes previous year’s data; blue background text box to the left.
Market Analysis and Trends
Environmental Services & Sustainability
Shows concern levels regarding climate change impacts globally, not just domestically. Argentina, Australia, and Belgium show the highest levels of concern for other countries.
global concern, empathy, international perspective, Ipsos, environmental perception, trend tracking
Mixed Chart
IPSOS
Saved
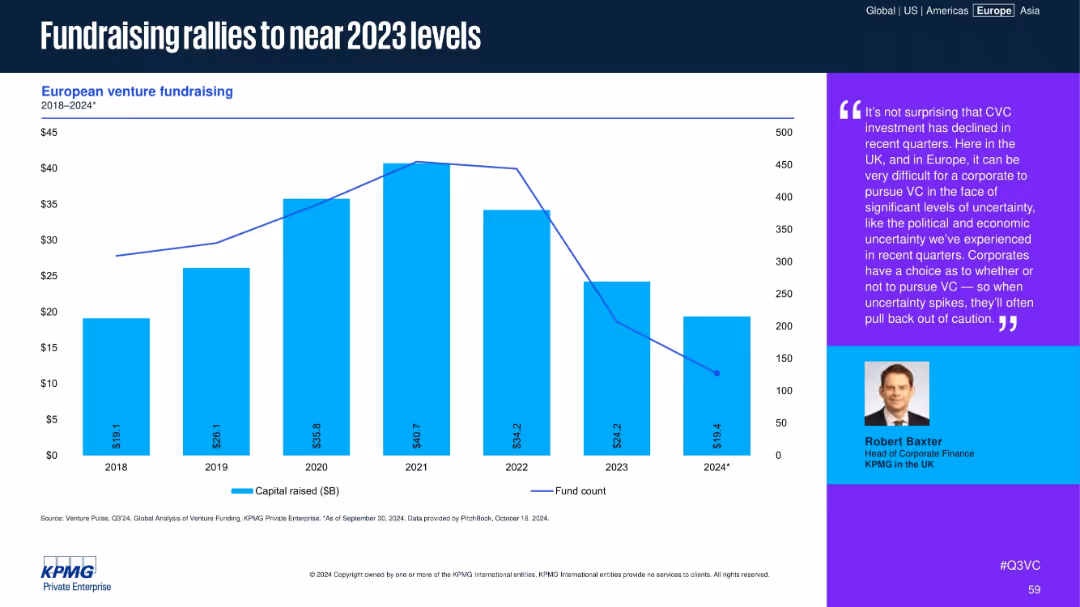
Bar chart of capital raised with line showing fund count, with a commentary sidebar featuring expert quote
Corporate Finance and Valuation
Financial Services
European VC fundraising rebounds in 2024, nearly reaching 2023 levels. Despite a drop in fund count, capital raised is substantial. Commentary highlights how macroeconomic uncertainty affects corporate VC strategies and cautionary pullbacks.
fundraising, VC funds, capital raised, CVC, uncertainty, investor trends
Mixed Chart
KPMG
Saved
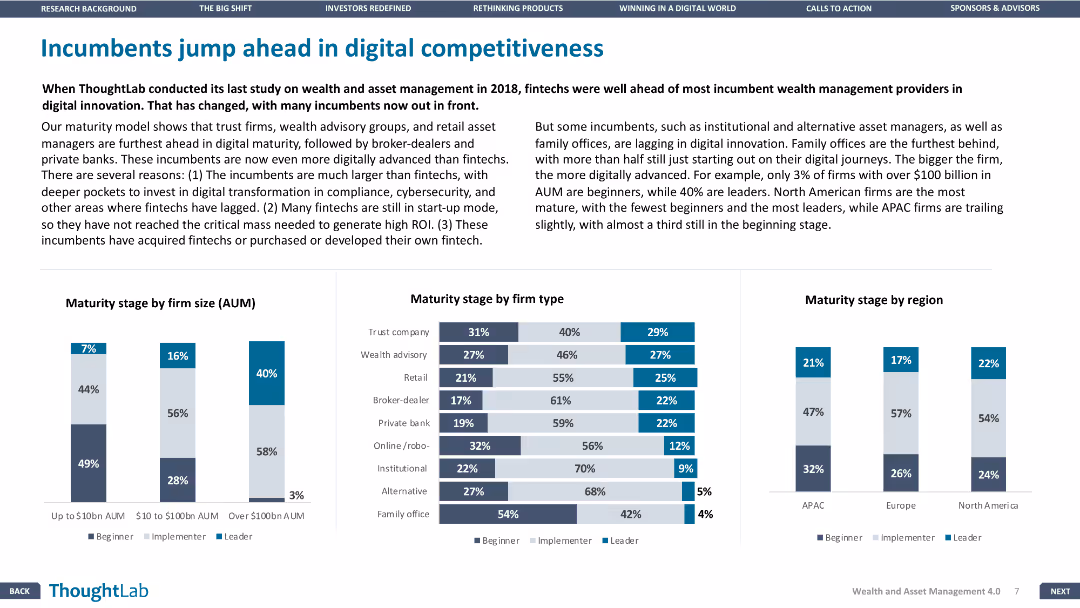
This slide features three column charts comparing maturity stages by firm size, type, and region. Text on the left provides context.
Competitive Landscape
Financial Services
The slide compares the digital maturity of various financial institutions, highlighting the differences in competitiveness by firm size, type, and region.
Digital competitiveness, Financial Services, Maturity, Firm size, Region
Multiple Chart
Deloitte
Saved
A structured list detailing various business, technology, and workforce risks associated with inadequate network infrastructure.
Risk Assessment and Management
Telecommunications
Highlights the key risks businesses face due to inadequate network infrastructure including technology failures and workforce inefficiencies.
business risks, network infrastructure, technology risks, workforce efficiency, cyber security, environmental impact
Diagram
Accenture
Saved
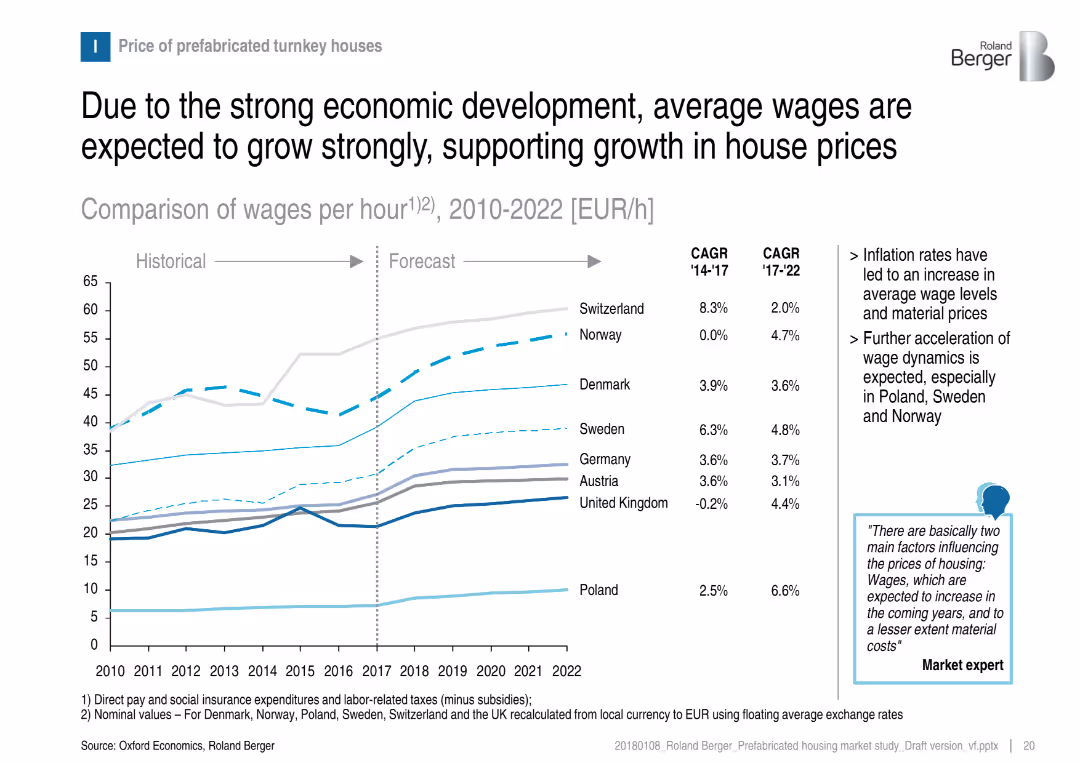
Line graph depicting wage trends per hour from 2010–2022 by country, with CAGR and annotations.
Market Analysis and Trends
Real Estate & Construction
This slide shows average wage growth trends, linking them to rising housing costs. Poland, Sweden, and Norway exhibit the strongest expected wage increases, which are expected to drive housing market prices upward.
wage growth, housing prices, economic development, labor market, cost drivers, prefabricated housing
Mixed Chart
Roland Berger
Saved
Slide includes column charts comparing cost-income ratios and efficiency savings across various business units.
Competitive Landscape
Financial Services
Compares financial efficiency across different sectors of the business from 2021 to 2026.
CIR, efficiency, 2026, comparison, sectors
Multiple Chart
Barclays
Saved
Vertical bar charts compare the main factors of concern for EV charging at public facilities in different regions, using distinct colors for each factor.
Market Analysis and Trends
Transportation & Logistics
This slide covers key issues like charging costs and long wait times at public charging facilities, showing how these concerns vary globally.
Public EV charging, costs, waiting times, regional concerns, charging facilities
Multiple Chart
EY
Saved
Map, pie charts, and segmented lists categorizing industry sectors.
Organizational Structure and Change
Professional Services
Focuses on PwC’s collaborative efforts across Europe, detailing the sectors and industries involved, and the significance of shared expertise and resources.
PwC, collaboration, Europe, industry, sectors
Mixed Chart
PwC/Strategy&
Saved
Text-heavy slide with headings and subheadings, outlining the document's objectives and leadership guidance.
Industry Overview
Government & Public Sector
Summarizes the global impact of COVID-19 and the need for an integrated response from leaders across sectors.
COVID-19, Health Crisis, Leadership, Integrated Response, Societal Impact
Text Only
BCG
Saved
The slide includes a column chart depicting the estimated levelized cost of hydrogen (LCOH) per production technology, with data points for Brown, Blue, Green hydrogen, and an average line. It shows costs in $ per kg for various technologies like SMR, Coal Gasification, and Alkaline Electrolysis.
Financial Performance
Energy & Utilities
The slide compares the estimated LCOH for different hydrogen production technologies, highlighting the cost differences between brown, blue, and green hydrogen sources. It provides a financial analysis of hydrogen production costs.
LCOH, Hydrogen, Cost, Production, Technology
Single Chart
Kearney
Saved
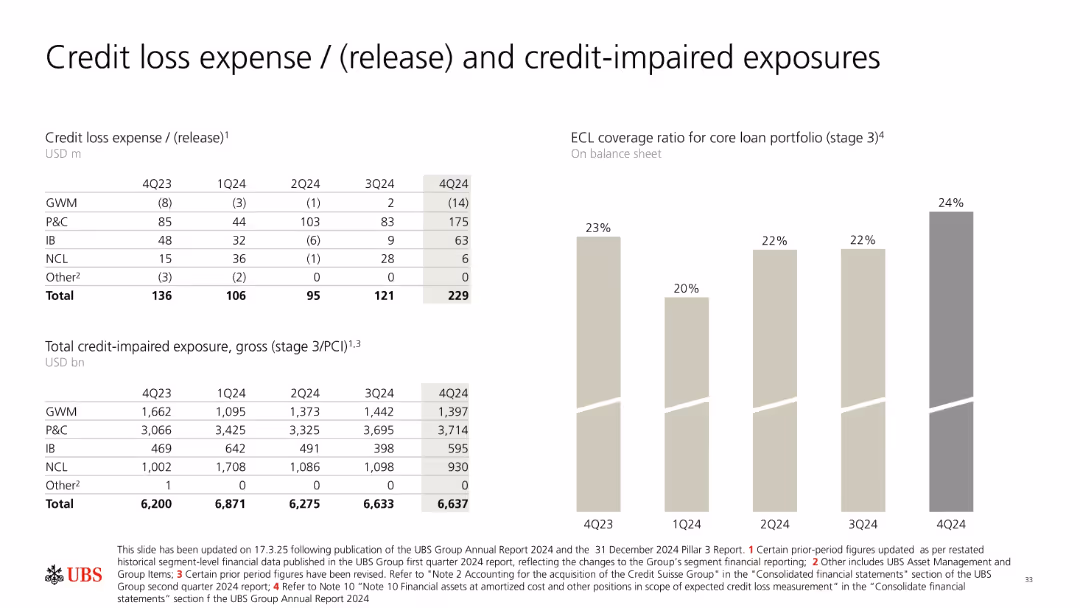
Table of credit loss by business segment and bar chart of ECL coverage ratio; additional table shows total credit-impaired exposure by segment. Simple dual-pane layout.
Risk Assessment and Management
Financial Services
Analyzes UBS’s credit loss expenses across GWM, P&C, IB, NCL segments for the last five quarters and tracks changes in expected credit loss (ECL) ratios. Provides granularity on gross credit-impaired exposures segmented by business line, supporting risk management insights.
credit loss, impairment, ECL, GWM, P&C, risk, UBS
Mixed Chart
UBS
Saved
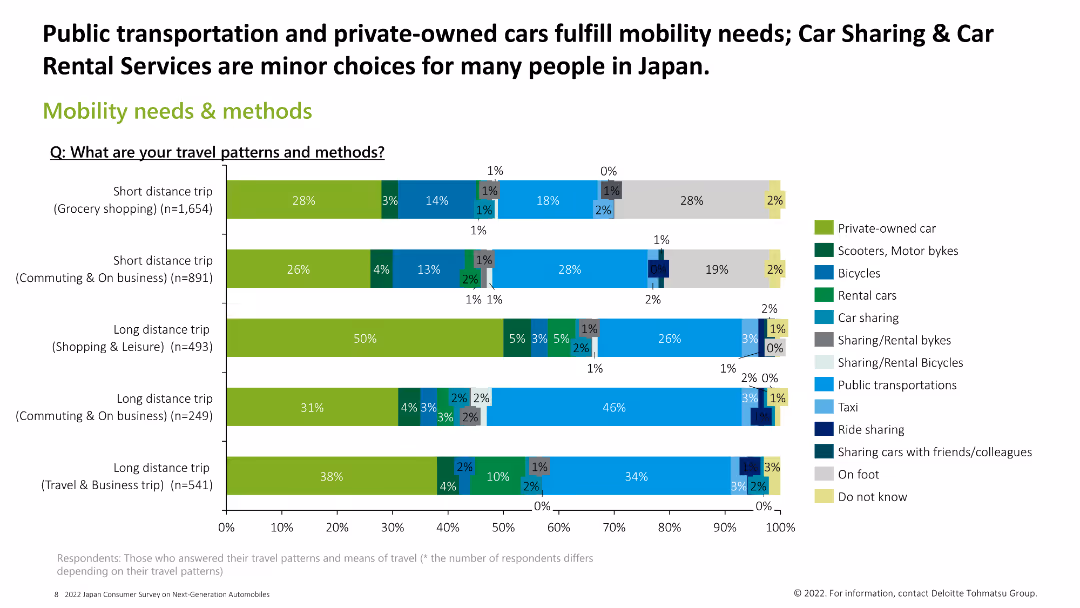
Features a series of horizontal bar charts depicting different travel patterns and methods across various trip types.
Market Analysis and Trends
Transportation & Logistics
The slide presents data on the preferred methods of transportation for short and long-distance trips, showing the distribution of different modes of transport.
transportation methods, travel patterns, survey, mobility needs
Single Chart
Deloitte
Saved
Pie charts and column charts showing the importance and impacts of data-led customer engagement.
Technology and Digital Transformation
Technology & Software
Highlights the strategic importance of data-led customer engagement and its impact on company growth and efficiency.
data-led, growth, efficiency, marketing, sales
Multiple Chart
BCG
Saved
This slide emphasizes expansion strategy with bullet points detailing market attractiveness, cross-LOB customers, omni-channel strategy, and smart footprint, alongside a column chart showing an increase in U.S. customer footprint from 69% to 93%. The layout is clean, with the chart on the right and the bullet points arranged on the left for easy comparison and reference.
Market Analysis and Trends
Financial Services
It explains the bank's strategic approach to market expansion and its effective implementation, as evidenced by growth in U.S. customer reach. It may be used to discuss market development strategies and the rationale behind successful expansions.
market expansion, customer base, strategy, omni-channel
Mixed Chart
JP Morgan
Saved
This slide includes text on energy transitions, along with a graphic showing global final energy demand projections by fuel type and region.
Market Analysis and Trends
Energy & Utilities
The slide explores the varied pace of global energy transitions, predicting significant growth in renewable energy capacity and shifts in final energy demand by 2050.
energy transitions, renewable energy, global demand, fuel types, energy projections
Multiple Chart
EY
Saved
This slide compares targets for financial sustainability between companies, using a split-column layout with an arrow indicating improved targets. Each company has a corresponding quote on the right.
Market Analysis and Trends
Financial Services
The slide shows tech companies like Grab, GoTo, and others, advancing their financial sustainability targets, with quotes from earnings reports to justify the changes.
sustainability, financial targets, tech companies, earnings reports, comparative analysis, revised targets, Grab, GoTo, Bukalapak, Shopee
Table
Bain
Saved
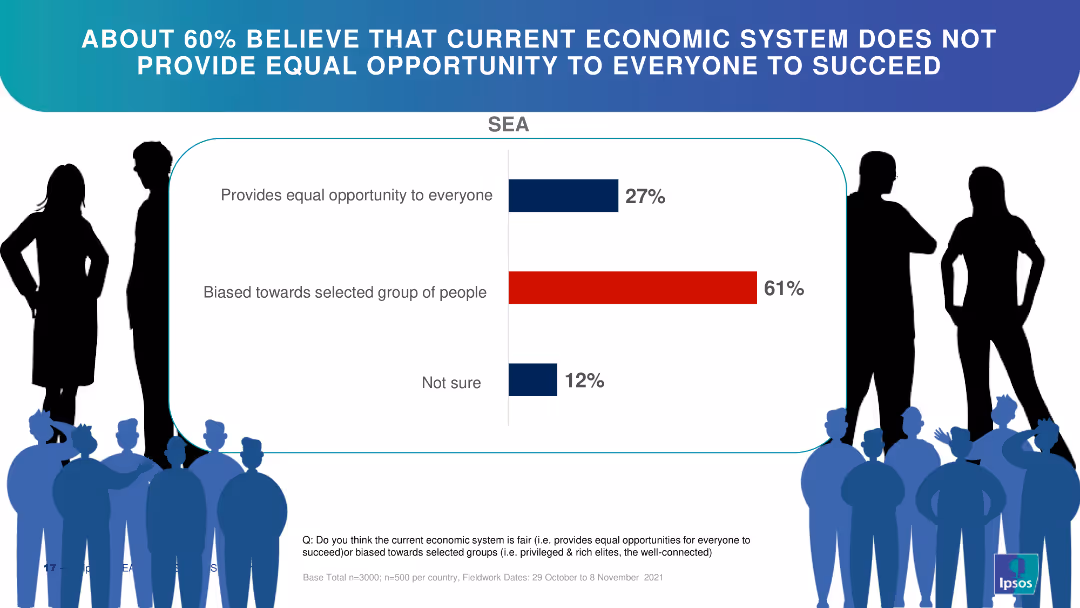
This slide features a horizontal bar chart showing the perceptions of the economic system's fairness. The chart is accompanied by silhouettes of people, enhancing the visual representation of public opinion. The bars are color-coded for clarity.
Market Analysis and Trends
Financial Services
The slide presents survey results indicating that 61% believe the economic system is biased towards a selected group, while only 27% think it provides equal opportunity, and 12% are unsure. It highlights public sentiment regarding economic fairness, which can be used for policy analysis or socio-economic studies.
economic system, survey results, fairness, public opinion, bias
Single Chart
IPSOS
Saved
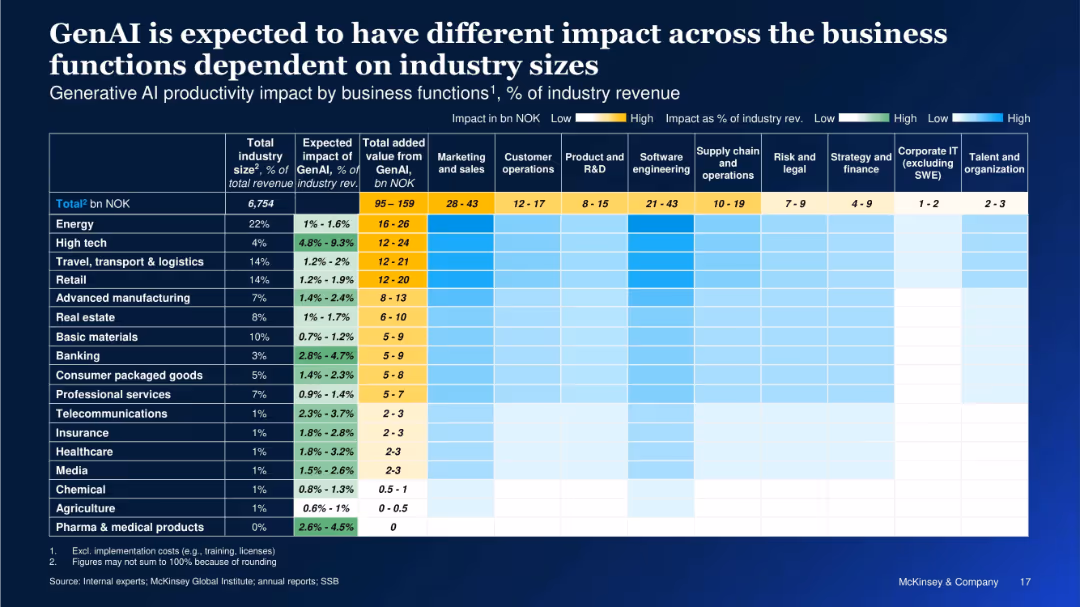
Heatmap and table showing GenAI impact across industries and functions, with percentages and value-added estimates in NOK.
Performance Metrics and KPIs
Artificial Intelligence
This slide quantifies the impact of GenAI across industries and business functions in terms of percentage of industry revenue and NOK value. It highlights where productivity gains are expected to be highest, with columns for different business areas like software engineering and marketing.
GenAI Impact, Industry Revenue, Business Functions, Value Creation, Productivity, Heatmap, Sector Comparison, NOK Value, Revenue Uplift
Single Chart
McKinsey
Saved
The layout includes a header, three columns dividing the content into 'Our Clients', 'Our Business', and 'By the Numbers'. It features icons, bullet points, and column charts with light blue bars representing different financial metrics from 2017 and 2021, demonstrating an increase in each category.
Market Analysis and Trends
Financial Services
This slide highlights the achievements in record revenue and assets under custody for JPMorgan Chase's Securities Services. It provides a breakdown of client types, business services offered, and key financial metrics over time. Suitable for analyzing market trends and discussing strategic planning for business development and operational efficiency.
Securities, Revenue, Assets, Custody, Trading, Data Management, ETFs, Growth, Efficiency, Clients
Multiple Chart
JP Morgan
Saved
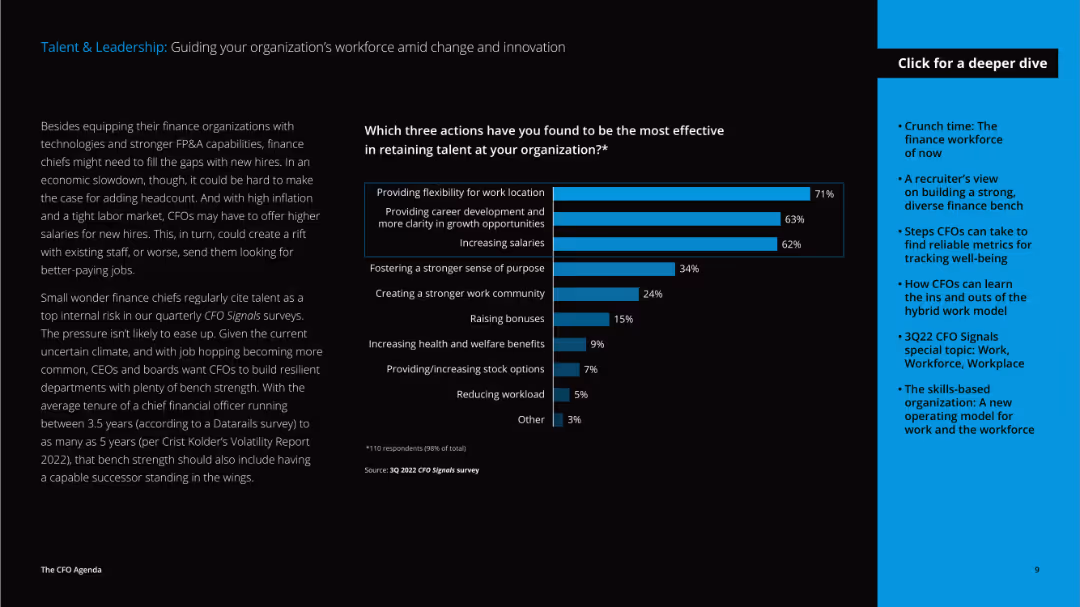
The slide features a detailed text on the left discussing talent retention strategies and a vertical column chart on the right showing effective actions taken by organizations.
Human Resources and Talent Management
Professional Services
The slide discusses strategies for retaining talent, including providing work flexibility, career development, and increasing salaries, highlighting the challenges and solutions CFOs face in talent management.
talent, leadership, workforce, retention, flexibility, career development, salaries, CFO, challenges, solutions
Mixed Chart
Deloitte
Saved
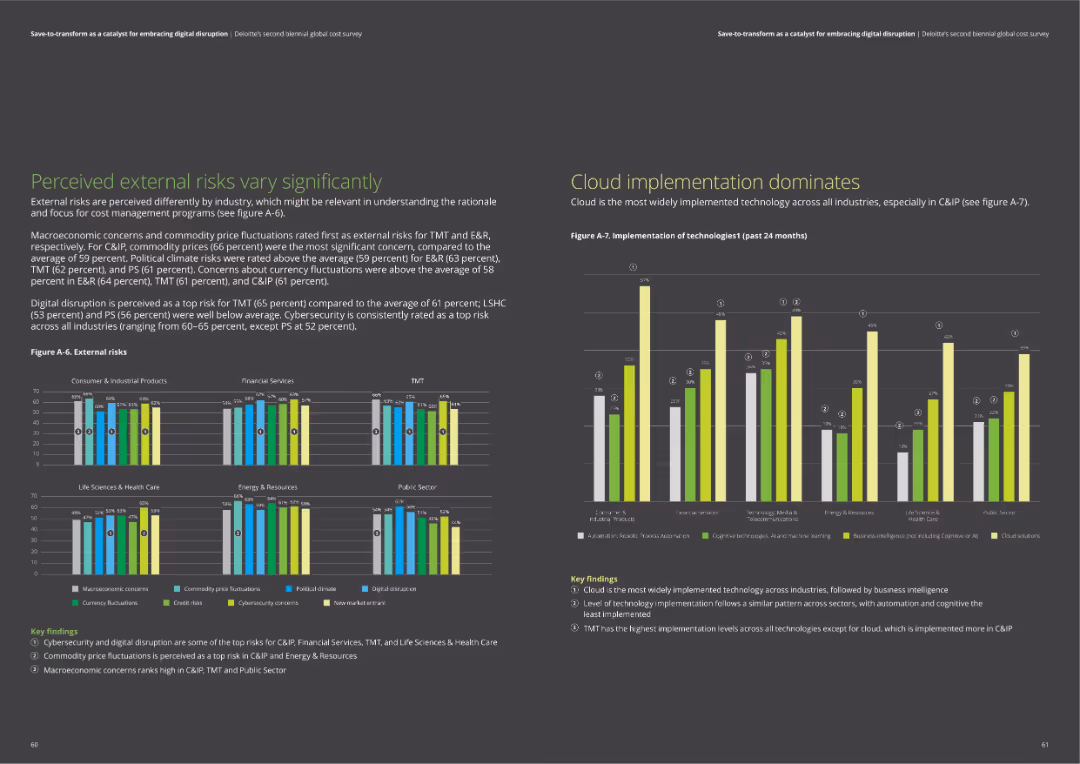
The slide includes bar charts comparing external risks across industries and a chart on the implementation of technologies like cloud and business intelligence.
Risk Assessment and Management
Professional Services
The slide examines perceived external risks such as macroeconomic concerns and digital disruption. It also highlights the widespread implementation of cloud technology and business intelligence solutions across industries.
external risks, cloud technology, business intelligence, macroeconomic concerns, digital disruption
Multiple Chart
Deloitte
Saved
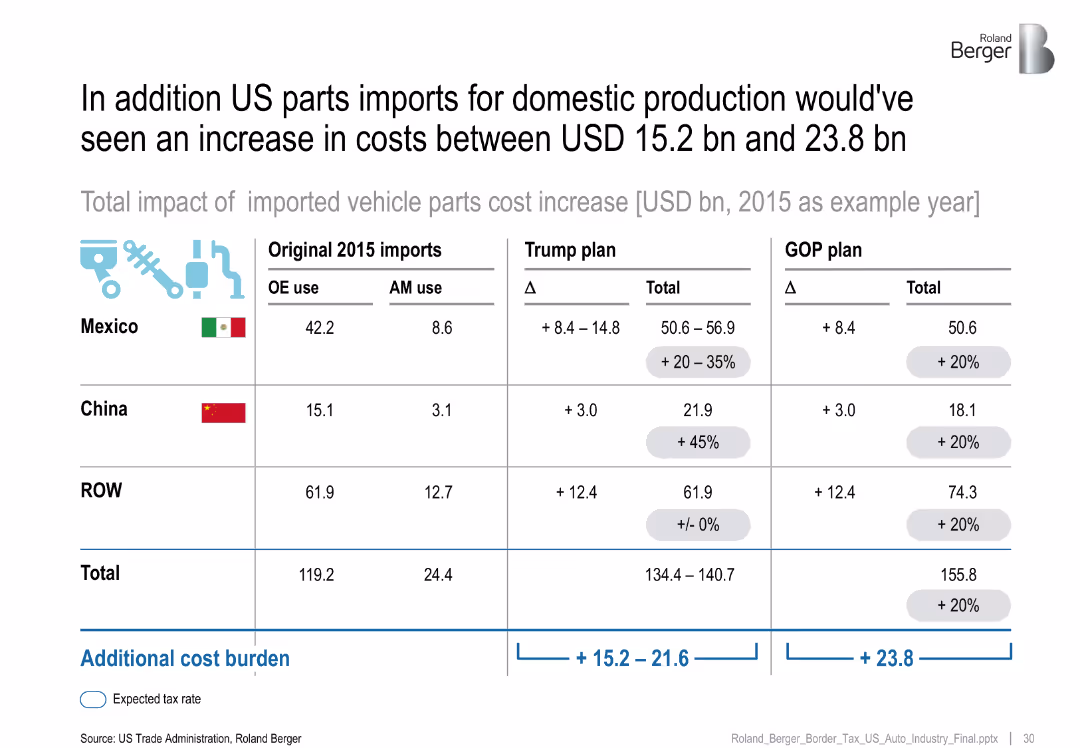
Tabular format breaking down cost increases for vehicle parts imports by source country and use (OE/AM), with changes under Trump and GOP plans
Operational Efficiency
Industrial & Manufacturing
The slide highlights how vehicle parts imports, essential for domestic production, would incur significant cost increases under both tax proposals, especially from Mexico and China.
vehicle parts, import tax, cost increase, GOP plan, Trump plan, OE use, AM use, sourcing impact
Table
Roland Berger
Saved
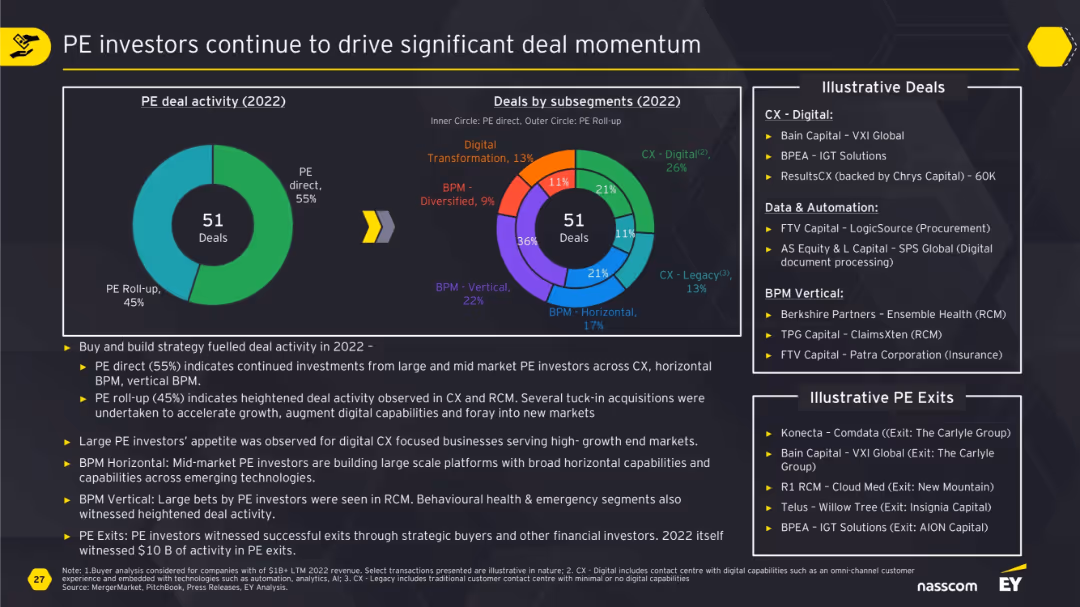
Large doughnut charts split PE direct vs roll-up and subsegment distribution; supported by summary of drivers and illustrative deals/exits.
Investment Analysis
Financial Services
This slide illustrates how private equity continues to drive deal activity, especially in CX and BPM verticals. It differentiates between direct investments and roll-ups, details illustrative transactions, and highlights the strong interest in scalable, digital, and automated capabilities across industries.
PE, investment, CX, BPM, roll-up, digital, deal momentum, exits, RCM
Multiple Chart
EY
Saved
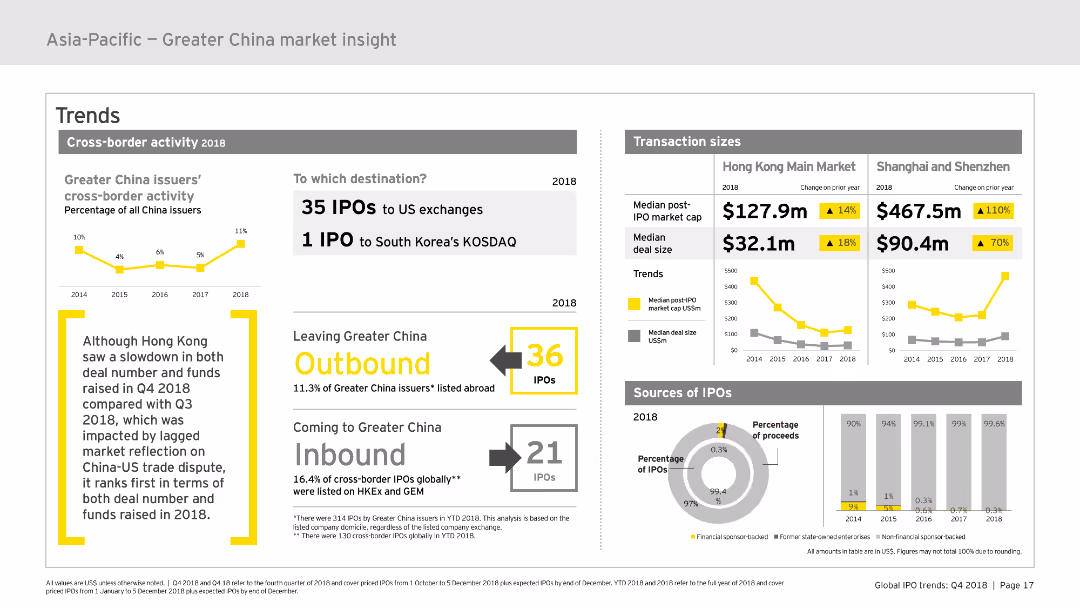
Focuses on cross-border activity in the Greater China IPO market. It uses charts to show outbound and inbound IPOs, destinations, and transaction sizes. The slide is designed with a moderate complexity, balancing text and visual elements effectively.
Market Analysis and Trends
Financial Services
Examines the trends in cross-border IPO activities for Greater China, including the number of IPOs, transaction sizes, and main destinations for outbound and inbound IPOs. Useful for understanding market movements and trends.
cross-border, IPO, Greater China, trends, transactions
Multiple Chart
EY
Saved
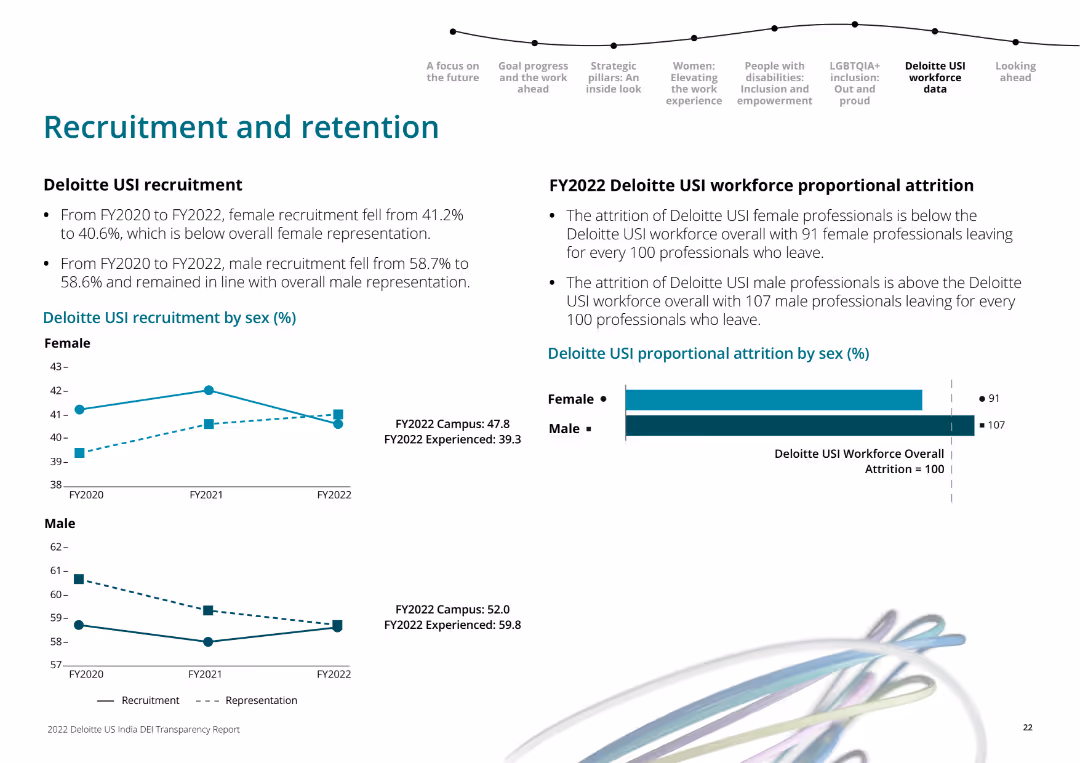
Line charts showing recruitment trends by sex over FY2020 to FY2022, and horizontal bar chart for proportional attrition by sex in FY2022.
Human Resources and Talent Management
Professional Services
It examines Deloitte USI's recruitment and retention trends over three fiscal years, highlighting gender differences in attrition rates.
workforce, recruitment, retention, Deloitte, gender, FY2022, line chart, bar chart
Multiple Chart
Deloitte
Saved
Previous
Next
If nothing, comes up, please save your slides first
Create a FREE account to continue browsing
Receive Instant Access to 1,000+ slides from companies like McKinsey, Google, and Goldman Sachs
First Name
Last Name
Email
Password
I agree to all
Terms & Privacy Policy
Thank you! Your submission has been received!
Oops! Something went wrong while submitting the form.
Have an account?
Sign in
Column Chart
Heatmap
Chevron
Org Chart
Infographic
Callouts
Timeline
List
Graphic
Picture
Process Flow
Diagram
Paragraph
Map
Table
Framework
Subtitle
Takeaway Box
Icon
Other Chart
Radar Chart
Waterfall Chart
Mekko Chart
Pie Chart
Scatter Plot
Line Chart
Bar chart
Bullet points