My Account
My Slides
Search by Category
Templates
Leave Feedback
Login
Logout
Get Started
Browse all Slides
Browse all Slides
Create a FREE Account
Instant access to 1,000+ real slides from top companies like McKinsey, BCG, Goldman Sachs, Google and many more!
First Name
Last Name
Email
Password
I agree to all
Terms & Privacy Policy
Thank you! Your submission has been received!
Oops! Something went wrong while submitting the form.
Have an account?
Sign in
Saved Slides
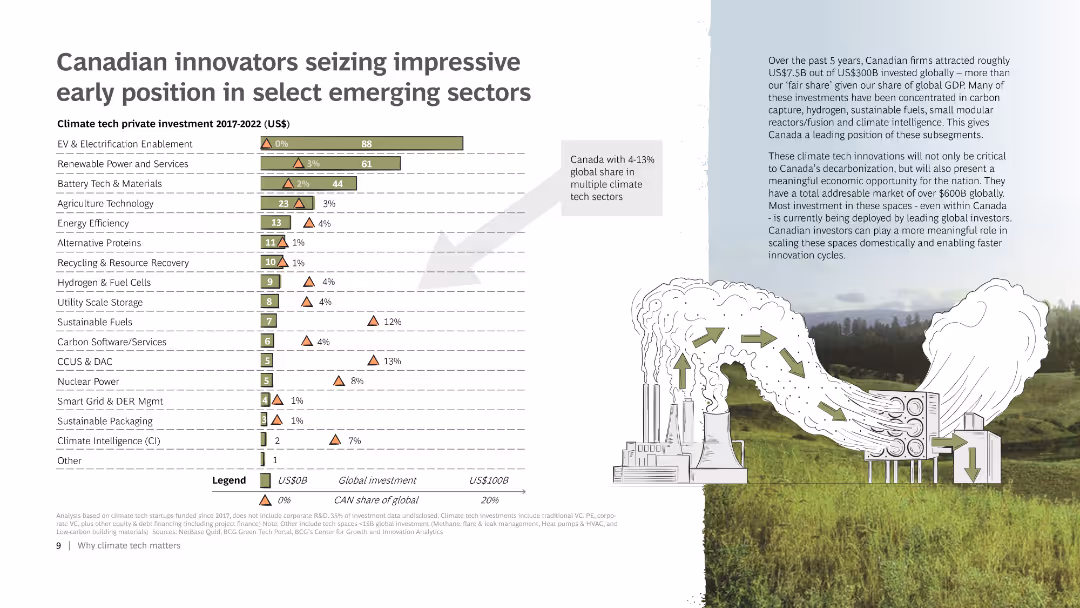
The slide includes a bar chart displaying the climate tech private investment from 2017 to 2022 across various sectors. It also features a small map of Canada, a detailed legend, and an illustration of a factory emitting green arrows to represent sustainable practices.
Market Analysis and Trends
Energy & Utilities
Highlights Canada's leading position in various emerging climate tech sectors through investments. Includes data on global and Canadian investments, emphasizing Canada’s share of the global market in these sectors.
Climate tech, Investment, Canada, Emerging sectors, Chart
Mixed Chart
BCG
Saved
This slide features two bar charts: one showing the bond market size in value and as a percentage of GDP for various countries, and another showing the debt and bonds as a percentage of GDP by country, broken down by government, corporate, and household sectors.
Market Analysis and Trends
Financial Services
The slide analyzes the global debt and bond market, comparing the market sizes and debt levels across countries, and breaking down the types of debt to provide insights into the financial health and risks associated with different economies.
Global debt, bond market, market size, GDP, government debt, corporate debt, household debt, financial health, economic analysis, financial risks
Multiple Chart
JP Morgan
Saved
Three line charts display LatAm y/y CPI, interest rate, and y/y wage growth from 2015-2025F for Brazil, Mexico, and Chile. Text provides detailed explanations.
Market Analysis and Trends
Financial Services
Focuses on inflation trends in Latin America, the impact of monetary policies, and forecasts for future economic conditions.
Inflation, Latin America, CPI, Interest Rate, Wage Growth
Multiple Chart
EY
Saved
This slide presents a mix of column charts and customer response statistics comparing Citigroup's new card products against competitors, depicted in varying shades of blue. Includes customer conversion rates and quotes from magazines highlighting product features, offering a balanced mix of text and graphics.
Product and Service Analysis
Financial Services
Analyzes the impact of new branded card products on consumer choice and engagement, showcasing how these cards have become the primary choice over competitors. It details customer retention rates, primary card replacement rates, and market feedback on new product features, serving as a compelling case study on product success and consumer acceptance.
consumer response, product launch, market feedback, credit cards, customer retention
Multiple Chart
Citigroup
Saved
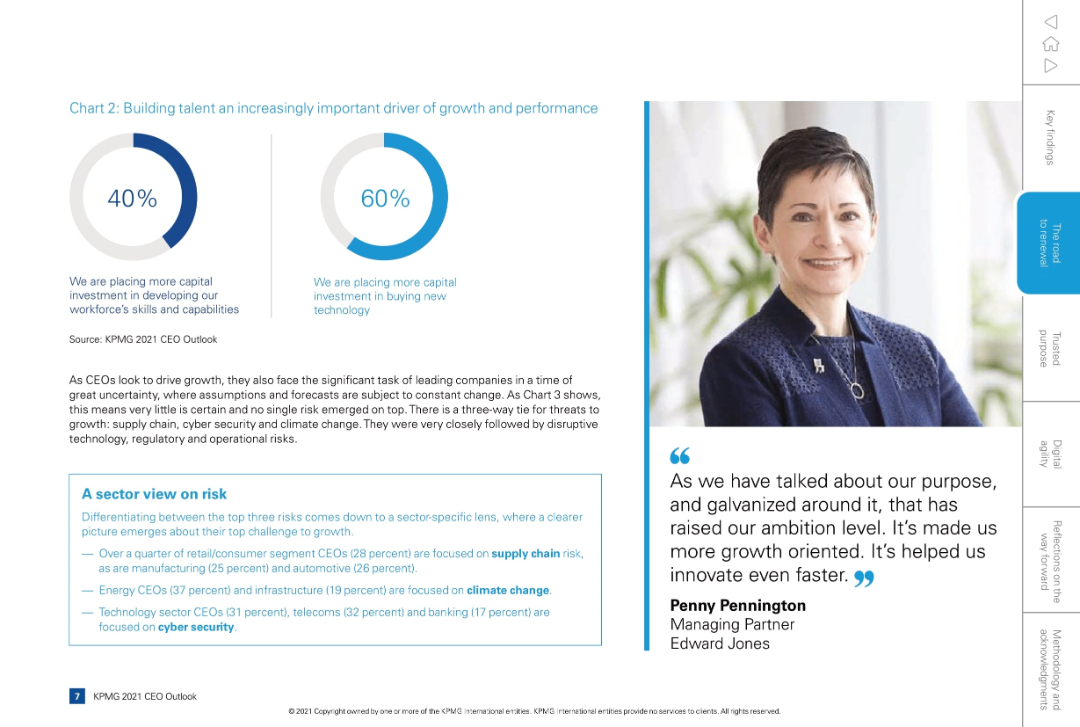
Left side contains a dual pie chart (skills vs. tech investment), bottom left includes a boxed text segment. Right side features an executive photo + quote.
Human Resources and Talent Management
Professional Services
Focuses on capital investment in workforce skills (40%) vs. technology (60%) and sector-specific risk insights. Emphasizes the increasing importance of people investments for growth. Includes commentary on top risks like supply chain, cybersecurity, and climate change, and a quote about innovation and purpose.
talent development, capital investment, risk, cybersecurity, skills, ESG
Mixed Chart
KPMG
Saved
Two sets of column charts detailing negative goodwill and purchase price adjustments, including PPA adjustments.
Mergers and Acquisitions
Financial Services
Explains the negative goodwill and purchase price allocation adjustments for the acquisition of Credit Suisse, including financial impacts and fair value adjustments.
goodwill, purchase price, PPA, adjustments, Credit Suisse
Multiple Chart
UBS
Saved
The slide features a column chart on the left side, text with icons in the middle, and a list of priorities on the right. The background shows shipping containers.
Market Analysis and Trends
Professional Services
It compares 3PE maturity across industries, expectations versus surprises in the 2022 study, and top priorities for 2022. It is used for highlighting industry trends.
Industry trends, procurement, priorities, maturity, expectations, surprises, collaboration, resilience
Mixed Chart
Kearney
Saved
Quadrant diagram categorizing 'Build', 'Buy', 'Invest', and 'Partner' strategies with a caption below.
Strategic Planning
Technology & Software
Discusses strategic approaches to fostering innovation, including building, buying, investing in, or partnering with other entities.
innovation, strategies, build, buy, invest, partner, business mix, dynamic approach
Diagram
Goldman Sachs
Saved
Large area graph showing the daily new cases with a 7-day rolling average, accompanied by key observations that include numerical and percentage data.
Risk Assessment and Management
Government & Public Sector
Analyzes the rise in COVID-19 cases in early July 2020 and provides a snapshot of the global situation with key statistics on active cases, recoveries, and fatalities.
COVID-19, Case Growth, Recovery Rates, Summer Spread
Single Chart
BCG
Saved
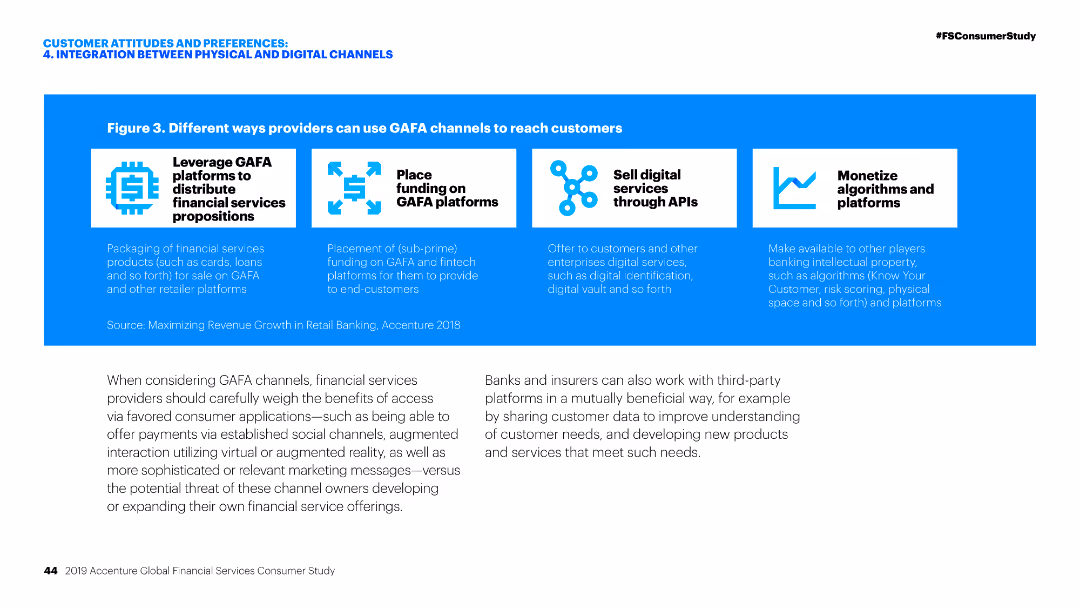
Diagram illustrating different ways financial service providers can leverage GAFA platforms for distributing services, funding, selling services, and monetizing algorithms.
Technology and Digital Transformation
Financial Services
The slide describes various strategies for financial service providers to use GAFA channels, focusing on distribution, funding, digital services, and monetization through algorithms.
GAFA channels, Financial services, Digital transformation, Distribution, Monetization
Pillar
Accenture
Saved
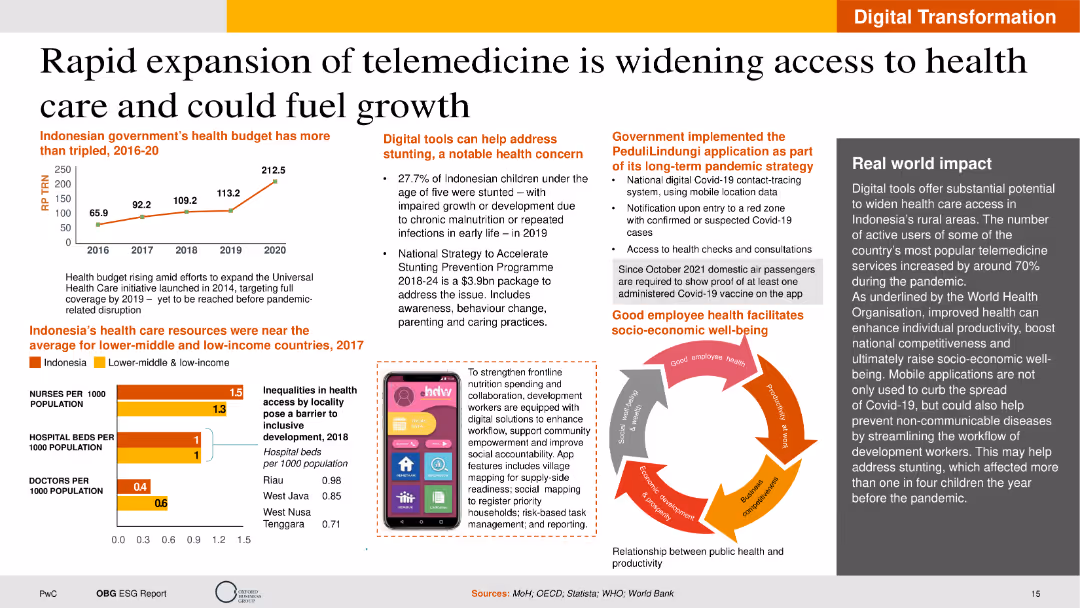
The slide features text sections on telemedicine growth, a line chart of the health budget, and an infographic on healthcare resources. The layout is visually engaging with a balanced mix of text and graphics.
Technology and Digital Transformation
Healthcare & Pharmaceuticals
This slide discusses the growth of telemedicine in Indonesia, focusing on healthcare access improvement, budget increases, and digital tools to address health concerns. It provides insights into the potential benefits of telemedicine for socio-economic development.
Telemedicine, Healthcare, Digital Tools, Indonesia, Growth
Multiple Chart
PwC/Strategy&
Saved
A complex circular diagram dominates the slide, illustrating the 'source-to-consume' life cycle with icons and text. Surrounding the cycle are boxes detailing megatrends and profiles for producers and consumers.
Investment Analysis
Agriculture & Food Production
This slide offers an intricate look at the agriculture industry's complexity, showing the various players and stages from production to consumption, alongside influential megatrends.
agriculture, industry lifecycle, megatrends, production, consumption, producers, consumers
Linear Flow
EY
Saved
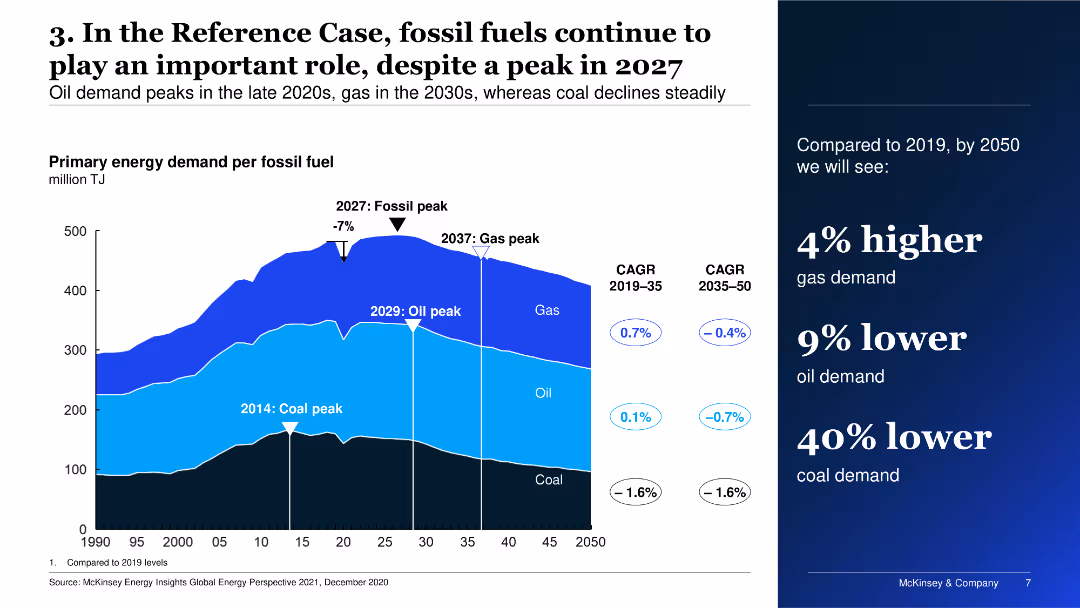
The slide features a multi-layered area chart depicting primary energy demand per fossil fuel over time, alongside key dates for peaks in coal, oil, and gas demand.
Market Analysis and Trends
Energy & Utilities
The slide shows the projected primary energy demand for fossil fuels, highlighting peak periods for coal, oil, and gas, and compares expected demand changes from 2019 to 2050.
Energy, fossil fuels, demand, projections, trends
Mixed Chart
McKinsey
Saved
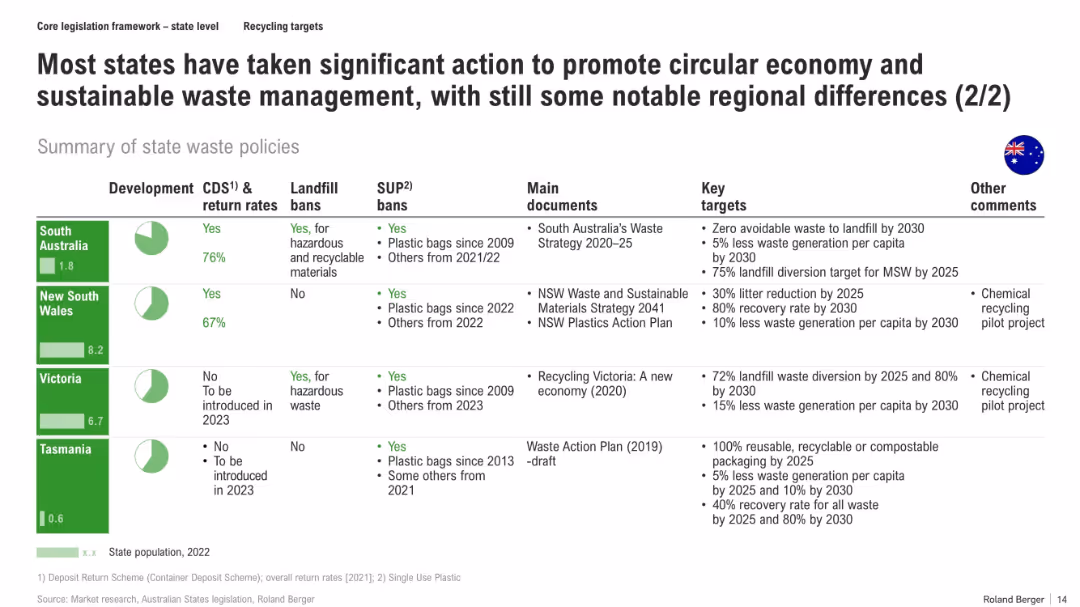
Tabular layout summarizing policies across four states with icons, colored headers, and key targets and comments for each
Regulatory and Compliance
Environmental Services & Sustainability
The slide summarizes waste management developments for South Australia, NSW, Victoria, and Tasmania, including CDS implementation, bans, strategic documents, and ambitious waste diversion/reduction targets. It highlights regional variations and the progressive steps each state has taken.
recycling targets, landfill bans, plastic bag bans, state policies, CDS, circular economy, Australia
Mixed Chart
Roland Berger
Saved
Continuation from the previous slide, this one similarly employs a mix of informative icons and text to express key points about the operational necessity of edge computing, showcased against a dark backdrop.
Technology and Digital Transformation
Technology & Software
This slide emphasizes the operational necessity of edge computing in modern business, highlighting the growing importance of data regulation, enterprise spend, and distributed computing's popularity. It lays out the escalating pace of data volume growth and the potential for edge computing to offer real-time insights and more significant operational flexibility.
Edge Computing, Data Regulation, Operational Necessity
Pillar
McKinsey
Saved
Pie chart showing high quality credit portfolio distribution and strategies for risk management.
Investment Analysis
Financial Services
Details the diversification of Credit Suisse’s portfolio and approaches to enhance risk management.
diversification, portfolio, risk management, credit quality, investment strategies
Mixed Chart
Credit Suisse
Saved
A slide with detailed text analysis on the left and a pie chart on the right illustrating the preferred online discovery channels for consumers.
Market Analysis and Trends
Retail & E-commerce
Analyzes the preferred online channels for product discovery, indicating a high preference for social media and video content as sources for finding new products and making purchasing decisions.
Discovery commerce, social media, video content, consumer preferences, pie chart
Single Chart
Bain
Saved
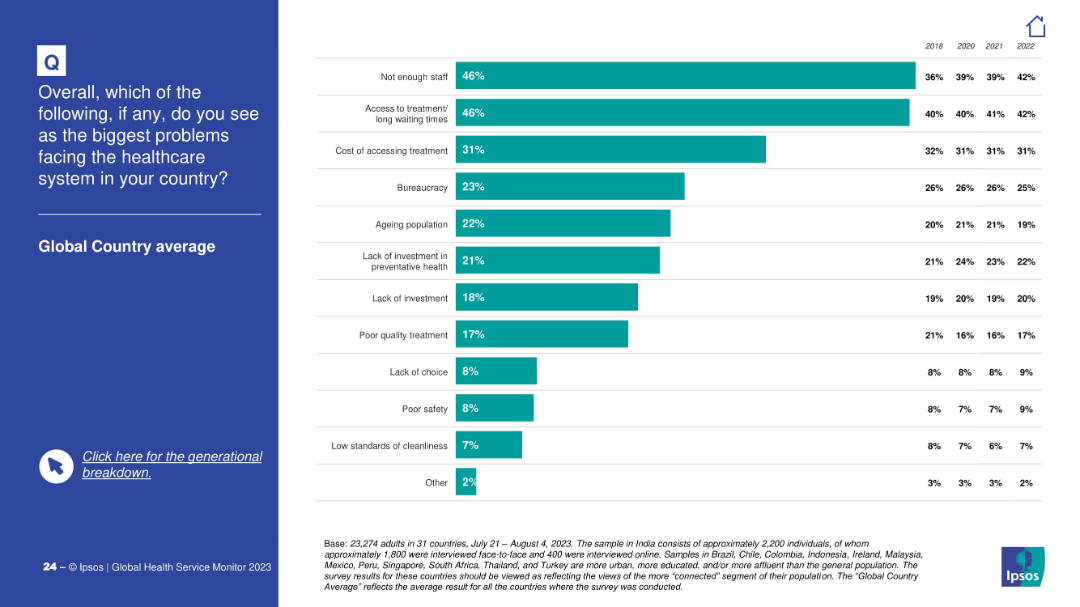
Split screen layout; left panel with question in white text on blue background; right panel has horizontal bar chart.
Market Analysis and Trends
Healthcare & Pharmaceuticals
This slide presents a global average ranking of the top perceived healthcare system problems, with "Not enough staff" and "Access to treatment/long waiting times" each cited by 46% of respondents. The chart tracks trends from 2018–2022.
healthcare, staffing, waiting times, costs, survey
Mixed Chart
IPSOS
Saved
The slide includes two line charts: one for overall food prices by category and another for fertilizer prices, both from 2019 to 2023.
Market Analysis and Trends
Agriculture & Food Production
The slide examines the trends in food and fertilizer prices, highlighting easing pressures and potential risks affecting these prices.
food prices, fertilizer, agriculture, market trends, pricing risks
Multiple Chart
Accenture
Saved
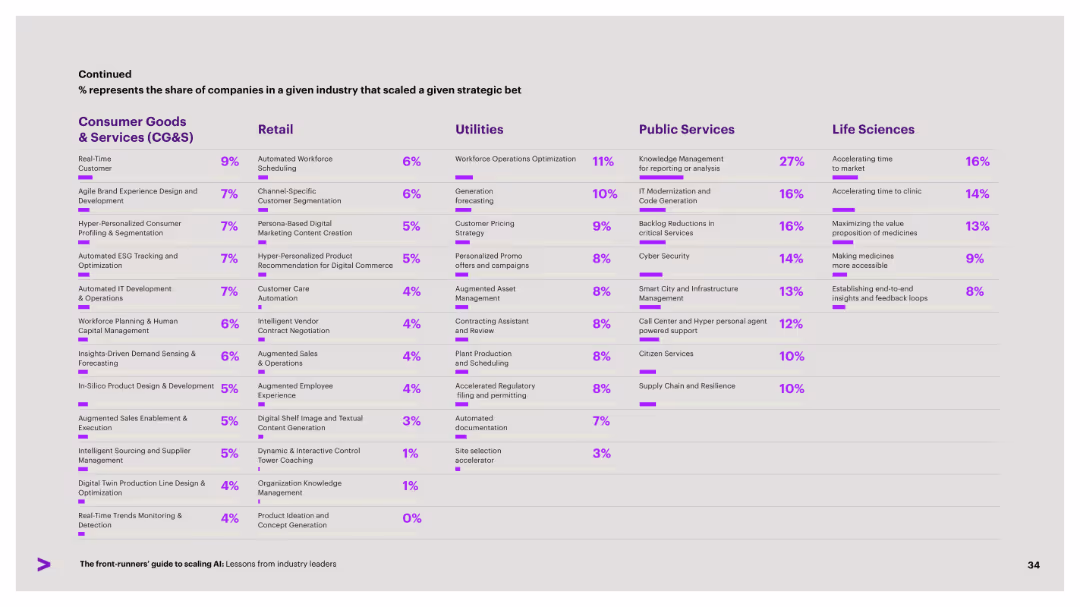
Continuation of previous slide in same layout, showing strategic AI bets by industry. Purple % bars illustrate adoption.
Strategic Planning
Artificial Intelligence
A continuation of strategic AI initiatives by industry, covering sectors like CG&S, Retail, Utilities, Public Services, and Life Sciences. The slide emphasizes the percentage of companies scaling each initiative.
industry scaling, AI strategy, CG&S, Life Sciences, digital innovation
Single Chart
Accenture
Saved
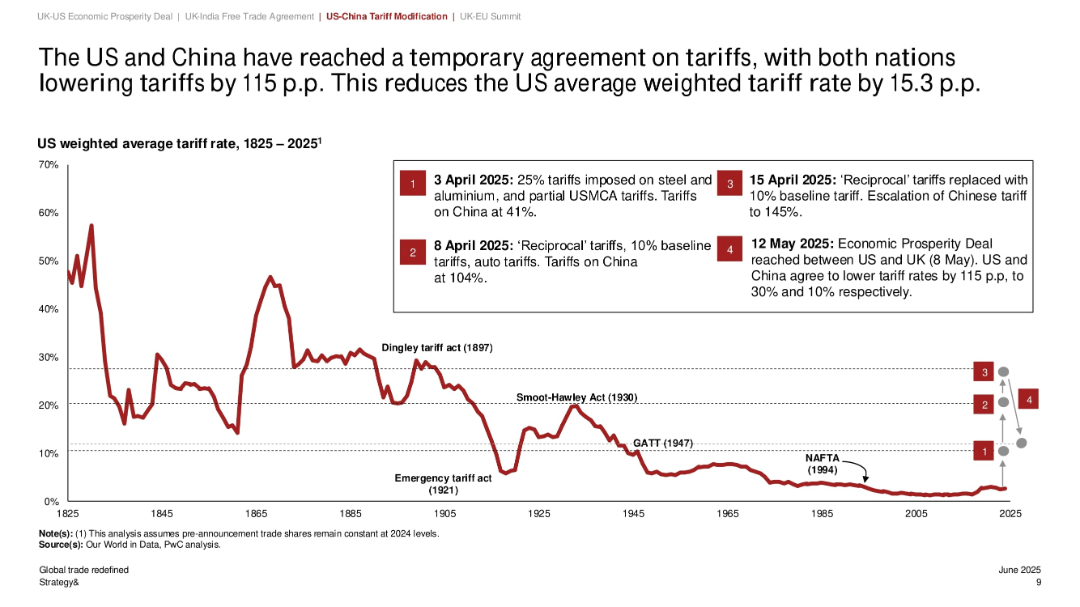
Historical line graph of US weighted average tariff rate from 1825 to 2025; annotations for policy events; red downward trend; right-side callouts summarize April-May 2025 tariff shifts
Regulatory and Compliance
Government & Public Sector
This slide provides historical context and recent developments in US trade policy, focusing on the reduction of tariffs between the US and China. The 2025 agreements lower tariffs by 115 p.p., significantly reducing average tariff rates. Key historical trade acts are also marked to show the evolution of trade liberalization.
tariff history, US-China trade, policy timeline, reciprocal tariffs, Economic Prosperity Deal, weighted average
Single Chart
PwC/Strategy&
Saved
Light background with yellow title banner, text-heavy content, and two line charts comparing IPO activity with major indices.
Financial Performance
Financial Services
This slide discusses the underperformance of IPOs in 2023 despite strong equity markets, highlighting various factors such as monetary policies, investor sentiment, and after-market performance. Line charts compare US IPO activity vs. S&P 500 and European IPO activity vs. STOXX Europe 600.
IPO performance, equity markets, 2023, financial trends, monetary policies
Multiple Chart
EY
Saved
The slide contains a line chart showing the increase in trade tensions over time, with separate lines for goods, services, and investment restrictions.
Market Analysis and Trends
Financial Services
The slide analyzes the rise in geoeconomic disintegration, evidenced by the increasing number of harmful trade restriction measures imposed globally.
geoeconomic disintegration, trade tensions, global trade, restrictions, economic trends
Mixed Chart
PwC/Strategy&
Saved
Bar chart detailing the changes in operating margin from FY 2021 to FY 2022, with factors such as COVID-19 impact, gross margin, payroll, and overheads contributing to the changes.
Financial Performance
Financial Services
The slide analyzes the change in operating margin over a year, breaking down the contributing factors and showing net gains and losses from various impacts like COVID-19 and payroll adjustments.
operating margin, financial analysis, COVID-19 impact, payroll, overheads
Multiple Chart
IPSOS
Saved
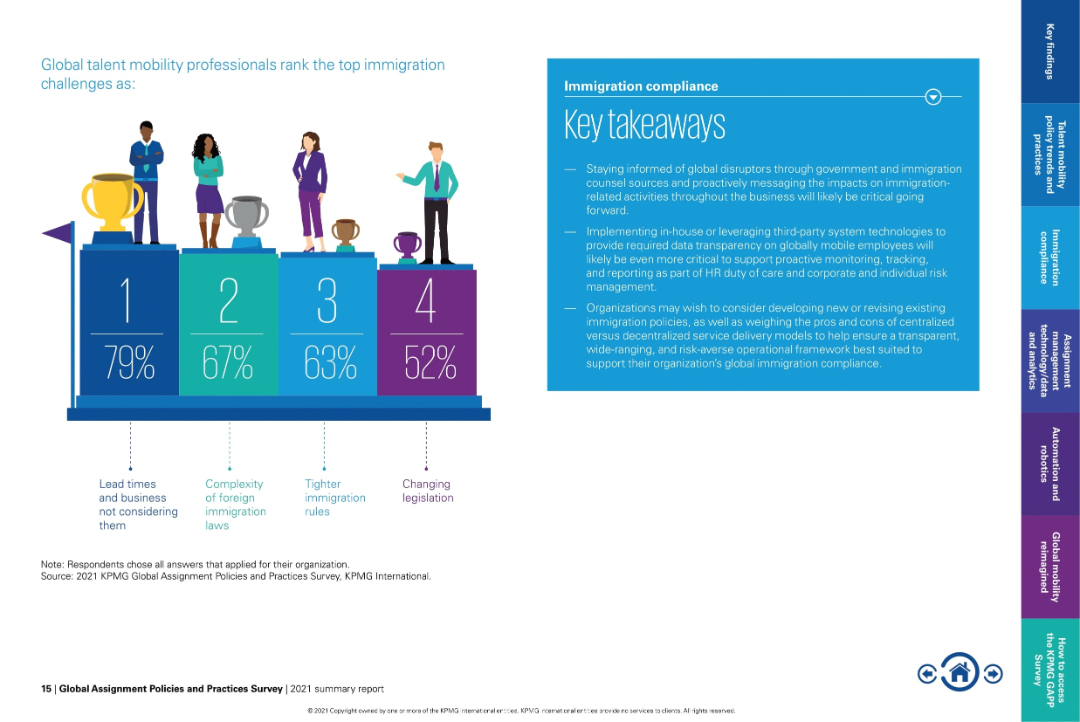
Podium-style infographic showing ranked challenges; blue box of takeaways to the right.
Risk Assessment and Management
Government & Public Sector
Visualizes the top four immigration challenges faced by professionals, led by "lead times and business not considering them" (79%). Also includes key recommendations like proactive data tracking and reevaluating service models for improved compliance.
immigration risk, lead time, foreign law complexity, immigration rules, legislation changes, compliance policy
Mixed Chart
KPMG
Saved
Previous
Next
If nothing, comes up, please save your slides first
Create a FREE account to continue browsing
Receive Instant Access to 1,000+ slides from companies like McKinsey, Google, and Goldman Sachs
First Name
Last Name
Email
Password
I agree to all
Terms & Privacy Policy
Thank you! Your submission has been received!
Oops! Something went wrong while submitting the form.
Have an account?
Sign in
Column Chart
Heatmap
Chevron
Org Chart
Infographic
Callouts
Timeline
List
Graphic
Picture
Process Flow
Diagram
Paragraph
Map
Table
Framework
Subtitle
Takeaway Box
Icon
Other Chart
Radar Chart
Waterfall Chart
Mekko Chart
Pie Chart
Scatter Plot
Line Chart
Bar chart
Bullet points