My Account
My Slides
Search by Category
Templates
Leave Feedback
Login
Logout
Get Started
Browse all Slides
Browse all Slides
Create a FREE Account
Instant access to 1,000+ real slides from top companies like McKinsey, BCG, Goldman Sachs, Google and many more!
First Name
Last Name
Email
Password
I agree to all
Terms & Privacy Policy
Thank you! Your submission has been received!
Oops! Something went wrong while submitting the form.
Have an account?
Sign in
Saved Slides
Orange, blue and green hues separate policies and actions on the left from country examples on the right, emphasizing government roles.
Strategic Planning
Technology & Software
Focuses on government policies to retain and attract talent in the ICT sector, mentioning examples from different countries.
ICT, government policy, talent retention, work hours, diversity, workspace
Header Vertical
Kearney
Saved
Features a blue column chart indicating the percentage of users increasing food delivery frequency, with additional insights in text format.
Market Analysis and Trends
Retail & E-commerce
Analyzes the food delivery sector, showing the surge in user frequency and the competitive landscape. This slide is essential for businesses operating in or entering the food delivery market, providing data to strategize on customer retention and market entry.
Food Delivery, User Growth, Market
Mixed Chart
Bain
Saved
This is a cover slide with a creative design depicting a world map made of plant leaves on a deep blue background, representing the concept of a 'green' or eco-friendly world. The title is prominently displayed at the top.
Industry Overview
Environmental Services & Sustainability
As the introductory slide, it sets the theme for the presentation, signaling a focus on the costs and benefits of the net-zero transition within the global energy sector.
Net-Zero, Transition, Global Energy, Sustainability, Eco-Friendly, Introduction, McKinsey, 2022, Cover Slide
Title
McKinsey
Saved
Two donut charts displaying the distribution of podcast ad revenue by type of ad read mechanism between 2015 and 2016, noting a preference for host-read ads.
Market Analysis and Trends
Media & Entertainment
Explores revenue distribution by ad read mechanisms in podcasting, indicating a growing preference for host-read ads. Useful for media companies evaluating engagement strategies and ad format effectiveness.
podcast, ad revenue, host read, media
Multiple Chart
PwC/Strategy&
Saved
Lists advantages of smart contracts such as security and cost savings, presented through a combination of icons and bullet points which simplify complex information into easily digestible segments.
Technology and Digital Transformation
Technology & Software
Details the benefits of using smart contracts in blockchain technology, emphasizing aspects like speed, accuracy, and cost efficiency. Useful for discussions on improving business processes through technology.
smart contracts, advantages, security, efficiency, cost savings
Boxed
McKinsey
Saved
Slide with text and images comparing Canada and Ukraine to Australia in terms of wheat production and export, highlighting similarities in supply chains and efficiency.
Competitive Landscape
Agriculture & Food Production
The slide compares Australia's wheat supply chain to Canada and Ukraine, using these countries as benchmarks for efficiency and export market similarities.
benchmarking, wheat supply chain, Canada, Ukraine, Australia
Graphic
LEK
Saved
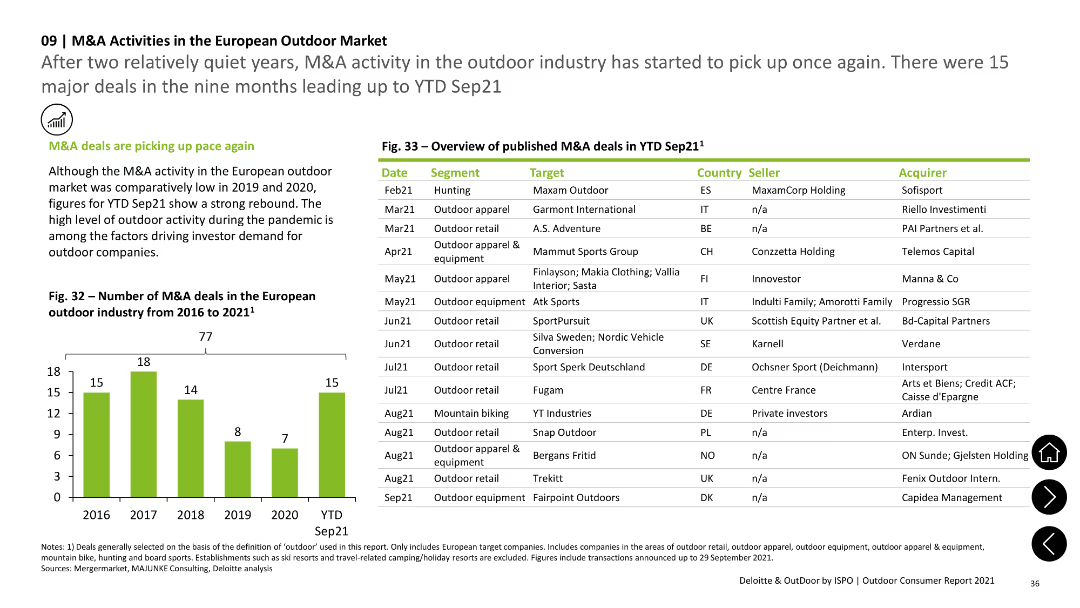
The slide has a column chart showing the number of M&A deals from 2016 to 2021 and a table listing details of M&A deals in 2021, including date, segment, target, country, seller, and acquirer. Text sections add context.
Mergers and Acquisitions
Financial Services
The slide provides an overview of M&A activities in the European outdoor market, with data on the number of deals over recent years and specific details of major deals in 2021, indicating a rebound in M&A activity.
M&A activity, financial services, European market, mergers, acquisitions
Mixed Chart
Deloitte
Saved
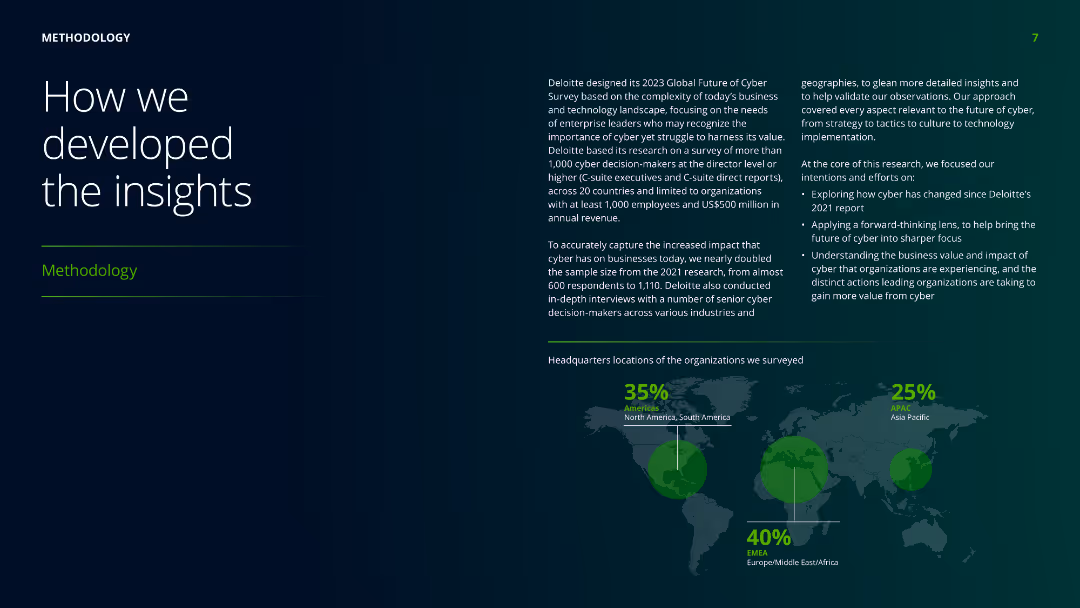
The slide features a world map with highlighted regions, accompanied by text boxes explaining the methodology used in developing the insights, including survey details and participant demographics.
Risk Assessment and Management
Professional Services
Describes the methodology behind the research, including the survey's scope, participant demographics, and objectives to ensure comprehensive insights into the business and technology landscape.
methodology, insights, survey, demographics, research, professional services, global, participant, business, technology
Mixed Chart
Deloitte
Saved
Features a combination of text and graphics, including column charts that compare assets under custody and administration over a four-year span. The graphics are paired with descriptive text on the left.
Strategic Planning
Financial Services
The slide discusses the growth of the Securities Services division through new business wins, client retention, and market expansion. The charts compare assets under custody and administration from 2015 to 2019, indicating significant growth. This illustrates strategic achievements and market penetration.
growth, strategy, clients, market expansion, assets, custody, administration
Multiple Chart
JP Morgan
Saved
This slide features a stacked column chart showing the CPI annual change contribution by category from 2019 to 2023. The chart uses different colors for services, energy, goods, and food, and it's presented over a white background with the title at the top.
Financial Performance
Financial Services
An analytical slide detailing contributions to the Consumer Price Index (CPI) by category, focusing on changes in inflation. It is suitable for discussions on economic health and policy decisions.
CPI, Inflation, Energy, Goods, Services, Food, Economic Analysis, Column Chart, Price Index, July
Single Chart
McKinsey
Saved
The slide has a green and white color scheme and presents a matrix showing reasons against repairing different types of e-waste. It uses red and orange circles to indicate various reasons such as cost, lack of repair options, and effort, across items like washing machines and mobile phones.
Market Analysis and Trends
Environmental Services & Sustainability
This slide outlines solvable reasons why people avoid repairing e-waste items, such as high costs and lack of repair options. It uses a matrix to show the prevalence of each reason for different items, advocating for solutions to these barriers.
repair, e-waste, barriers, reasons, solutions
Table
Oliver Wyman
Saved
Slide uses icons, arrows, and column charts to visualize the growth in Chinese spending on luxury goods from 2015 to 2018, both locally and abroad.
Financial Performance
Retail & E-commerce
Discusses the significant impact of local and international spending by Chinese consumers on the luxury goods market over three years, highlighting the doubling of local spending.
Chinese Market, Spending Growth, Local, International
Mixed Chart
Bain
Saved
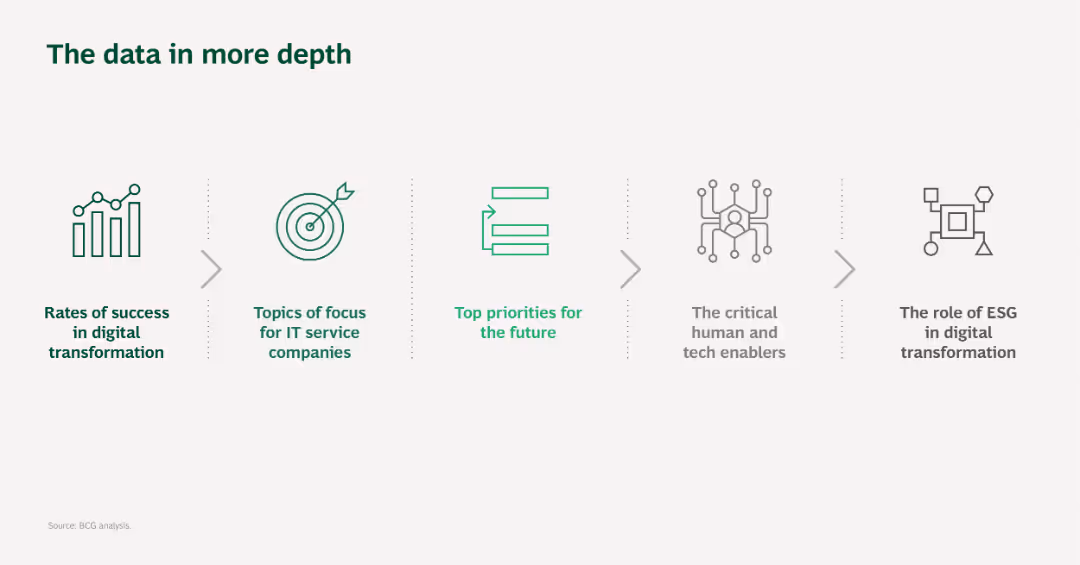
Simple layout with five icons representing different aspects of digital transformation data analysis.
Market Analysis and Trends
Telecommunications
This slide provides an overview of the topics covered in the presentation, including digital transformation success rates, IT service focus areas, and future priorities.
Digital transformation, Data analysis, IT services, Priorities, Topics overview
Pillar
BCG
Saved
The slide has a two-column layout with a header "Chapter 2" and a column chart. It lists key enhancements in financial and nonfinancial risk management over the next 12 months.
Strategic Planning
Financial Services
This slide highlights areas where CROs are focusing their efforts, including stress testing, risk appetite frameworks, and talent upskilling, to enhance risk management.
risk focal points, CRO, investment, strategic planning, risk management
Multiple Chart
EY
Saved
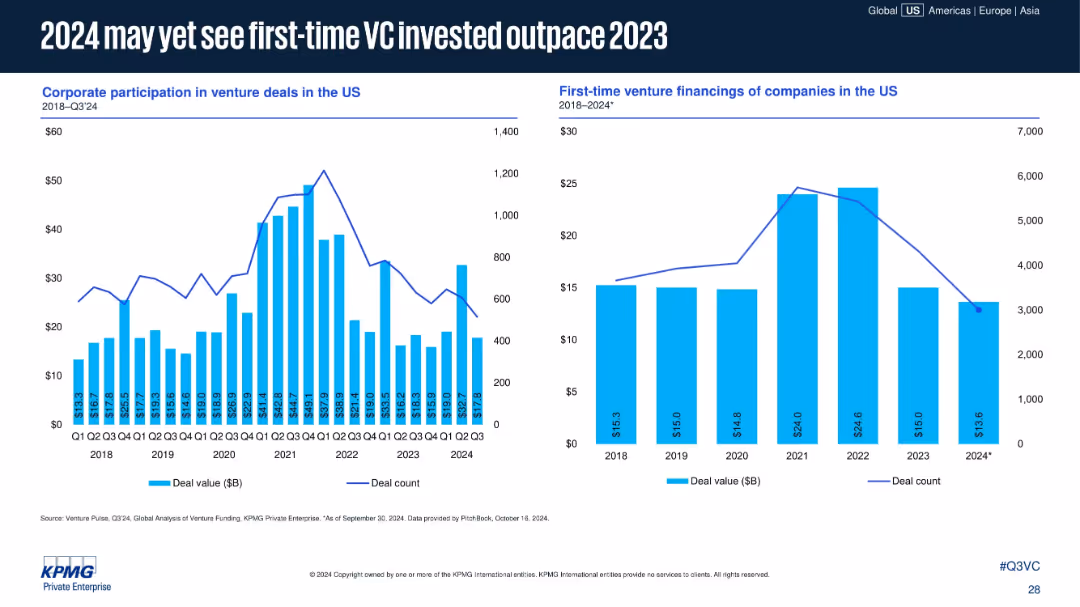
Two bar-line combo charts: left tracks corporate VC participation; right shows first-time VC financings. Timeline spans 2018–Q3 2024.
Sales and Business Development
Financial Services
First-time venture financings are projected to slightly outpace 2023, although deal count is trending down. Corporate VC activity remains volatile, peaking in 2021 and stabilizing in 2024.
corporate VC, first-time funding, venture capital, 2024 forecast, startup investment, funding trends, early-stage companies
Multiple Chart
KPMG
Saved
Column charts display recurring net fee income, net interest income, and transaction-based income.
Financial Performance
Financial Services
Discusses growth in all revenue lines for Global Wealth Management, highlighting fee and interest incomes.
wealth management, revenue growth, fee income, interest income, transaction income
Multiple Chart
UBS
Saved
The slide features a set of scatter plots comparing technology adoption rates across different regions (US, Europe, China, South Asia, Rest of the World, Global). Each scatter plot displays data for Solar, Wind, Nuclear, Coal, and Gas technologies for the years 2025 and 2050.
Market Analysis and Trends
Energy & Utilities
This slide discusses how the adoption of various energy technologies varies across different regions. It highlights the projected technology adoption rates for Solar, Wind, Nuclear, Coal, and Gas in the years 2025 and 2050, showing trends and comparisons globally.
Energy, Technology, Adoption, Rates, Global, Solar, Wind, Nuclear, Coal, Gas
Multiple Chart
EY
Saved
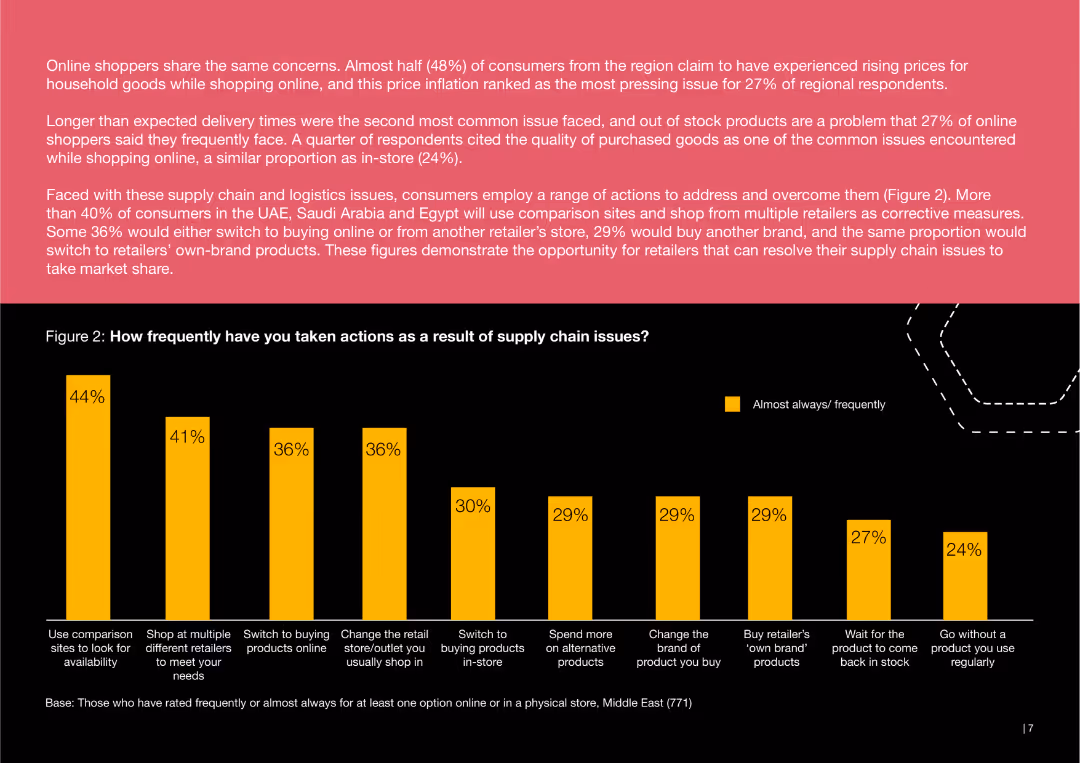
This slide includes a bar chart showing the frequency of various consumer actions taken in response to supply chain issues. Actions like using comparison sites, shopping at multiple retailers, and switching to online purchases are depicted.
Risk Assessment and Management
Consumer Goods
The slide analyzes how consumers have responded to supply chain challenges, highlighting actions such as using comparison sites, shopping at different retailers, and switching to online shopping.
consumer, supply chain, actions, comparison, retailers, online, response, shopping
Mixed Chart
PwC/Strategy&
Saved
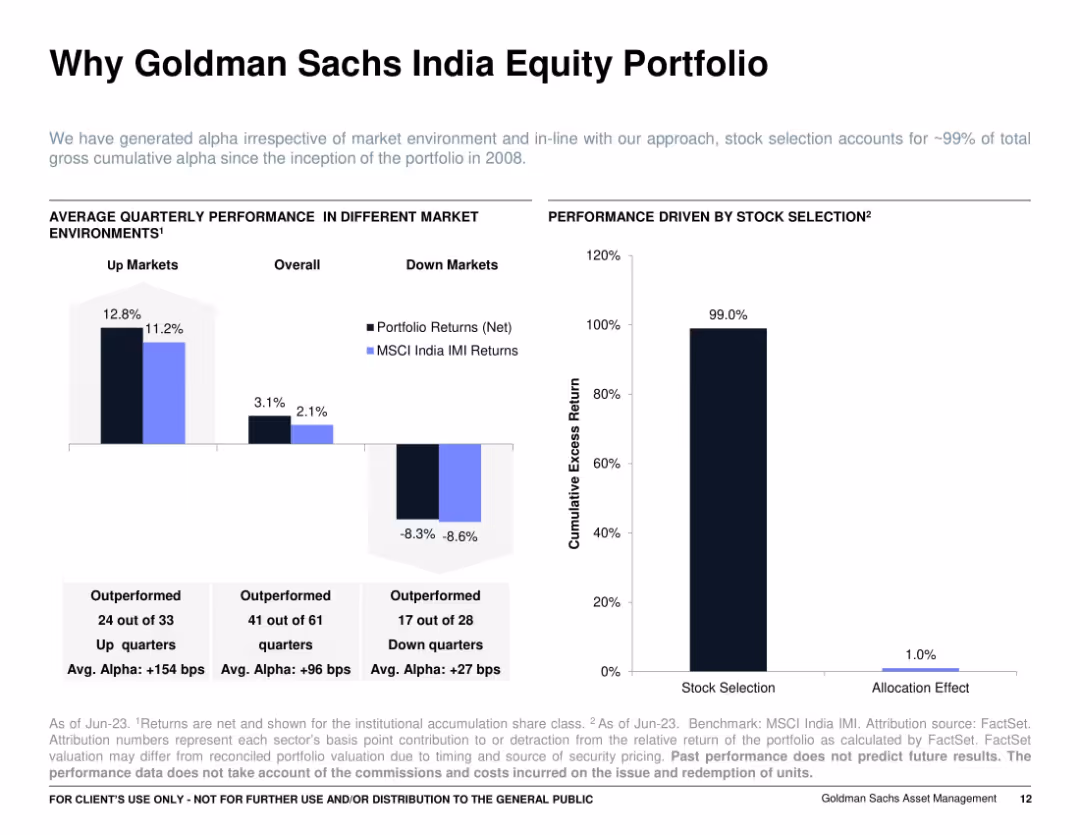
Two side-by-side bar and column charts: left shows average quarterly performance in up/down markets, right shows contribution of stock selection vs. allocation; clear annotations with a minimalist layout.
Investment Analysis
Financial Services
Demonstrates that the Goldman Sachs India Equity Portfolio’s performance is primarily driven by stock selection, not allocation. Highlights strong alpha in various market conditions, emphasizing consistent outperformance across 99% of quarters since inception.
alpha generation, up/down markets, portfolio returns, stock selection, attribution, GS India, MSCI IMI
Multiple Chart
Goldman Sachs
Saved
The slide features a mix of text and bar charts with segmented pie charts displaying data on respondents' functions and industries.
Operational Efficiency
Industrial & Manufacturing
The slide presents an overview of the Operations Efficiency Radar study, focusing on manufacturing and service providers, targeting functional heads.
Operations Efficiency, CFO, Manufacturing, Survey, Trends
Multiple Chart
Roland Berger
Saved
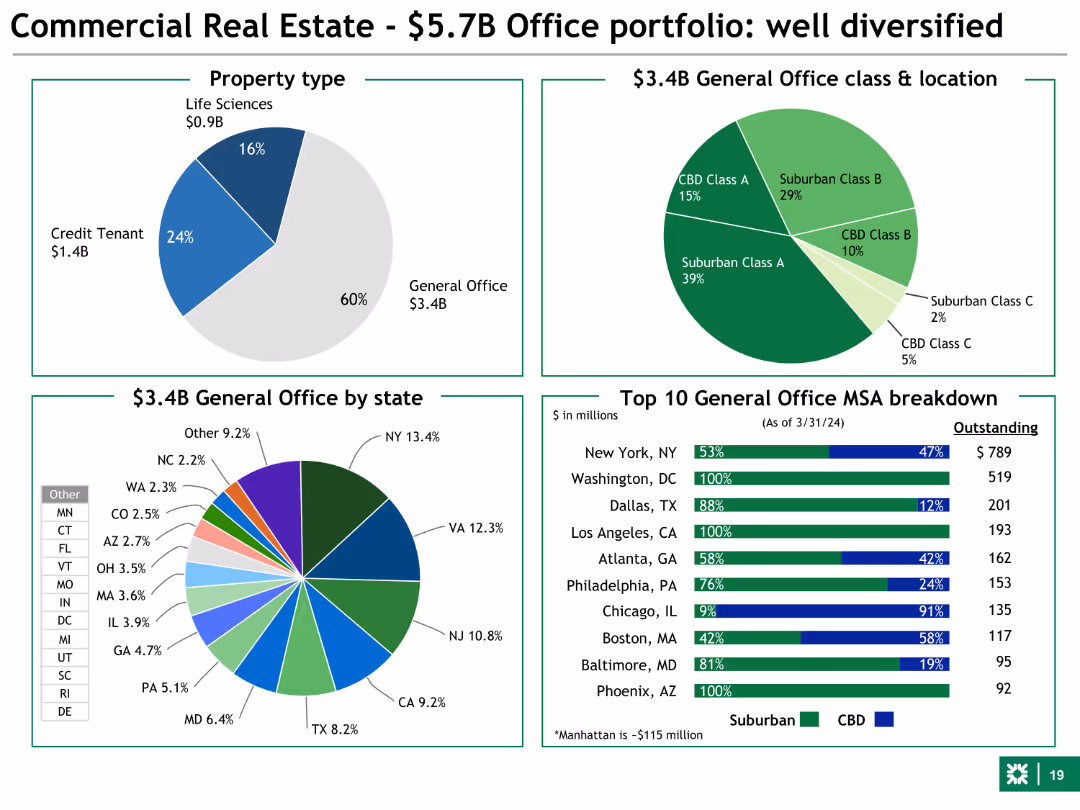
Pie charts and bar charts showing property types, office class & location, and MSA breakdown. Uses various colors to distinguish different data segments.
Market Analysis and Trends
Financial Services
This slide focuses on the commercial real estate office portfolio, showing the distribution of property types, class, and geographic breakdown. It highlights diversification.
commercial real estate, office, property types, diversification, geographic
Multiple Chart
Barclays
Saved
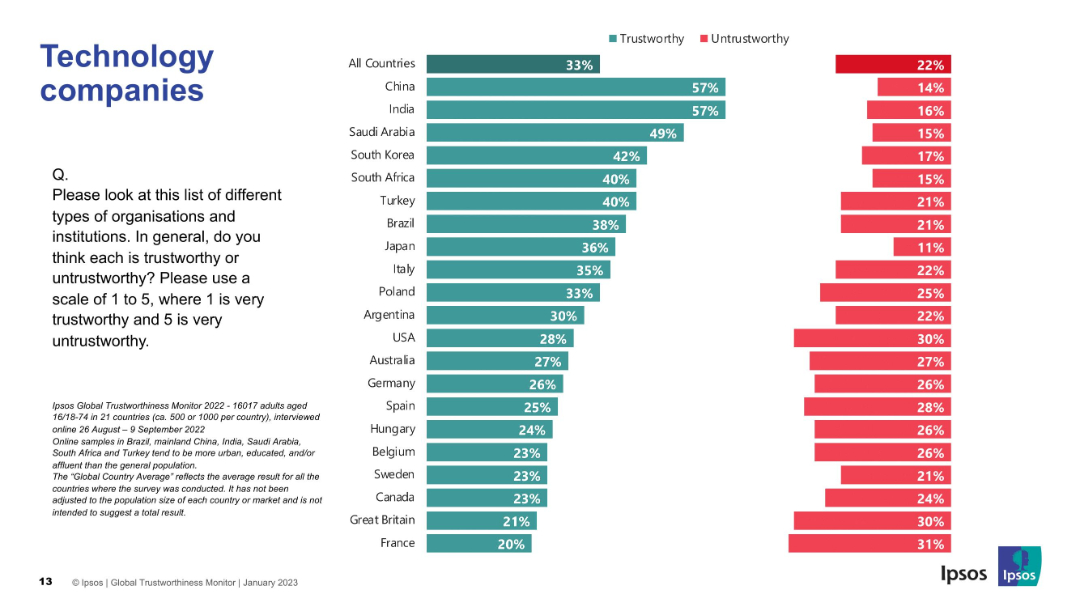
Bar graph with trust/untrust bars by country; consistent color scheme and layout as prior slides.
Market Analysis and Trends
Technology & Software
The chart ranks public trust in tech companies by country. China and India lead with highest trust ratings; France and Great Britain rank low.
technology, public trust, global survey, Ipsos, companies, perception, trustworthy, untrustworthy, country ranking
Mixed Chart
IPSOS
Saved
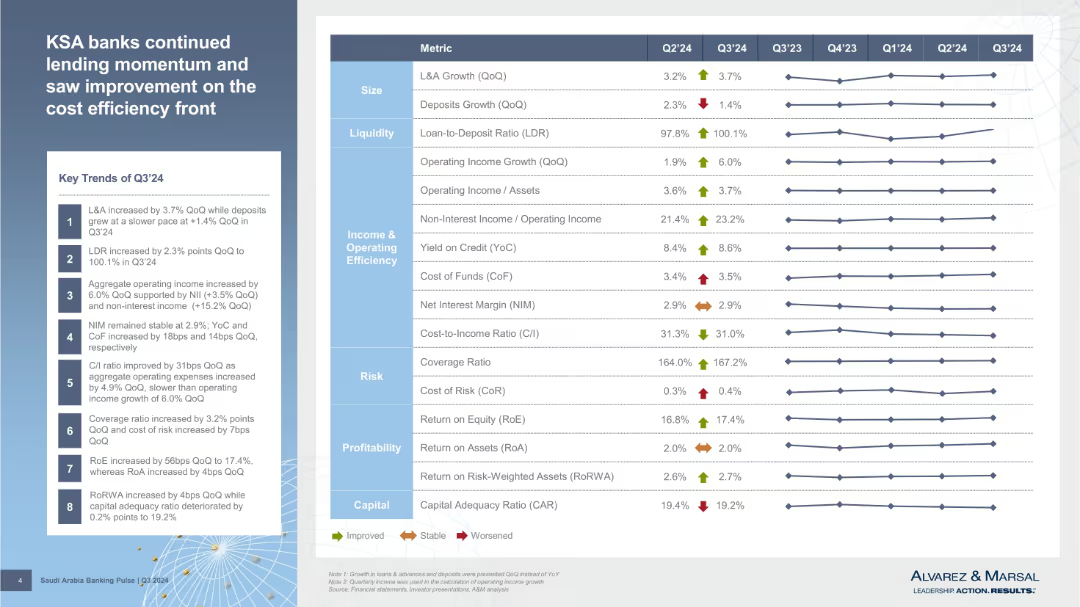
Left panel has key trends with numeric labels; right panel is a heatmap-style table comparing multiple metrics across quarters. Visual arrows indicate performance trends.
Performance Metrics and KPIs
Financial Services
Highlights Q3'24 trends in KSA banking with detailed performance metrics like LDR, operating income, yield on credit, RoE, and capital adequacy. Uses a traffic-light arrow system to reflect improvements or declines across metrics.
cost efficiency, LDR, RoE, Q3'24, KPIs, asset growth, profitability, operating income, efficiency, banking indicators
Mixed Chart
Alvarez & Marsal
Saved
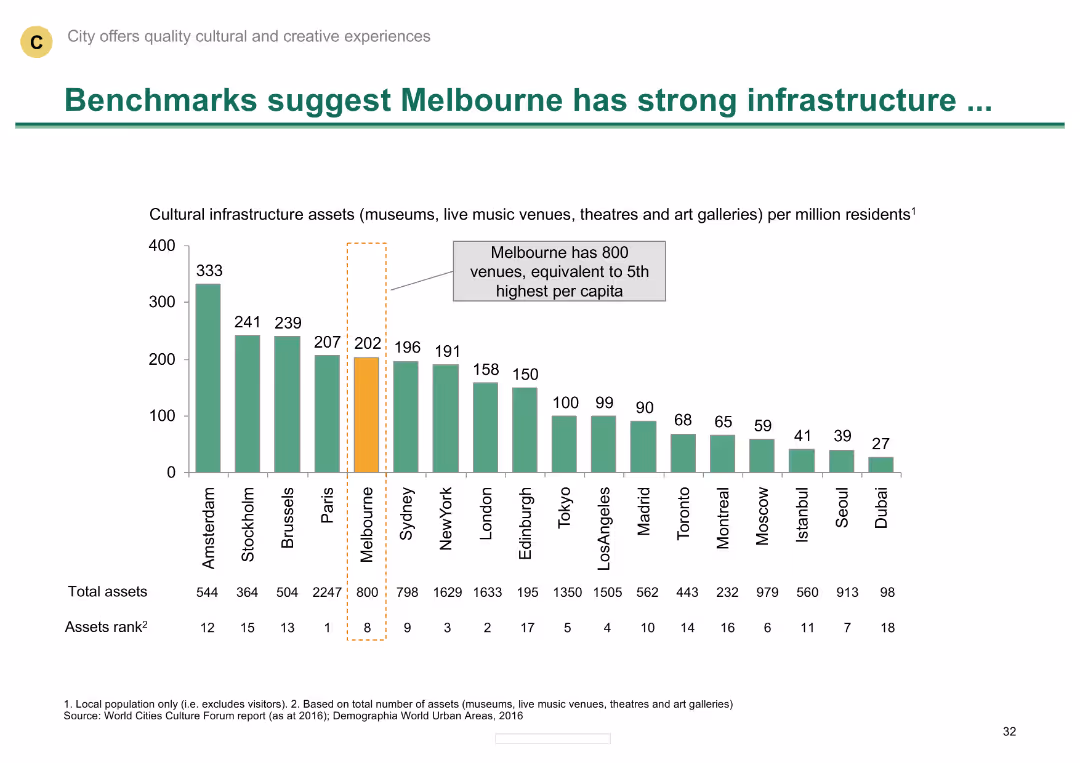
Column chart comparing cultural infrastructure assets across various cities
Industry Overview
Media & Entertainment
Highlights Melbourne's strong cultural infrastructure compared to other cities, with numerous venues per capita.
Cultural infrastructure, Melbourne, comparative analysis, venues, global cities
Single Chart
BCG
Saved
Depicts various market segments with potential growth opportunities using purple boxes and white text. Design is straightforward and focused on future strategies.
Strategic Planning
Technology & Software
Outlines the substantial growth opportunities in different segments, including revenue cycle software and identity management. Useful for strategic planning sessions or investor relations meetings.
growth strategy, market opportunities, technology, strategic planning
Pillar
Barclays
Saved
Previous
Next
If nothing, comes up, please save your slides first
Create a FREE account to continue browsing
Receive Instant Access to 1,000+ slides from companies like McKinsey, Google, and Goldman Sachs
First Name
Last Name
Email
Password
I agree to all
Terms & Privacy Policy
Thank you! Your submission has been received!
Oops! Something went wrong while submitting the form.
Have an account?
Sign in
Column Chart
Heatmap
Chevron
Org Chart
Infographic
Callouts
Timeline
List
Graphic
Picture
Process Flow
Diagram
Paragraph
Map
Table
Framework
Subtitle
Takeaway Box
Icon
Other Chart
Radar Chart
Waterfall Chart
Mekko Chart
Pie Chart
Scatter Plot
Line Chart
Bar chart
Bullet points