My Account
My Slides
Search by Category
Templates
Leave Feedback
Login
Logout
Get Started
Browse all Slides
Browse all Slides
Create a FREE Account
Instant access to 1,000+ real slides from top companies like McKinsey, BCG, Goldman Sachs, Google and many more!
First Name
Last Name
Email
Password
I agree to all
Terms & Privacy Policy
Thank you! Your submission has been received!
Oops! Something went wrong while submitting the form.
Have an account?
Sign in
Saved Slides
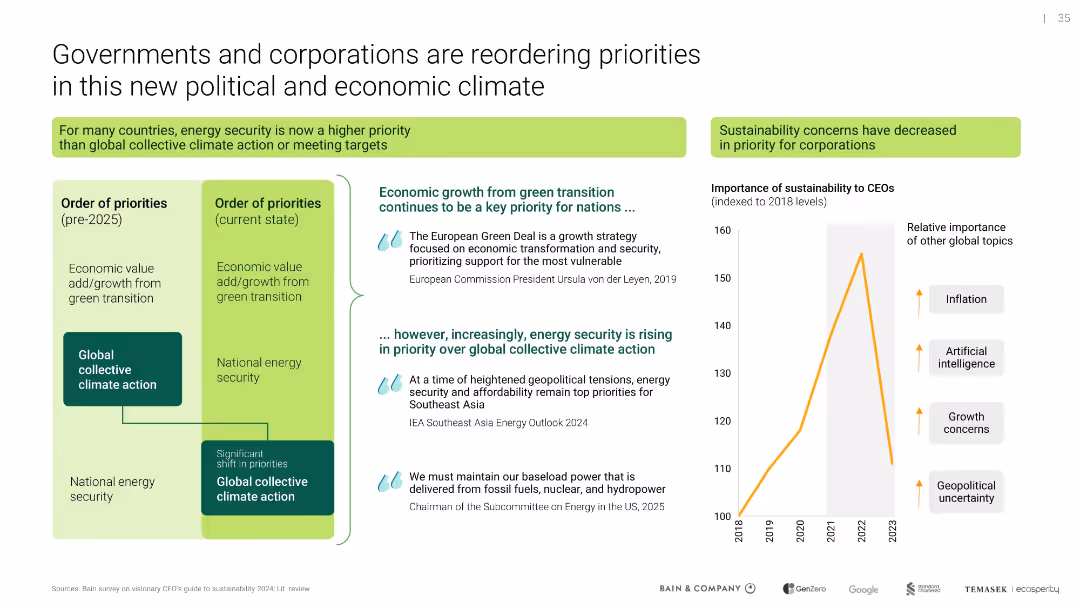
Dual-column comparison of priority orders; line chart on CEO sustainability priority; includes direct quotes
Strategic Planning
Environmental Services & Sustainability
Illustrates a shift in national and corporate priorities from collective climate action to energy security amid global instability. Also shows waning CEO focus on sustainability relative to other concerns like AI and inflation.
energy security, sustainability, corporate priorities, geopolitical risk
Mixed Chart
Bain
Saved
This slide uses column charts to compare ICT teaching hours and the number of students receiving practical ICT classes before and after adopting solar power, indicating significant improvements in both metrics.
Strategic Planning
Education & Training
This slide provides compelling evidence of the benefits of solar power adoption in schools, showing improvements in ICT teaching hours and increased student participation. It advocates for broader implementation of solar solutions to enhance educational outcomes.
Solar Power, ICT, Education, Nigeria, Improvement
Multiple Chart
BCG
Saved
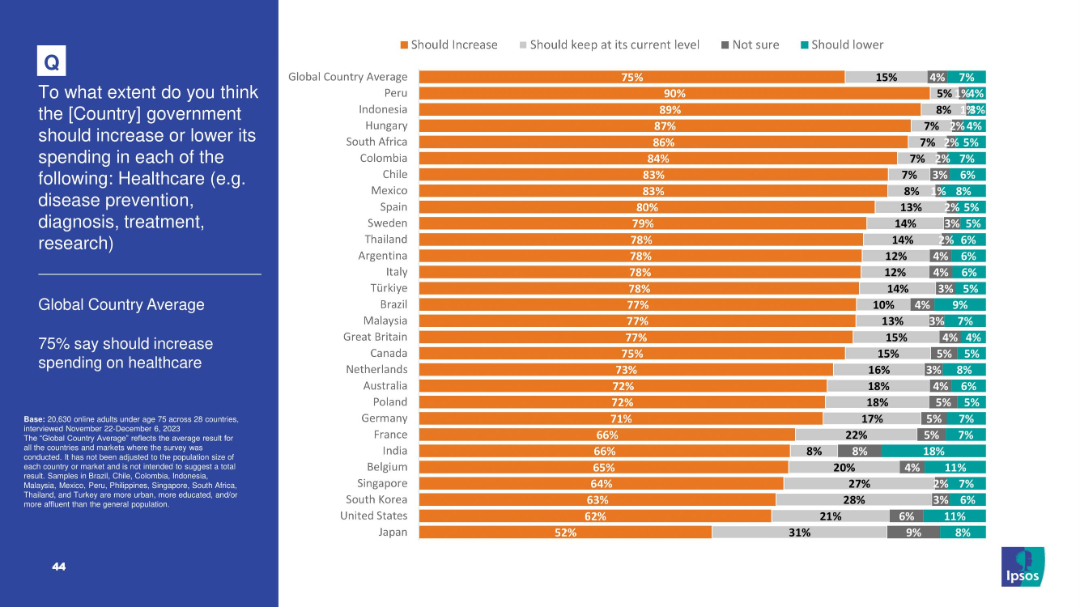
Horizontal bar chart showing majority support for increasing healthcare spending; includes granular response options and country-by-country breakdown
Strategic Planning
Healthcare & Pharmaceuticals
Healthcare is the top funding priority globally—75% agree spending should rise. Countries like Peru, Indonesia, and Hungary show particularly strong support. This reflects global concern for healthcare infrastructure and services.
healthcare, spending, public opinion, investment, hospitals, disease prevention, Ipsos, treatment, public services
Mixed Chart
IPSOS
Saved
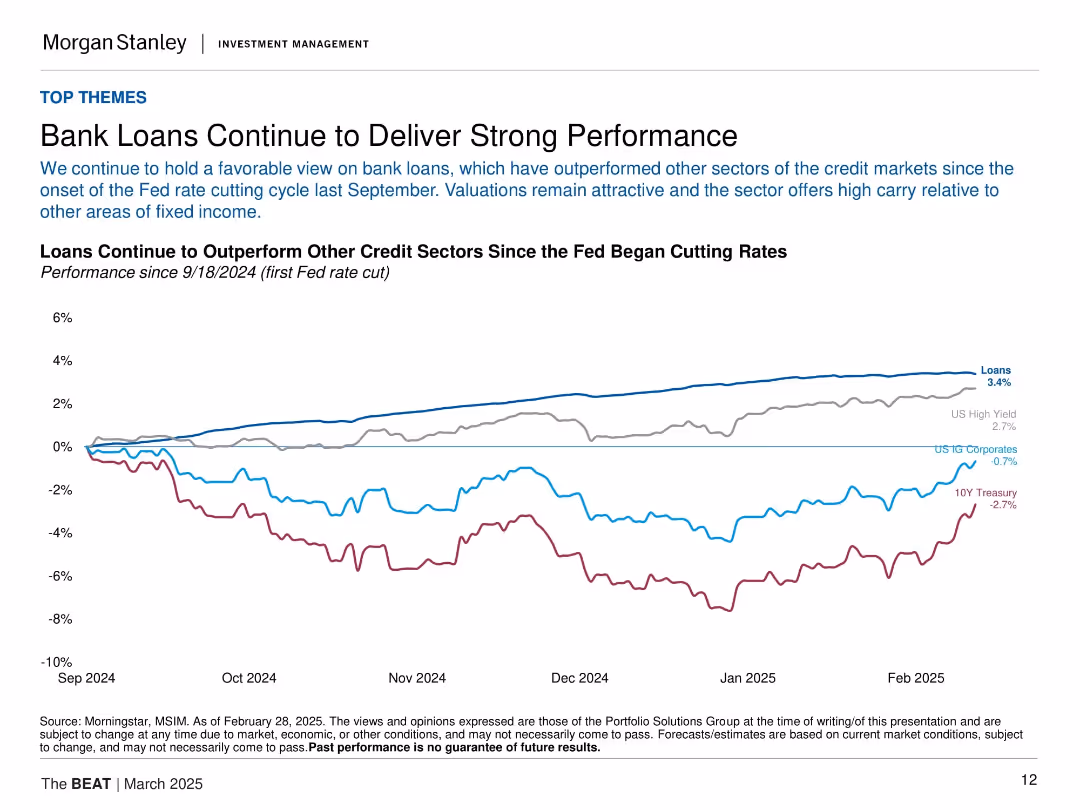
Line chart comparing returns of various credit sectors since Fed rate cut in Sept 2024. Each line represents a different fixed income type.
Financial Performance
Financial Services
Bank loans have outperformed other fixed income sectors (e.g., Treasuries, IG corporates, high yield) since the Fed's September 2024 rate cuts. The slide emphasizes strong relative returns and high carry appeal of bank loans.
bank loans, fixed income, Fed rate cut, high yield, IG corporates, returns, performance
Single Chart
Morgan Stanley
Saved
This slide is divided into two main sections, with the left side featuring a table with two columns for SMEs and Individuals, and the right side presenting a numbered list of key points about the Santander Global Platform. The table includes logos of affiliated services. There's a significant amount of text, and visual aids like arrows and numbers guide the reader through the content. The color scheme is a mix of red, blue, and white, with the Santander logo prominently placed at the top.
Market Analysis and Trends
Financial Services
The slide analyzes the Santander Global Platform's offerings for SMEs and individuals and outlines the strategy for digital banking solutions. It's appropriate for presentations discussing digital transformation, payment solutions, and market expansion strategies.
Digital Banking, Global Payments, SMEs, Individuals, Santander, Fintech, Open Platform, Banking Solutions, Financial Services
Vertical Flow
Morgan Stanley
Saved
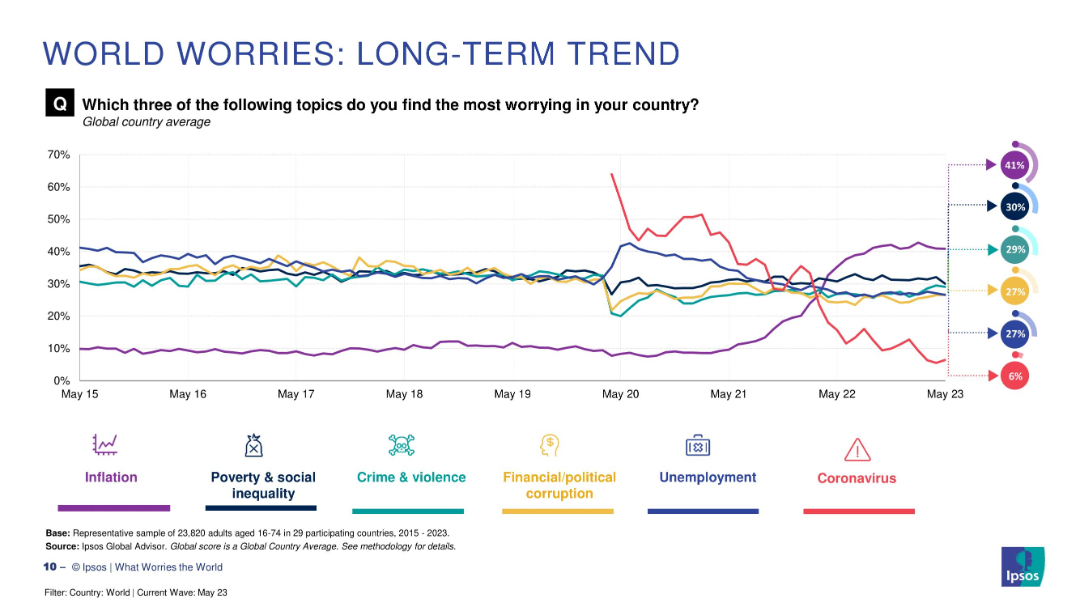
Line chart showing trends for six major global concerns from 2015 to 2023
Market Analysis and Trends
Professional Services
This slide displays long-term worry trends on six issues. Inflation rises sharply post-2020, while concern over coronavirus plummets. Crime, unemployment, and inequality have fluctuated moderately. The data reflects evolving public priorities over time in response to global events and crises.
inflation, long-term, pandemic, crime, public concern
Multiple Chart
IPSOS
Saved
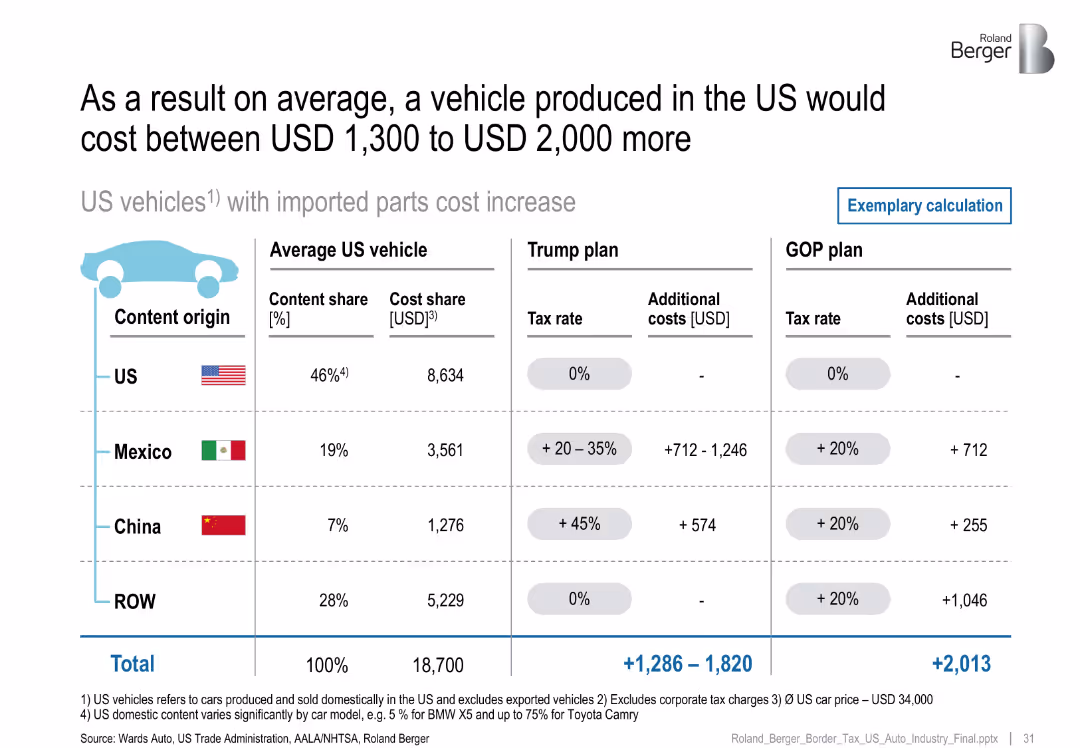
Table showing average vehicle content share by country of origin and associated additional cost per Trump and GOP plans
Financial Performance
Industrial & Manufacturing
Illustrates the compounded cost impact on US-made vehicles due to import tariffs on parts. Shows per vehicle cost increases under both tax scenarios, emphasizing the contribution from Mexican and Chinese components.
vehicle pricing, import parts, tariff impact, cost structure, US production, content share, trade policy
Table
Roland Berger
Saved
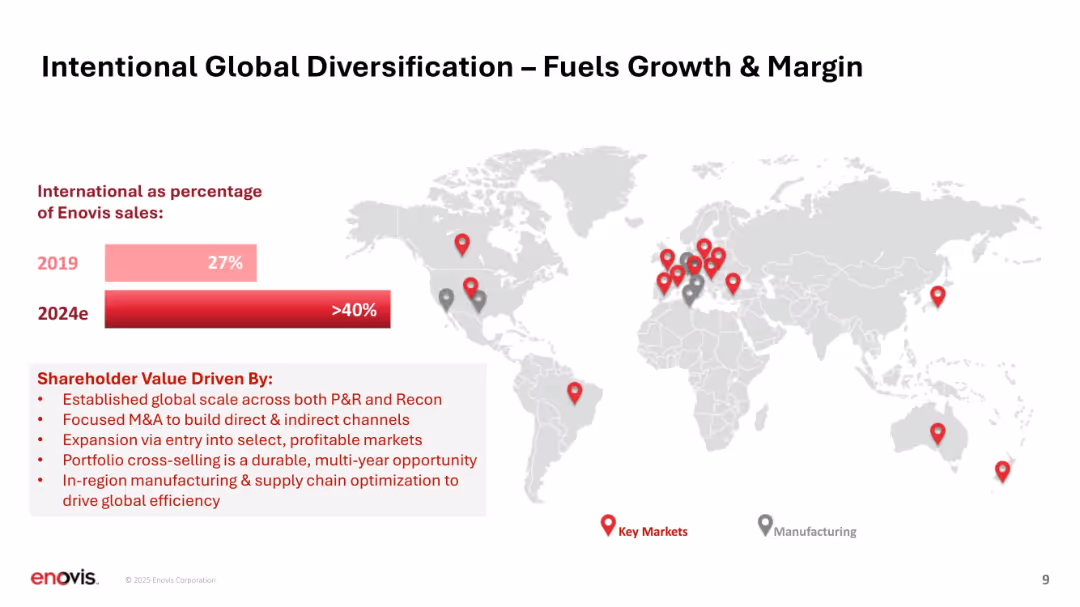
World map with location pins and bar chart comparison (2019 vs. 2024e); text box at bottom.
Strategic Planning
Healthcare & Pharmaceuticals
Demonstrates Enovis's international expansion, with a projected rise in global sales percentage from 27% to over 40%. Highlights shareholder value drivers including M&A, market entry, cross-selling, and supply chain optimization.
international growth, diversification, global strategy, shareholder value, supply chain
Mixed Chart
JP Morgan
Saved
Line chart comparing societal metrics over a decade, focusing on marketing and ecological impact. Accompanied by insights on industry ratings.
Customer and Market Segmentation
Environmental Services & Sustainability
Reviews long-term trends in societal impacts of marketing, especially in pharmaceuticals and finance, noting minimal change in ecological impact ratings.
societal impact, marketing, ecological, decade, trends, pharmaceuticals, finance, environmental sustainability
Mixed Chart
Deloitte
Saved
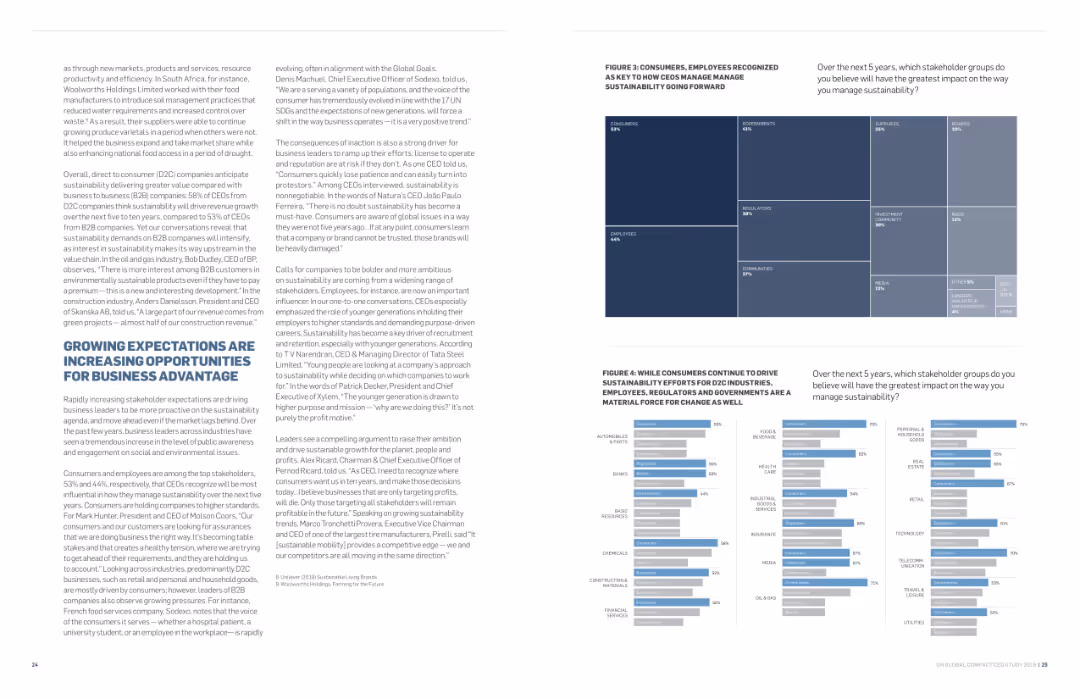
Contains text in two columns with a treemap on the right showing stakeholder groups impacting sustainability. Uses a white background with blue highlights and clear typography.
Strategic Planning
Professional Services
Explores how growing expectations for sustainability are creating business opportunities. The treemap highlights key stakeholder groups like consumers and employees, emphasizing their impact on driving sustainability efforts forward.
sustainability, opportunities, business advantage, expectations, stakeholders
Multiple Chart
Accenture
Saved
Column chart showing agreement and disagreement percentages regarding the desire for a simpler life across countries.
Market Analysis and Trends
Government & Public Sector
The slide analyzes the desire for simplicity in life, particularly in Asia and Latin America, with significant variation across countries.
simplicity, lifestyle, regional trends, Asia, Latin America
Mixed Chart
IPSOS
Saved
The slide features text with a survey bar chart and an image illustrating the importance of communication in acquisitions and stakeholder management.
Mergers and Acquisitions
Professional Services
Analyzes the role of corporate communications in successful acquisitions, emphasizing the need for stakeholder management and communication strategies.
Acquisitions, stakeholder communication, survey, mergers, corporate strategy
Mixed Chart
IPSOS
Saved
The slide contains a combination of bar charts and tables. It compares typical car tenure, importance of residual value, and awareness of car resale value among EV owners, prospects, and sceptics across different regions (APAC, EMEA, North America).
Market Analysis and Trends
Transportation & Logistics
The slide provides insights into the importance of residual value for EV owners compared to sceptics and prospects. It also shows the average car tenure and awareness of resale value among different groups and regions.
car tenure, residual value, resale value, EV owners, prospects, sceptics, regional differences
Multiple Chart
PwC/Strategy&
Saved
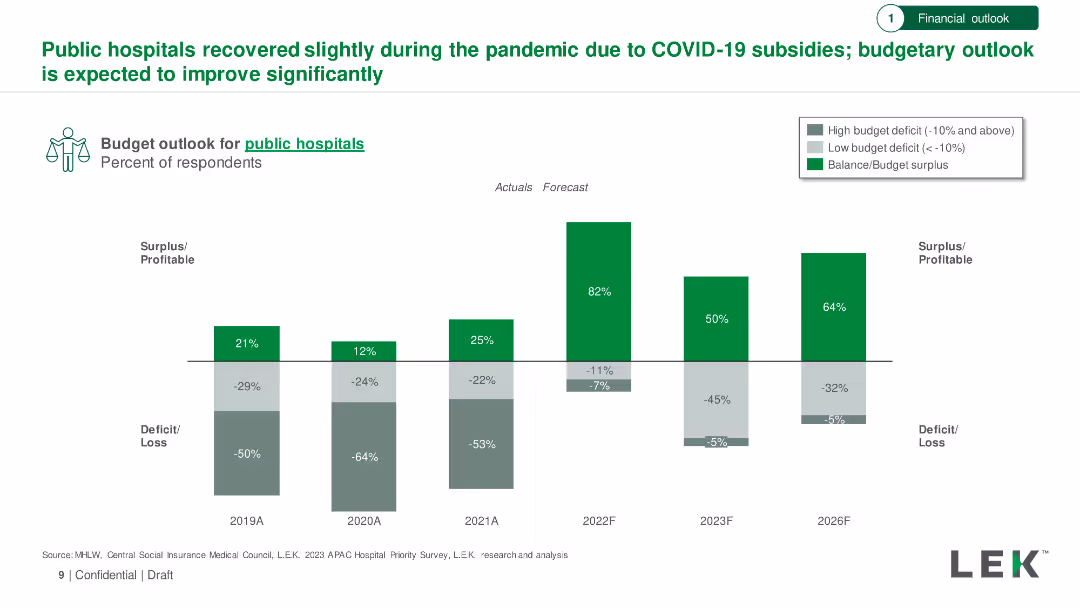
Bar chart showing budget outlook for public hospitals from 2019 to 2026, with actuals and forecasts. Includes surplus/deficit percentages.
Financial Performance
Healthcare & Pharmaceuticals
Analysis of the financial recovery of public hospitals during the pandemic, with an optimistic budget outlook forecasted through 2026.
Public Hospitals, Budget Outlook, COVID-19, Financial Recovery, Forecast
Single Chart
LEK
Saved
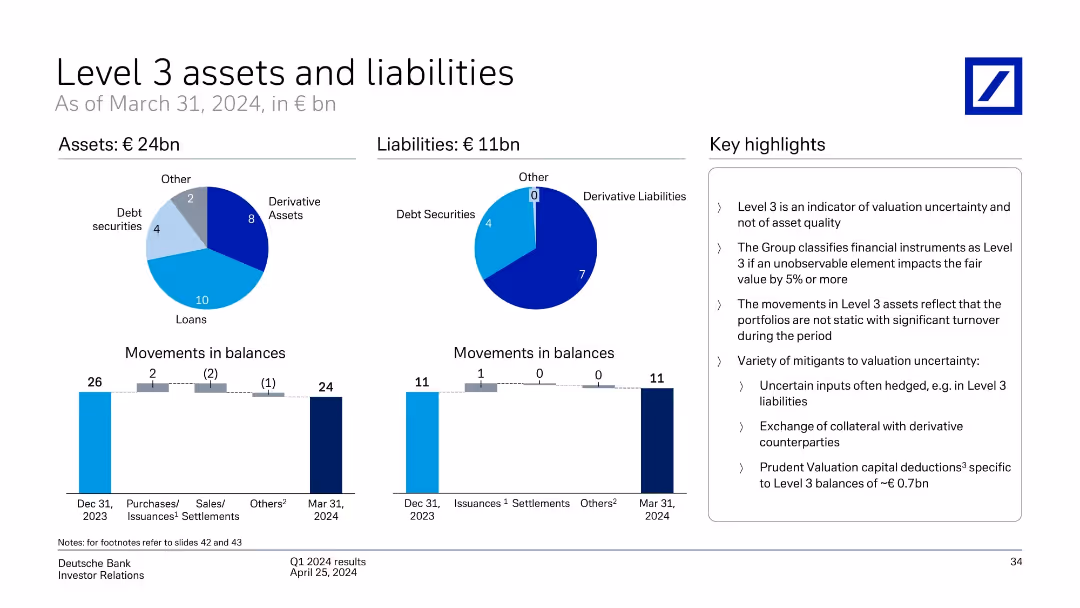
Two pie charts showing asset/liability composition; bar charts showing movements in balances; key points on classification and valuation uncertainty.
Regulatory and Compliance
Financial Services
Shows Deutsche Bank’s Level 3 financial instruments as of March 31, 2024, with €24bn in assets and €11bn in liabilities. Visuals classify asset types (loans, derivatives) and illustrate quarterly changes. Highlights focus on valuation uncertainty, turnover, and mitigating practices.
Level 3 assets, valuation uncertainty, derivative liabilities, Q1 2024, balance movement, Deutsche Bank
Multiple Chart
Deutsche Bank
Saved
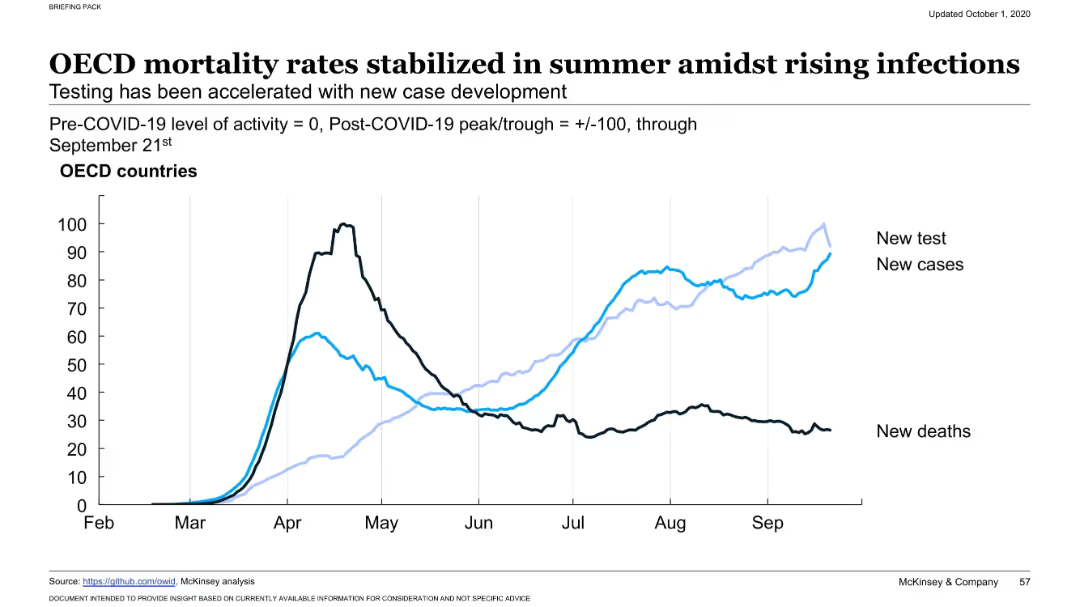
Dual-axis line chart with three data series (new tests, new cases, new deaths) over time. Labels distinguish the series. X-axis runs from February to September. Black and blue lines track different outcomes.
Risk Assessment and Management
Healthcare & Pharmaceuticals
Illustrates that while COVID-19 testing and cases were rising again by late summer, mortality rates in OECD countries had stabilized or declined, implying improved clinical management or treatment effectiveness despite case growth.
COVID-19, OECD, testing rates, new infections, mortality, stabilization, health impact, virus resurgence, summer trend, healthcare capacity
Single Chart
McKinsey
Saved
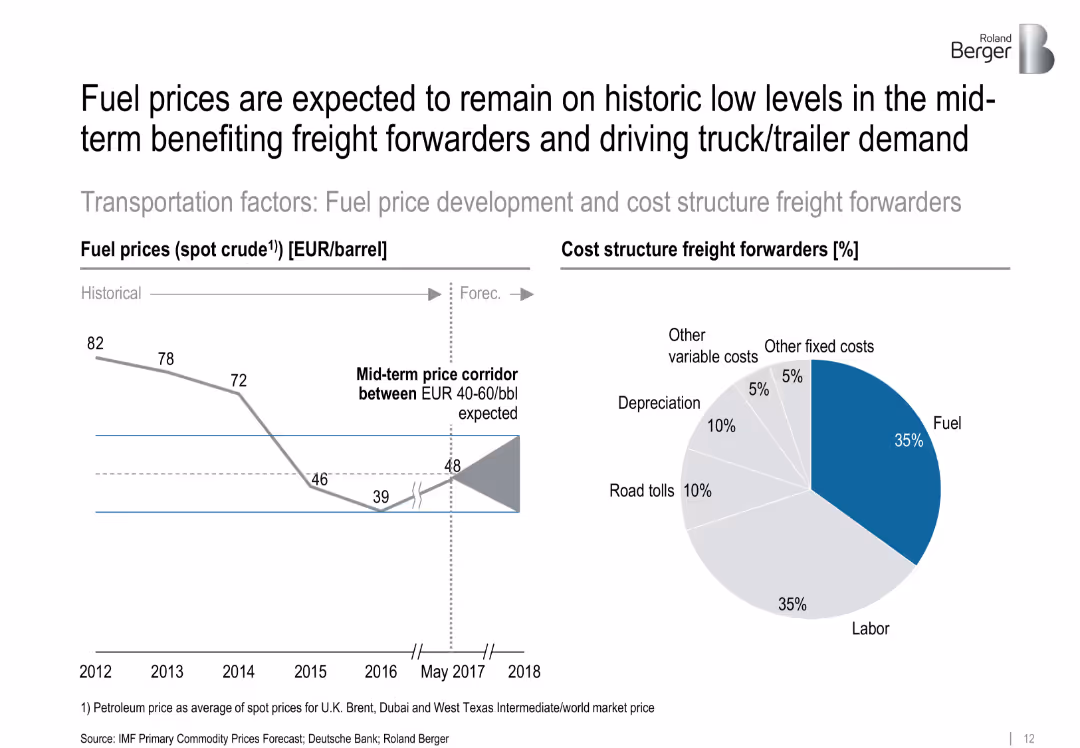
Split chart: left shows historical oil prices with a forecast corridor; right shows pie chart of freight forwarder cost structure. Minimalist style with strong visual cues.
Operational Efficiency
Energy & Utilities
The slide forecasts oil prices staying between €40–60/bbl, benefitting freight forwarders. It also shows a cost breakdown, where fuel and labor make up the majority of expenses, driving demand for efficient freight solutions.
['fuel prices', 'freight forwarding', 'cost structure', 'oil forecast', 'energy costs', 'logistics', 'operational cost']
Multiple Chart
Roland Berger
Saved
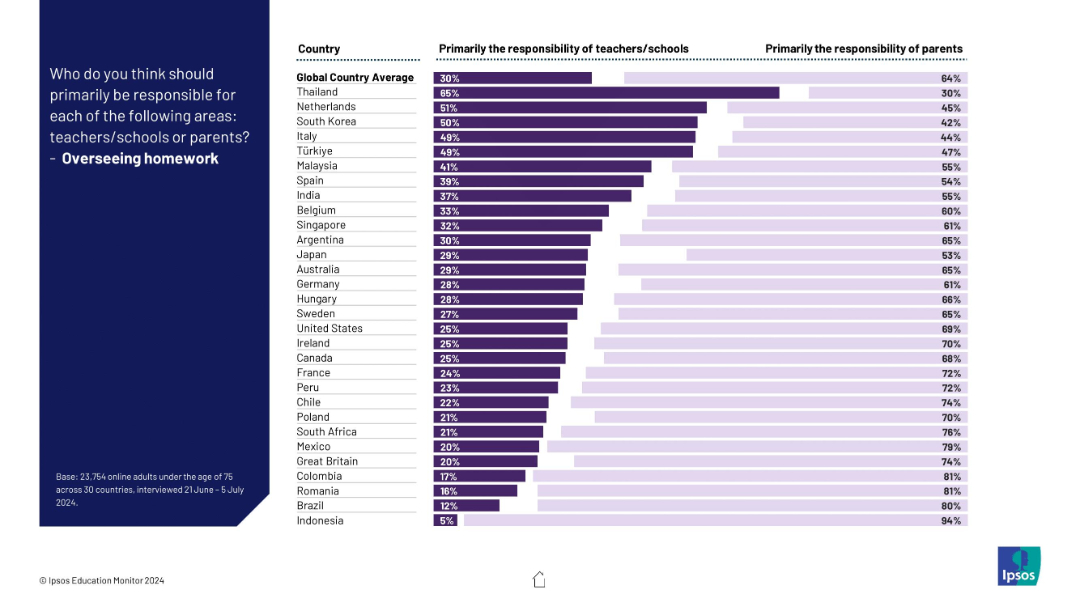
Horizontal bar chart indicating how much each country believes parents vs schools should oversee homework; striking parent-majority views.
Operational Efficiency
Education & Training
This slide examines the global view of who should be in charge of managing homework. In almost all countries, parents are seen as more responsible.
homework, parental involvement, responsibility, education, students, schools, efficiency, global views, Ipsos, learning
Mixed Chart
IPSOS
Saved
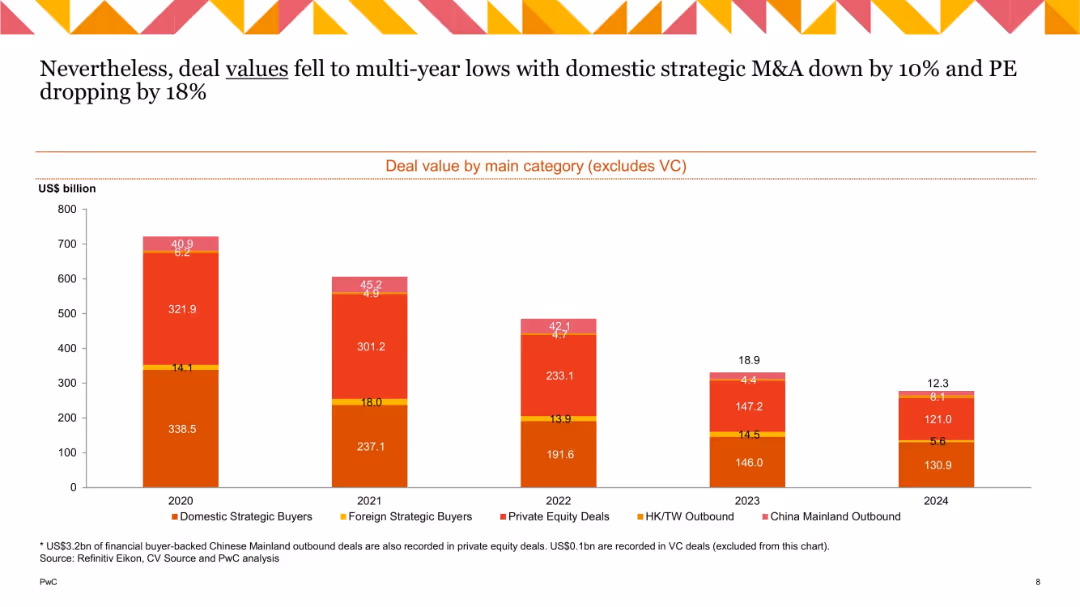
Stacked bar chart (2020–2024) segmented by M&A category; muted red, orange, and yellow colors; value axis on left.
Strategic Planning
Financial Services
Shows the composition of M&A deal value across categories excluding venture capital. Domestic strategic and PE deals saw a significant decline in 2023–24, with PE dropping 18%. Foreign strategic and outbound activity remains limited.
M&A categories, PE, strategic buyers, outbound deals, 2024, deal value
Single Chart
PwC/Strategy&
Saved
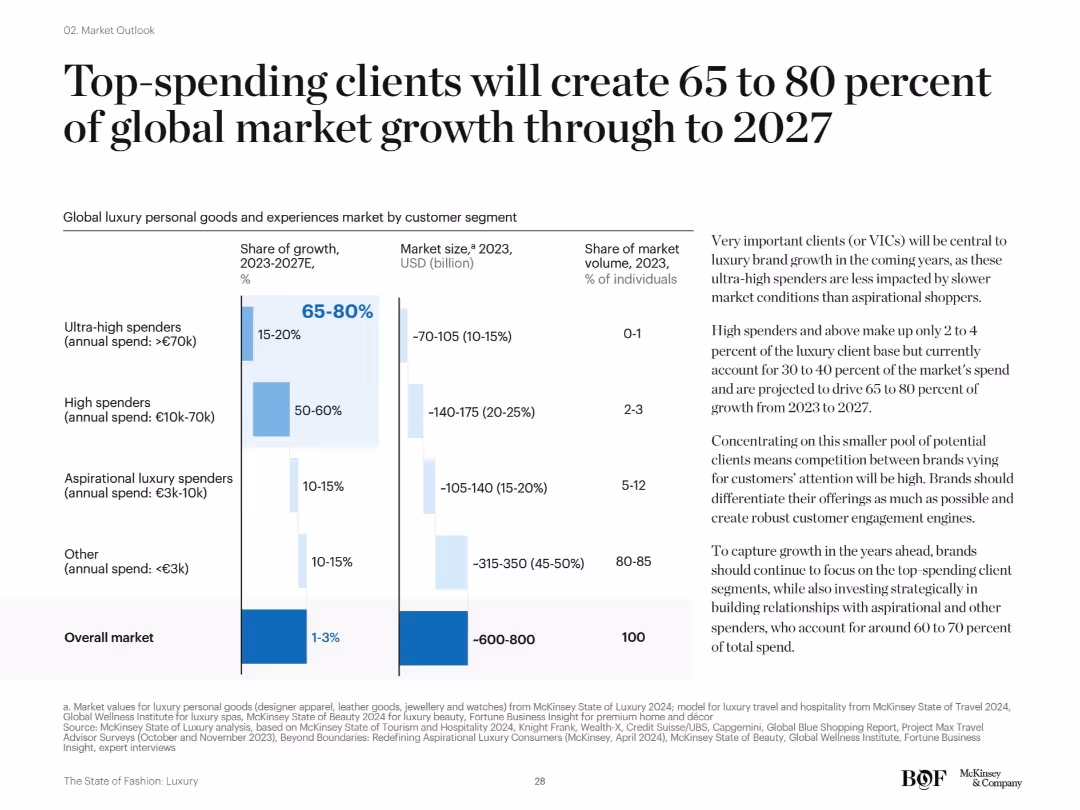
Split layout: bar chart on the left shows market segmentation by spend level and growth share; text on the right provides contextual analysis. Clean design with blue bars and categories clearly separated by spend tiers.
Customer and Market Segmentation
Consumer Goods
The slide highlights that ultra-high and high spenders will drive 65–80% of luxury market growth by 2027, despite representing a small share of consumers. Emphasis is placed on targeting these valuable segments for strategic growth.
VICs, high spenders, market segmentation, luxury growth, forecast 2027, consumer behavior, market share
Mixed Chart
McKinsey
Saved
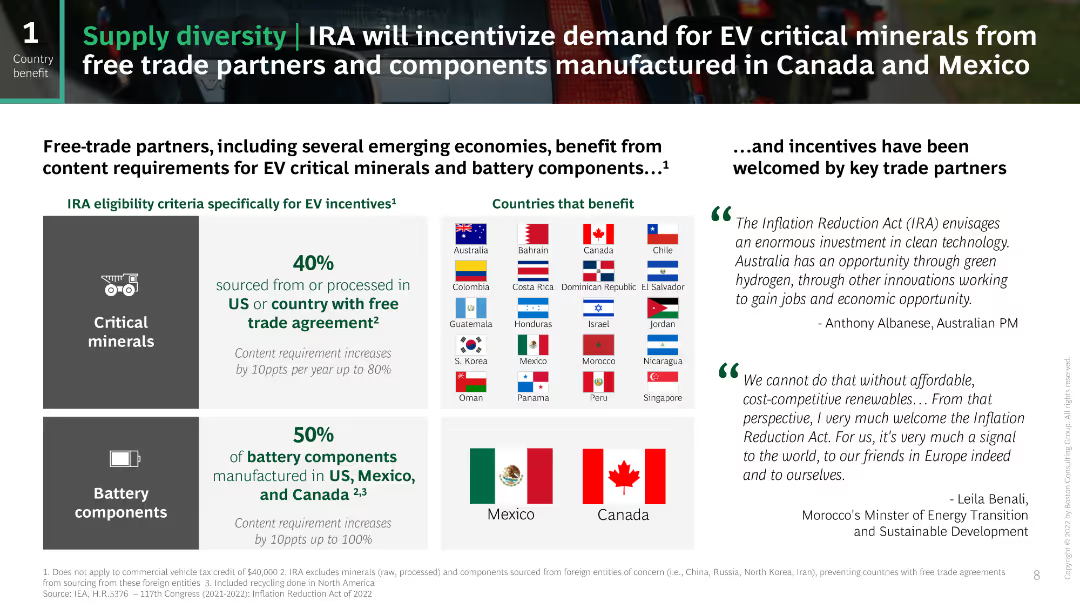
This slide features a two-column layout with text on the left and flags and quotes on the right. The left column has large icons and bullet points, while the right side shows country flags and quotes from international leaders. The design is clean and uses green highlights to emphasize key points.
Strategic Planning
Energy & Utilities
The slide discusses how the Inflation Reduction Act (IRA) incentivizes the use of EV critical minerals and battery components from countries with free trade agreements, highlighting the potential benefits for Canada and Mexico and including quotes from global leaders.
IRA, EV, critical minerals, battery components, trade
Header Horizontal
BCG
Saved
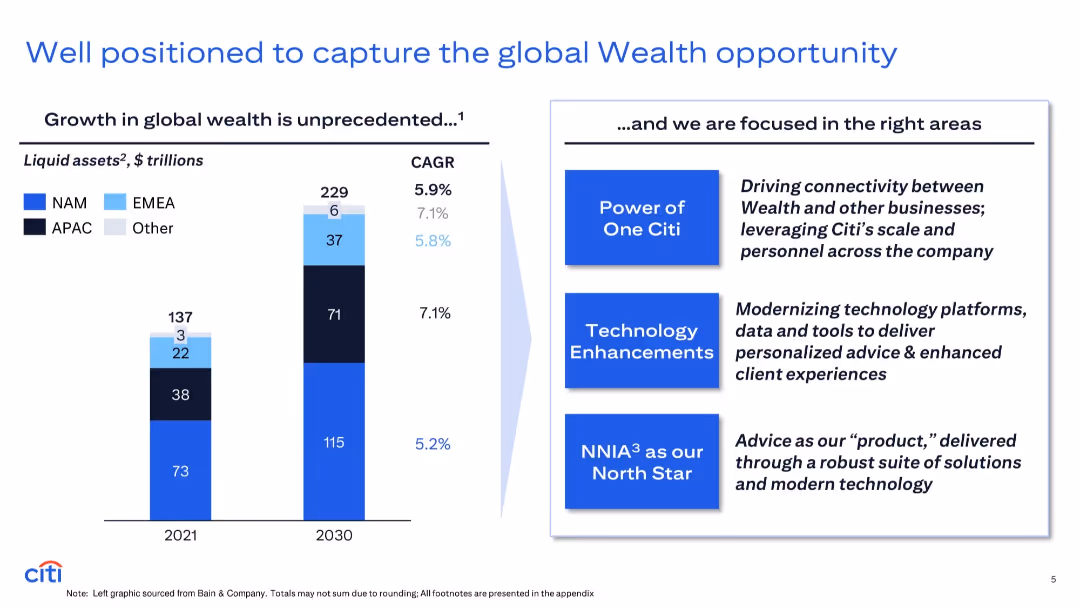
Left: stacked bar chart of global liquid assets (2021 vs. 2030); Right: text boxes outlining Citi’s focus on integration, tech, and advisory models; blue accents and bold sectioning.
Strategic Planning
Financial Services
Highlights the projected growth in global liquid assets across regions, emphasizing a $92T increase by 2030. It also details Citi’s strategic pillars: integration across business lines, technology modernization, and advice-led service models.
global wealth, liquid assets, strategy, technology, advisory
Mixed Chart
Citigroup
Saved
Utilizes bar charts to display projected vaccine production capacities by various manufacturers, highlighting planned figures for end-2020 and end-2021.
Regulatory and Compliance
Healthcare & Pharmaceuticals
Evaluates the global vaccine production capabilities and strategies, with emphasis on scaling up to meet anticipated demand.
vaccine, manufacturing, scale-up, capacity
Mixed Chart
BCG
Saved
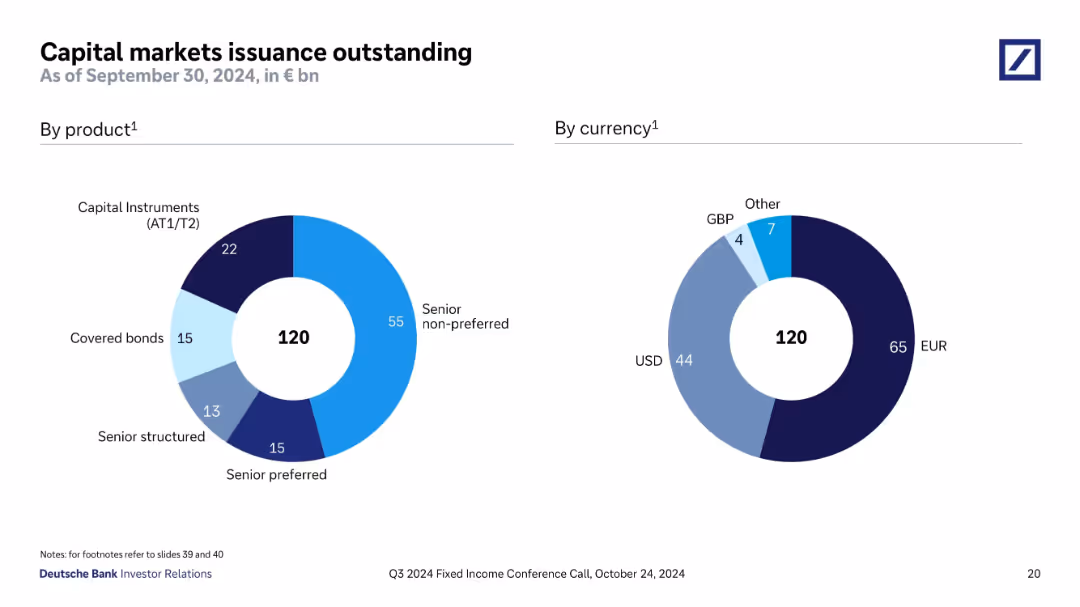
Two donut charts showing €120bn issuance breakdown by product and currency; product types include SNP, AT1/T2, and covered bonds.
Investment Analysis
Financial Services
This slide breaks down Deutsche Bank’s €120bn outstanding capital markets issuance as of Q3 2024. The product distribution is led by senior non-preferred (55), with the majority of currency exposure in EUR (65) and USD (44), indicating strong Euro and Dollar market activity.
capital markets, senior non-preferred, EUR, USD, issuance, bonds, Deutsche Bank
Single Chart
Deutsche Bank
Saved
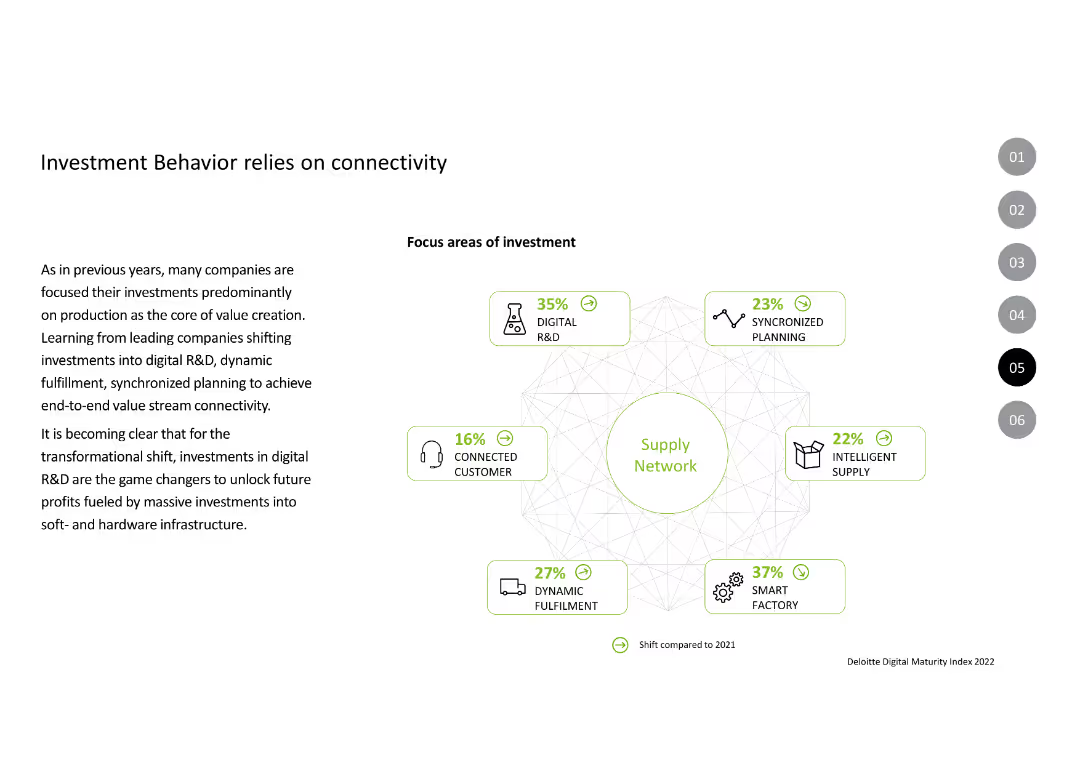
This slide includes an infographic depicting various focus areas of investment around a central "Supply Network" theme. Each area is color-coded, with icons and percentage figures showing investment shifts compared to the previous year. Text is aligned on the left, explaining investment focus changes.
Strategic Planning
Technology & Software
Emphasizes the importance of connectivity in investment strategies, detailing areas like digital R&D, synchronized planning, and intelligent supply. Describes how these areas contribute to a transformational shift in value creation and future profitability.
Connectivity, Investment, R&D, Supply, Planning
Diagram
Deloitte
Saved
Previous
Next
If nothing, comes up, please save your slides first
Create a FREE account to continue browsing
Receive Instant Access to 1,000+ slides from companies like McKinsey, Google, and Goldman Sachs
First Name
Last Name
Email
Password
I agree to all
Terms & Privacy Policy
Thank you! Your submission has been received!
Oops! Something went wrong while submitting the form.
Have an account?
Sign in
Column Chart
Heatmap
Chevron
Org Chart
Infographic
Callouts
Timeline
List
Graphic
Picture
Process Flow
Diagram
Paragraph
Map
Table
Framework
Subtitle
Takeaway Box
Icon
Other Chart
Radar Chart
Waterfall Chart
Mekko Chart
Pie Chart
Scatter Plot
Line Chart
Bar chart
Bullet points