My Account
My Slides
Search by Category
Templates
Leave Feedback
Login
Logout
Get Started
Browse all Slides
Browse all Slides
Create a FREE Account
Instant access to 1,000+ real slides from top companies like McKinsey, BCG, Goldman Sachs, Google and many more!
First Name
Last Name
Email
Password
I agree to all
Terms & Privacy Policy
Thank you! Your submission has been received!
Oops! Something went wrong while submitting the form.
Have an account?
Sign in
Saved Slides
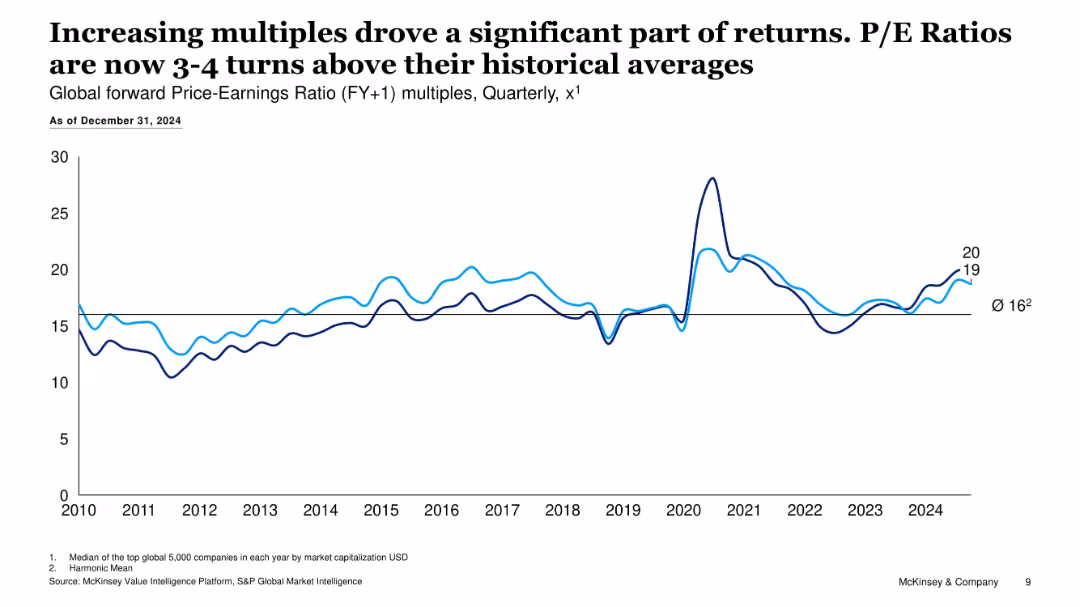
Line chart tracking P/E ratio over time (2010–2024) with two data lines
Investment Analysis
Financial Services
Shows that forward P/E multiples have risen 3–4 turns above historical averages, contributing notably to 2024 returns, indicating valuation-driven performance.
P/E ratio, market multiples, earnings, valuation trends, return drivers
Single Chart
McKinsey
Saved
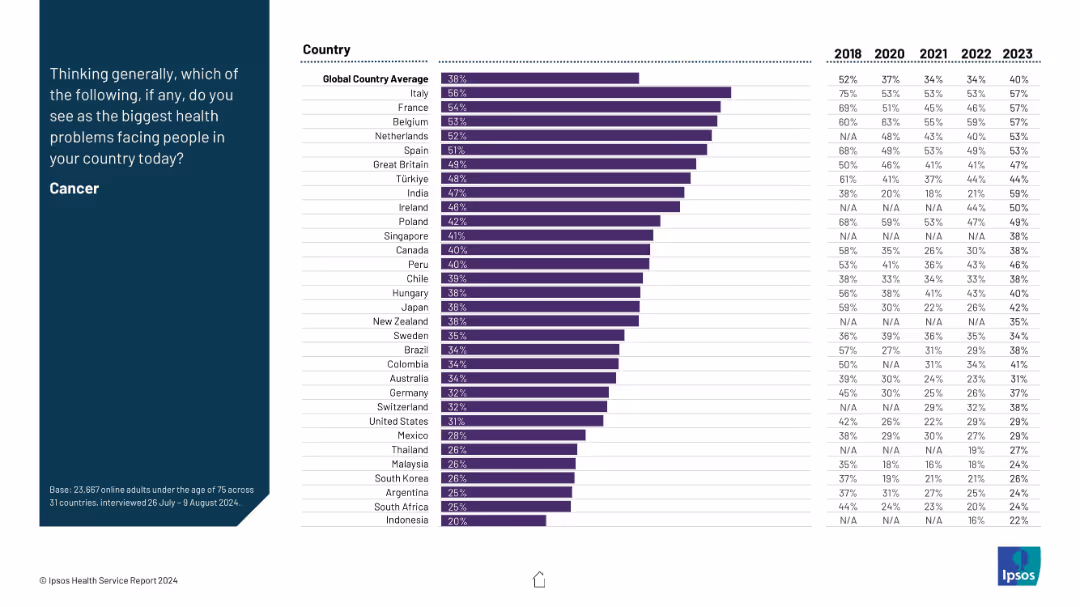
Horizontal bar chart on right with country names and percentage values for each year (2018–2023); left column contains the prompt and title.
Market Analysis and Trends
Healthcare & Pharmaceuticals
The slide highlights perceptions of cancer as the biggest health problem in different countries, along with trends over six years. Italy, France, and Belgium report the highest concern in 2023, while Indonesia has the lowest. The global average remained around 38% in 2023.
cancer, health concerns, global trends, survey, healthcare
Mixed Chart
IPSOS
Saved
A bar chart comparing Millennials and Gen Z on financial prudence and ability to cope with financial crises, with percentage indicators for various financial metrics.
Financial Performance
Financial Services
This slide examines long-term financial concerns and short-term financial comfort among Millennials and Gen Z, focusing on their ability to handle financial crises.
Financial concerns, short-term comfort, Millennials, Gen Z, financial prudence, financial metrics, comparison, financial crisis
Mixed Chart
Deloitte
Saved
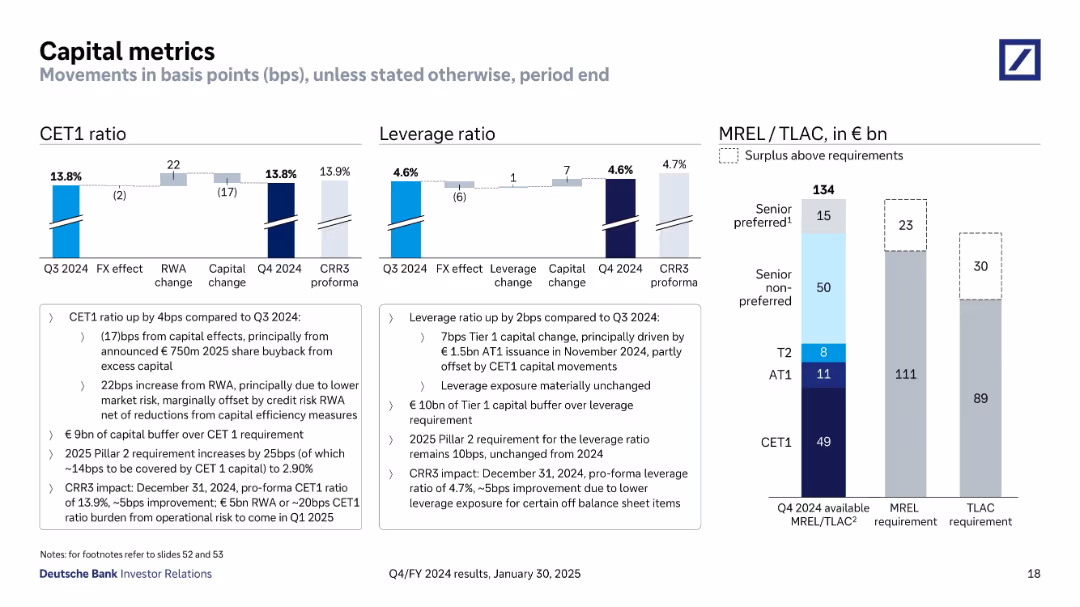
Three-part layout showing CET1 ratio, leverage ratio, and MREL/TLAC surplus. Includes annotated arrows and percentage point breakdowns.
Regulatory and Compliance
Financial Services
Details movements in Deutsche Bank’s CET1 and leverage ratios with explanations for changes in capital, FX, and risk-weighted assets. Includes surplus buffers over regulatory capital requirements for MREL and TLAC. Emphasizes strong capital position.
capital metrics, CET1, leverage, MREL, TLAC, regulatory capital
Multiple Chart
Deutsche Bank
Saved
Features a global map, icons of digital wallets like Apple Pay, and blue boxes depicting the digital wallet strategy of Citi. It includes various digital payment methods and strategic deployment across different continents.
Technology and Digital Transformation
Financial Services
Explains Citi's approach to leveraging digital wallets to expand e-commerce engagement globally. The slide highlights strategic initiatives for building a centralized platform capable of supporting diverse digital solutions and the localized deployment based on market needs.
e-commerce, digital wallets, global strategy, payment systems, digital platforms
Diagram
Citigroup
Saved
The slide features multiple tables, bar graphs and column charts, detailing quarterly financial metrics like revenues, assets under management, and net flows. The layout is clean with clearly labeled sections and contrasting colors to distinguish different data points.
Financial Performance
Financial Services
This slide presents Q4 2023 financial results for a private banking division, highlighting revenue growth and net asset flows. It is used to analyze financial health and performance trends.
banking, financial results, revenue growth, asset management, Q4 2023
Multiple Chart
Deutsche Bank
Saved
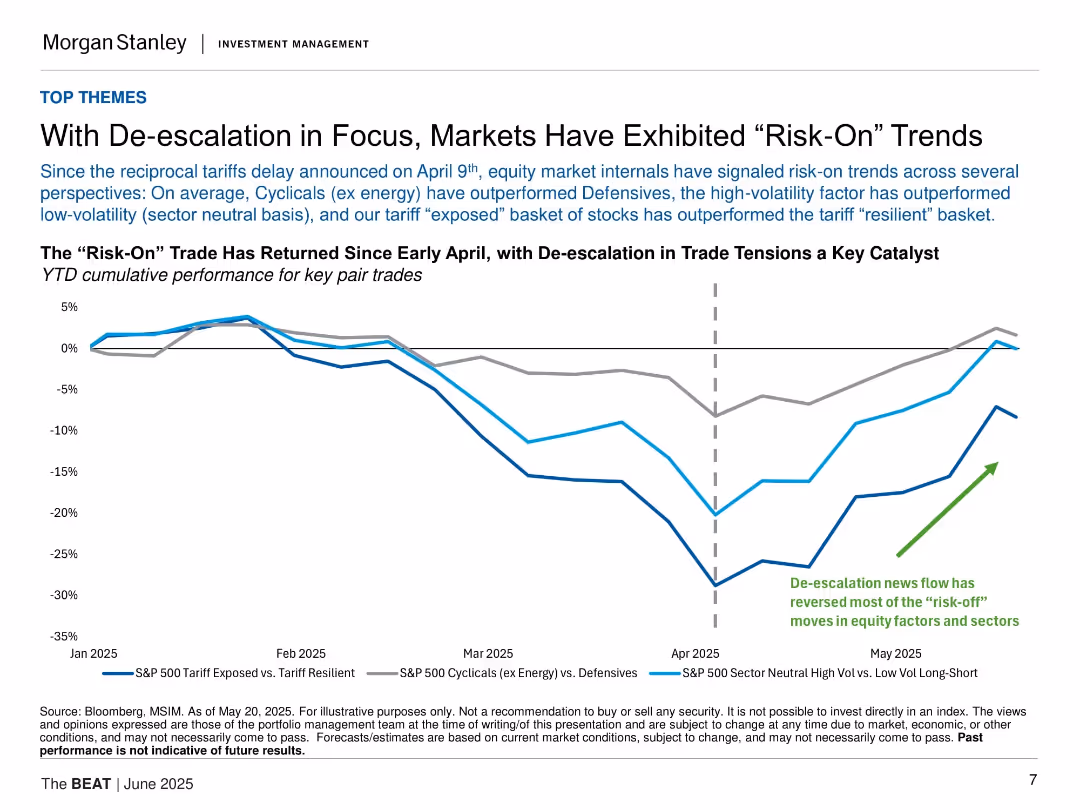
Line chart tracking three equity pair trade performances YTD; annotated with vertical line for April tariff delay; includes labeled color-coded lines.
Market Analysis and Trends
Financial Services
Shows return of “risk-on” market behavior following April tariff de-escalation. Cyclicals, high-volatility, and tariff-exposed equities outperformed their defensive or resilient counterparts. Suggests sentiment shift linked to improved trade outlook.
risk-on, equities, tariffs, market trends, volatility
Single Chart
Morgan Stanley
Saved
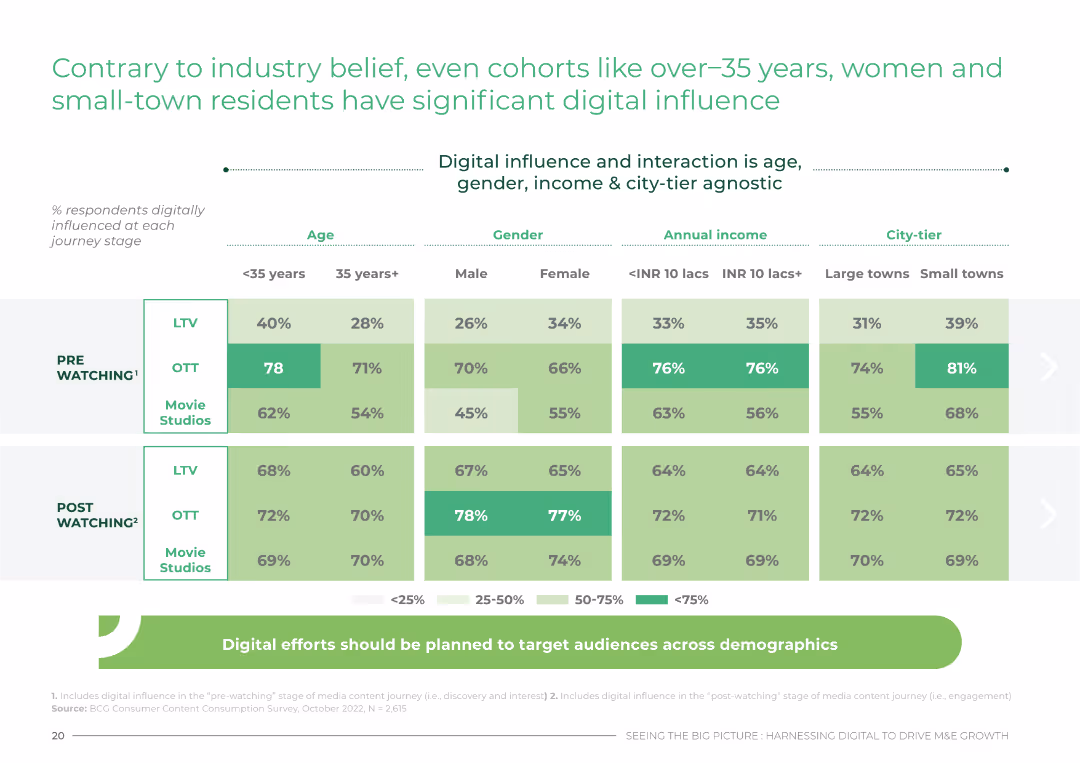
Data table showing digital influence across various demographics, including age, gender, income, and city-tier.
Customer and Market Segmentation
Media & Entertainment
This slide challenges industry beliefs by showing significant digital influence among diverse demographics in India, including over-35s and small-town residents.
digital, influence, demographics, India, segmentation
Table
BCG
Saved
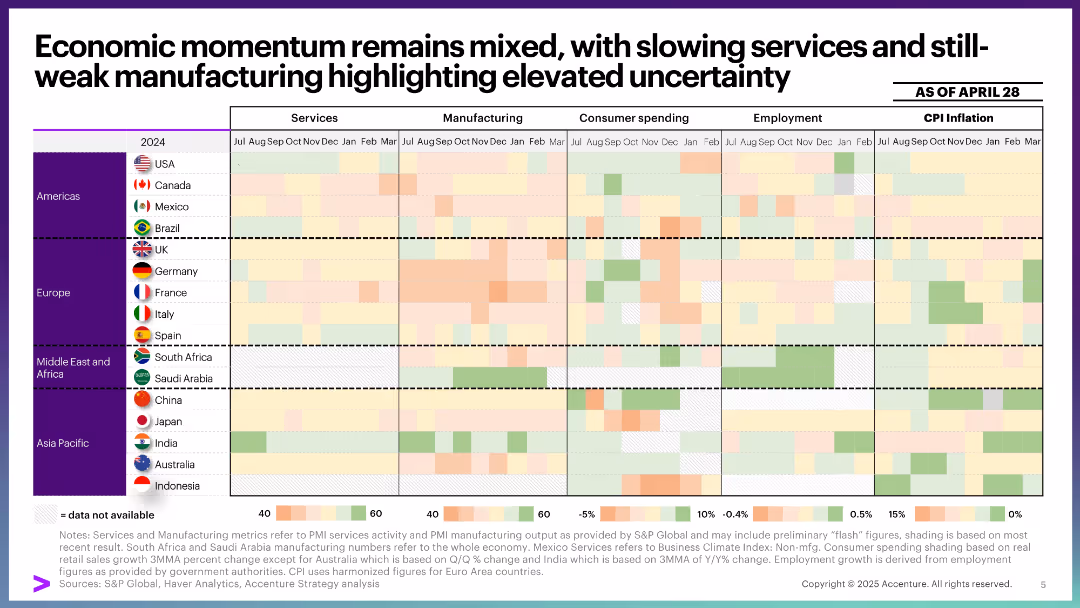
Matrix-style heatmap table with countries as rows and metrics (services, manufacturing, spending, employment, inflation) as columns. Color-coded by performance intensity.
Performance Metrics and KPIs
Professional Services
Shows country-level economic performance across five key metrics through monthly snapshots. Highlights regional differences in economic momentum, with manufacturing notably weak and inflation varied. A tool for cross-comparative economic health evaluation.
economic momentum, services, manufacturing, CPI, employment, spending, heatmap, performance, macroeconomics, global outlook
Single Chart
Accenture
Saved
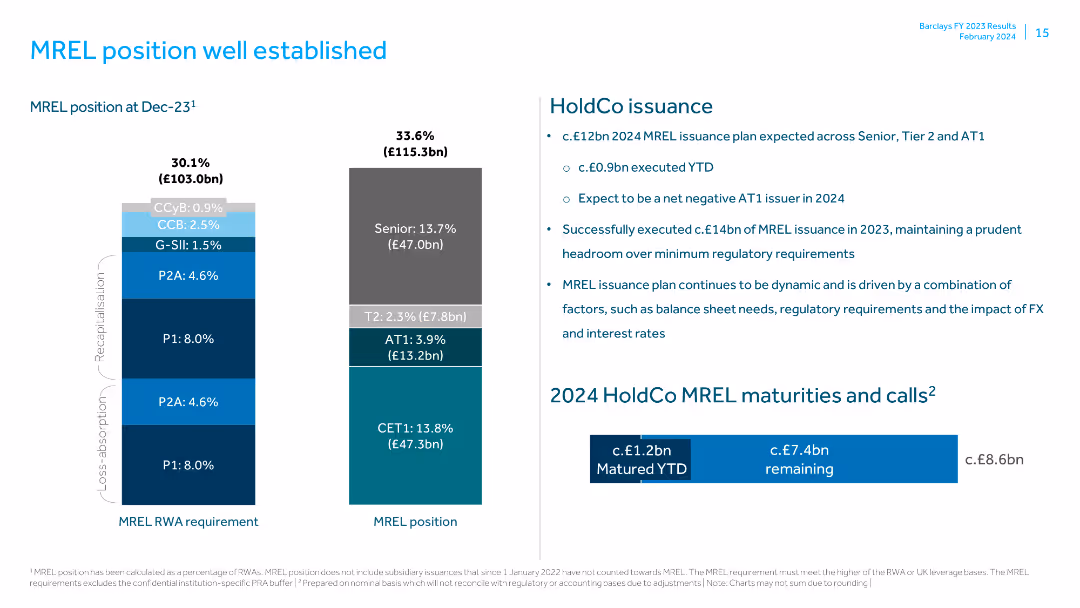
Features a column chart displaying MREL position at Dec-23 and MREL RWA requirement, along with text boxes for HoldCo issuance details.
Risk Assessment and Management
Financial Services
Explains the MREL position and issuance plans, highlighting the successful execution of MREL issuance and its impact on regulatory requirements.
MREL position, HoldCo issuance, regulatory requirements, MREL RWA, senior issuance, Tier 2, AT1, CET1, balance sheet, FX impact
Multiple Chart
Barclays
Saved
The slide features a flowchart depicting the order of magnitude of CO2 storage and utilization. It includes branches for conversion and non-conversion processes with specific applications like mineralization, biological, chemical, etc.
Technology and Digital Transformation
Environmental Services & Sustainability
The slide outlines the various technological pathways and their respective capacities for CO2 utilization and storage, showcasing a broad range of solutions for either using or storing carbon dioxide.
CO2 utilization, storage, technology, pathways, conversion processes
Diagram
Kearney
Saved
A circular diagram with icons and descriptions detailing how social media platforms serve as one-stop SME solutions.
Strategic Planning
Media & Entertainment
The slide depicts the expansion of social media platforms into comprehensive SME services, highlighting the role of platforms like Facebook, WhatsApp, and Instagram in SME marketing, sales, and sourcing. It's indicative of the strategic shift of social media giants to encompass total SME solutions, acting as a discussion point for SME marketing and digital strategy.
Social Media, SME Solutions, Marketing, Sales, Sourcing, Strategy
Diagram
Kearney
Saved
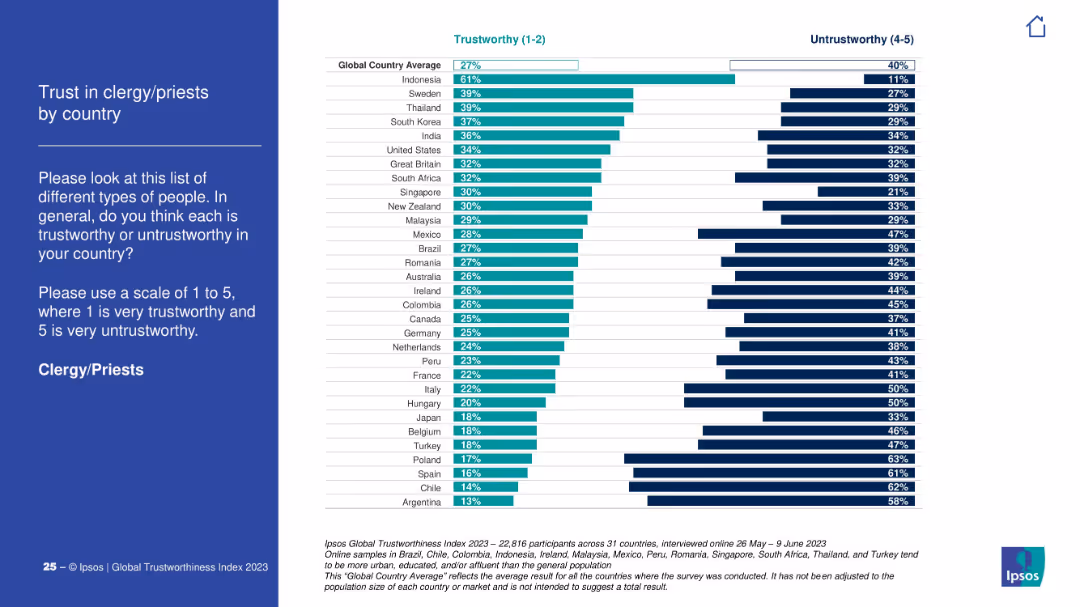
Classic Ipsos format with white-on-blue text left and bar chart right showing perceptions of clergy/priests across 31 countries.
Risk Assessment and Management
Government & Public Sector
This slide presents the trust index for clergy/priests. Indonesia leads in perceived trustworthiness; Argentina and Chile score lowest with high distrust levels.
clergy, religion, public trust, priest, faith, Ipsos, bar chart, 2023
Mixed Chart
IPSOS
Saved
Map of Europe showing bank coverage, icons representing key statistics such as number of banks, branches, dimensions analyzed, and annual records database. Purple color scheme.
Market Analysis and Trends
Financial Services
Provides an overview of the 2024 Retail Banking Radar, tracking 89 retail banks across 21 European markets, detailing coverage, branches, dimensions analyzed, and annual records.
Europe, retail banks, coverage, branches, dimensions
Graphic
Kearney
Saved
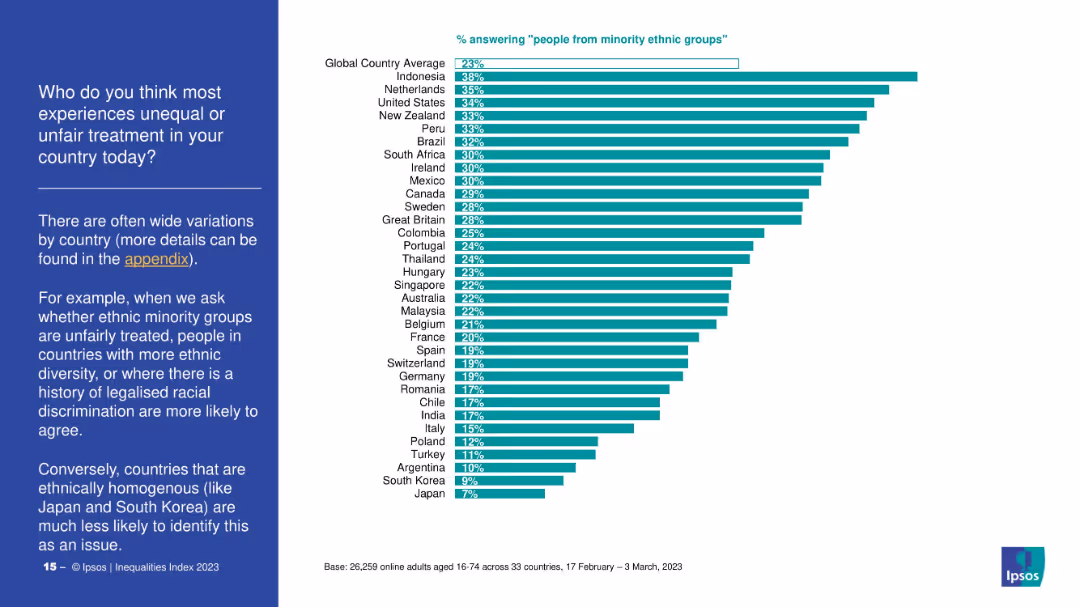
Horizontal bar chart comparing countries on how many people say ethnic minorities face discrimination. Left panel explains variability by national context. Data from 33 countries shown.
Market Analysis and Trends
Government & Public Sector
This slide presents global variation in perceptions of discrimination against ethnic minorities. Countries with diverse populations or histories of legalized racial discrimination report higher concern, while more homogenous countries show less concern.
global comparison, ethnic minorities, diversity, discrimination, Ipsos, public opinion, inequality, country ranking
Mixed Chart
IPSOS
Saved
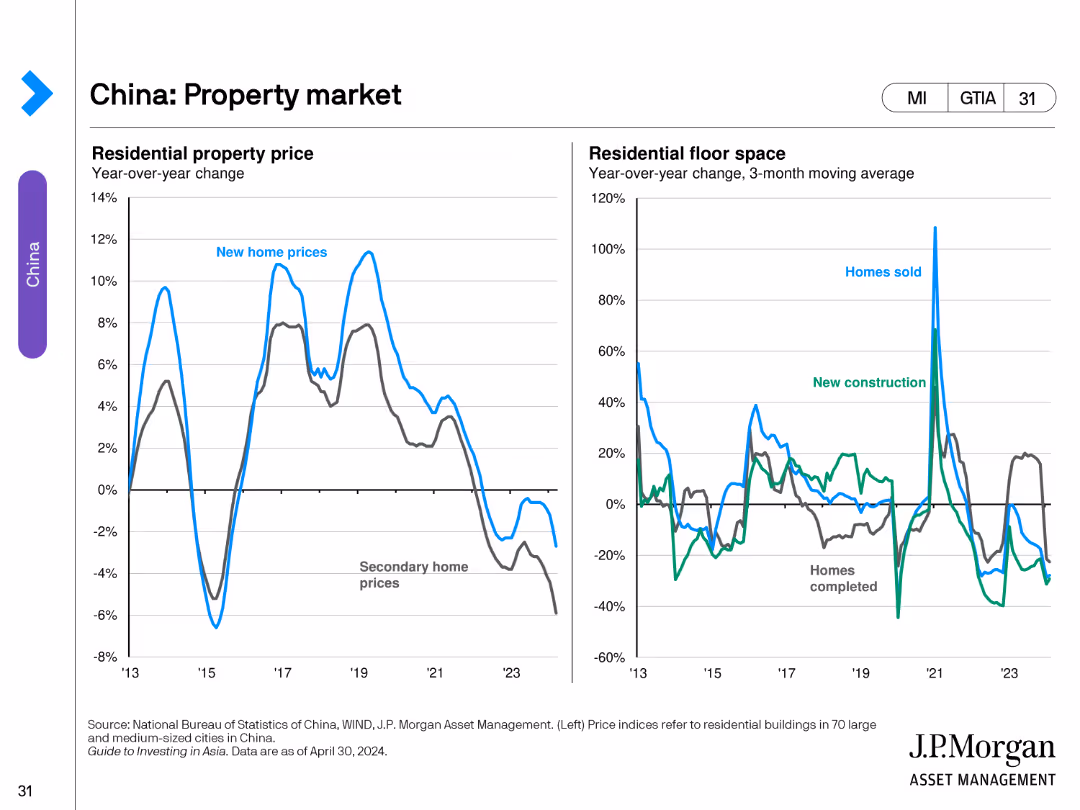
The slide includes two line charts. The left chart shows year-over-year changes in residential property prices. The right chart illustrates year-over-year changes in residential floor space for homes sold and new constructions.
Market Analysis and Trends
Real Estate & Construction
This slide evaluates the property market in China, analyzing trends in residential property prices and residential floor space changes.
Property, Market, China, Prices, Construction
Multiple Chart
JP Morgan
Saved
This slide contains a column chart showing global agreement levels on self-determination, with countries listed along the x-axis and percentages along the y-axis.
Market Analysis and Trends
Government & Public Sector
It presents data on the global consensus regarding the right to self-determination, emphasizing the importance of individuals working out their principles to guide decisions.
self-determination, global consensus, principles, agreement, column chart, countries, percentages
Multiple Chart
IPSOS
Saved
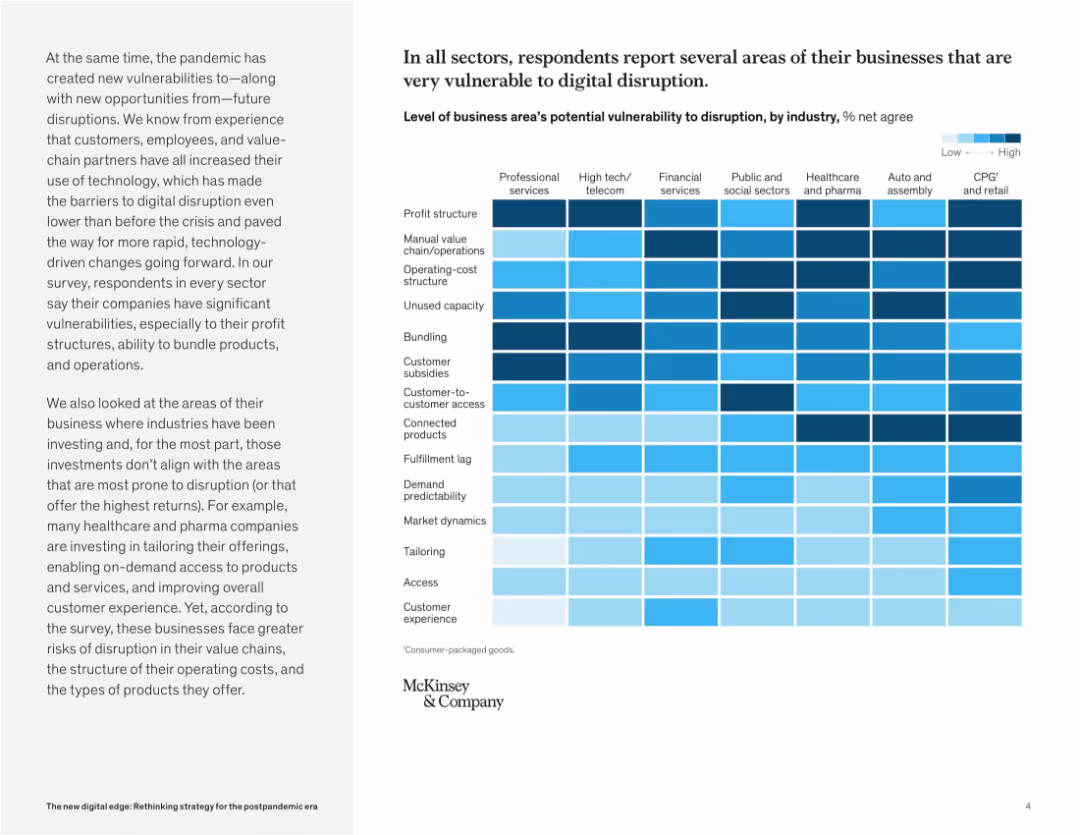
Heatmap chart dominates the right side, showing digital vulnerability levels by business area and industry. Left panel provides context and insights.
Risk Assessment and Management
Technology & Software
This slide presents a heatmap revealing how vulnerable different industries are to digital disruption. Profit structures, customer access, and bundling are common weak points. The chart emphasizes where companies may face operational or structural threats.
digital disruption, business risk, vulnerability, industry comparison, technology impact, customer access, operations, transformation
Mixed Chart
McKinsey
Saved
Two gauge-like diagrams; one for HR Managers and another for CEOs, each indicating their perception of HR's impact on organizational success through a color gradient from red to yellow.
Market Analysis and Trends
Professional Services
Evaluates how different organizational roles perceive the impact of HR on success, indicating overall sentiment and possible areas for HR development and intervention.
HR, impact, success, perception, management, organizational roles
Multiple Chart
PwC/Strategy&
Saved
Features three pie charts detailing the growing familiarity with the metaverse, accompanied by a photograph of a woman using VR gear.
Market Analysis and Trends
Telecommunications
Discusses increasing public knowledge and interest in the metaverse, reflecting broader trends in technology engagement.
metaverse, technology adoption, VR, public knowledge, market trends
Multiple Chart
Deloitte
Saved
This comparison slide features two columns contrasting classical and quantum computers. Icons and contrasting colors clearly distinguish between the two types, providing an easy-to-follow comparison that is visually simple and effective for educational purposes.
Technology and Digital Transformation
Technology & Software
Exploring the differences between classical and quantum computing, the slide elucidates on storage, computation, performance, and the pros and cons of each. It's tailored to an audience curious about the fundamental changes quantum computing brings compared to traditional computing methods.
Quantum Computing, Comparison, Education
Header Vertical
McKinsey
Saved
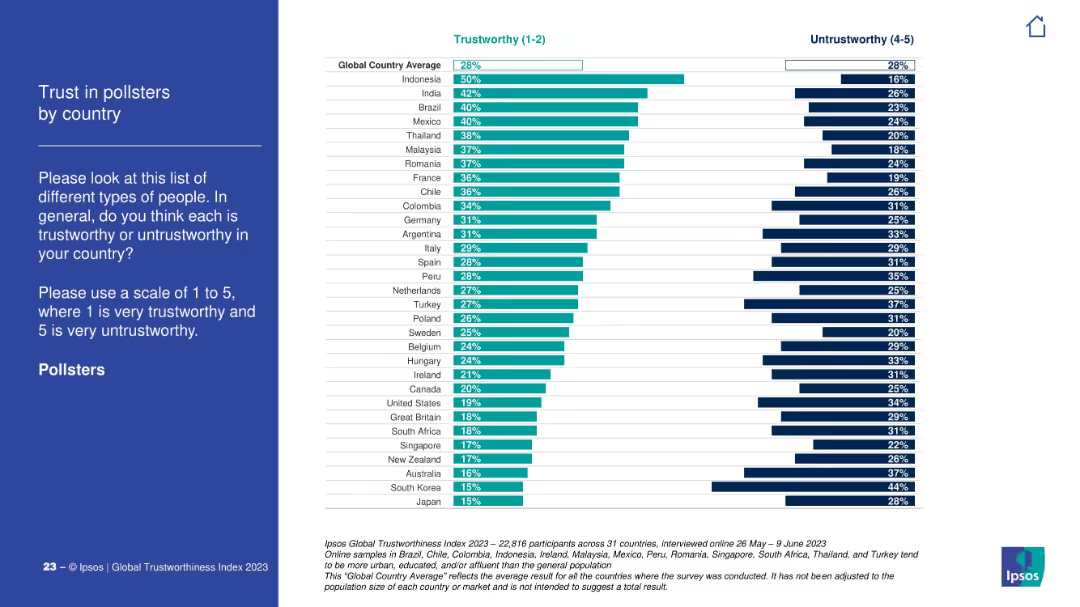
Left panel with title and description in white on blue. Right panel is a horizontal bar chart comparing "Trustworthy" vs. "Untrustworthy" by country.
Market Analysis and Trends
Media & Entertainment
The slide shows public trust levels in pollsters across countries based on Ipsos' 2023 global survey. It compares ratings on a 1–5 scale, highlighting notable disparities.
trust, pollsters, perception, global, country, Ipsos, bar chart, opinion, media, rating
Mixed Chart
IPSOS
Saved
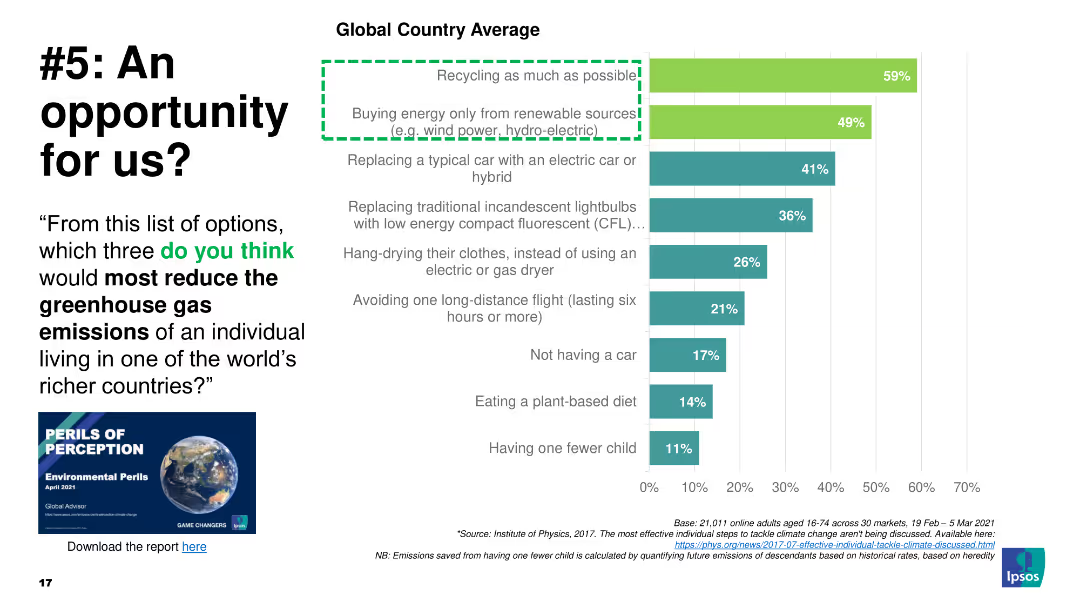
Column chart of actions to reduce greenhouse gas emissions, highlighting recycling and renewable energy
Market Analysis and Trends
Environmental Services & Sustainability
The slide asks which actions most reduce greenhouse gases, with recycling and renewables as top choices
greenhouse gas, emissions, recycling, energy, actions
Mixed Chart
IPSOS
Saved
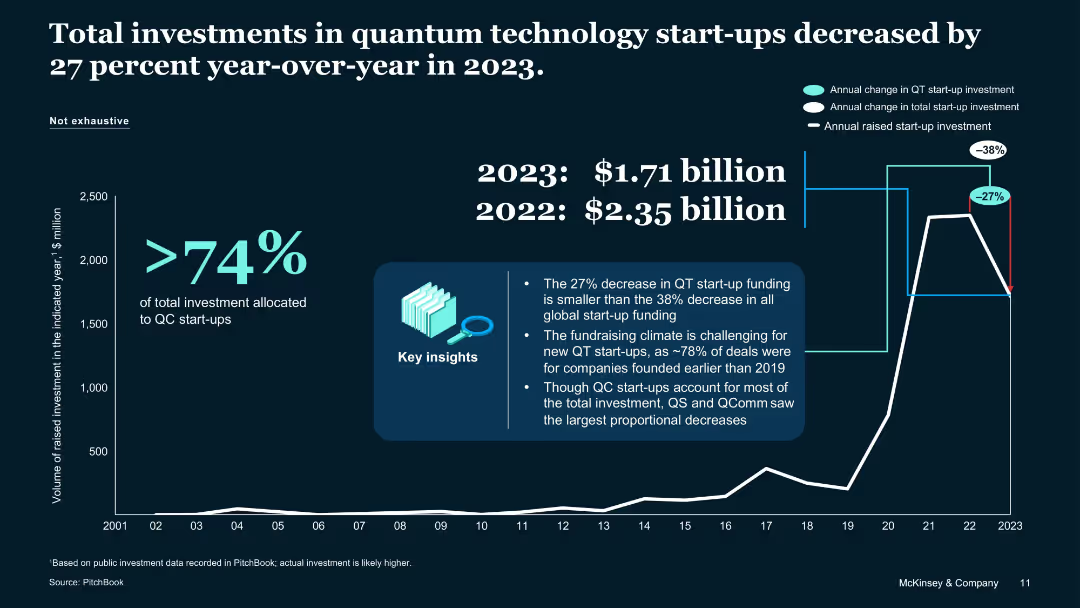
Chart-heavy layout with percentage callouts, key insights box, and year comparison
Investment Analysis
Artificial Intelligence
Highlights a 27% drop in QT start-up investments from 2022 to 2023. Emphasizes that QC start-ups received most funding while QS and QComm saw sharper declines. Notes 2023's total investment as $1.71B, down from $2.35B in 2022.
QT investment, QC funding, startup decline, PitchBook, 2023 vs 2022
Single Chart
McKinsey
Saved
The slide features a column chart showing percentages of investments bought during the pandemic, with text describing the data. Clean white background.
Market Analysis and Trends
Financial Services
This slide presents data on the percentage of investments bought by Canadian investors during the pandemic, showing that a significant number of investors were buying rather than selling.
investments bought, pandemic, Canadian investors, data analysis, COVID-19
Mixed Chart
IPSOS
Saved
Previous
Next
If nothing, comes up, please save your slides first
Create a FREE account to continue browsing
Receive Instant Access to 1,000+ slides from companies like McKinsey, Google, and Goldman Sachs
First Name
Last Name
Email
Password
I agree to all
Terms & Privacy Policy
Thank you! Your submission has been received!
Oops! Something went wrong while submitting the form.
Have an account?
Sign in
Column Chart
Heatmap
Chevron
Org Chart
Infographic
Callouts
Timeline
List
Graphic
Picture
Process Flow
Diagram
Paragraph
Map
Table
Framework
Subtitle
Takeaway Box
Icon
Other Chart
Radar Chart
Waterfall Chart
Mekko Chart
Pie Chart
Scatter Plot
Line Chart
Bar chart
Bullet points