My Account
My Slides
Search by Category
Templates
Leave Feedback
Login
Logout
Get Started
Browse all Slides
Browse all Slides
Create a FREE Account
Instant access to 1,000+ real slides from top companies like McKinsey, BCG, Goldman Sachs, Google and many more!
First Name
Last Name
Email
Password
I agree to all
Terms & Privacy Policy
Thank you! Your submission has been received!
Oops! Something went wrong while submitting the form.
Have an account?
Sign in
Saved Slides
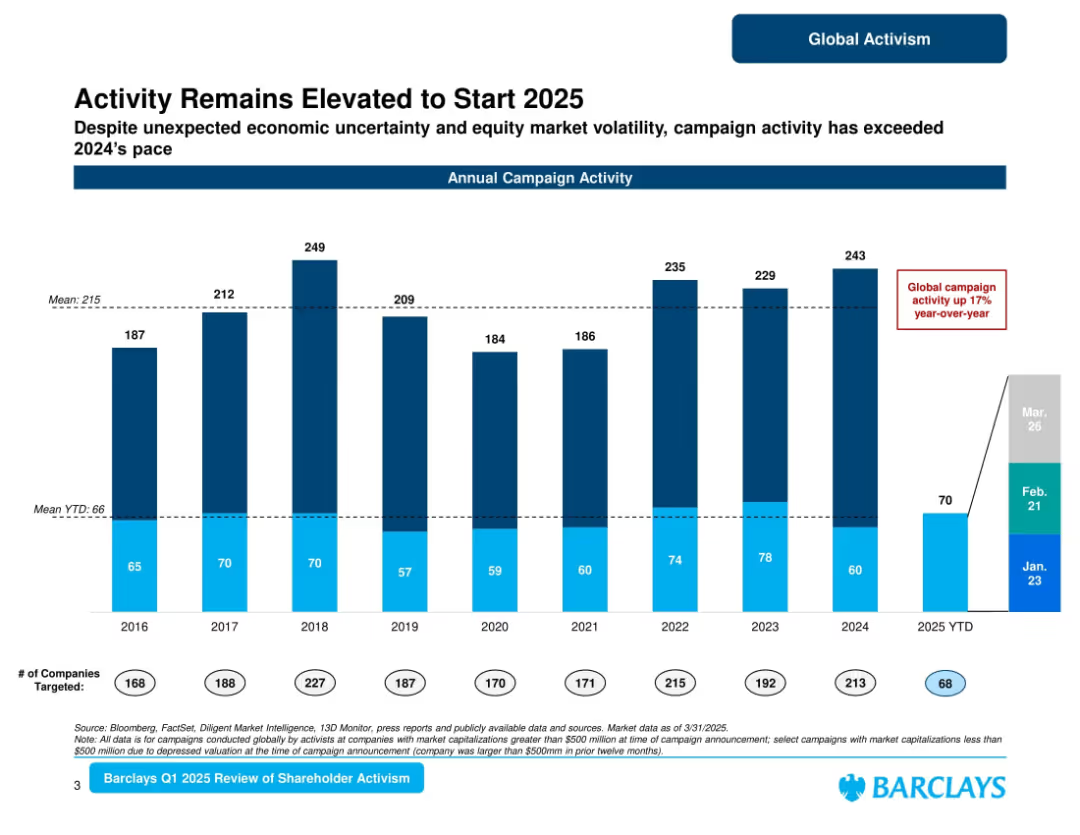
Large central bar chart of annual campaign activity; includes mean markers and current YTD bar; supporting metrics below.
Market Analysis and Trends
Financial Services
Summarizes global shareholder activism campaigns from 2016 to Q1 2025. Notes a 17% YoY increase in campaign activity and a strong start to 2025. Includes number of companies targeted and average values. Highlights continued investor interest despite volatility.
shareholder activism, campaign trends, annual activity, 2025, Barclays, global campaigns, equity markets
Single Chart
Barclays
Saved
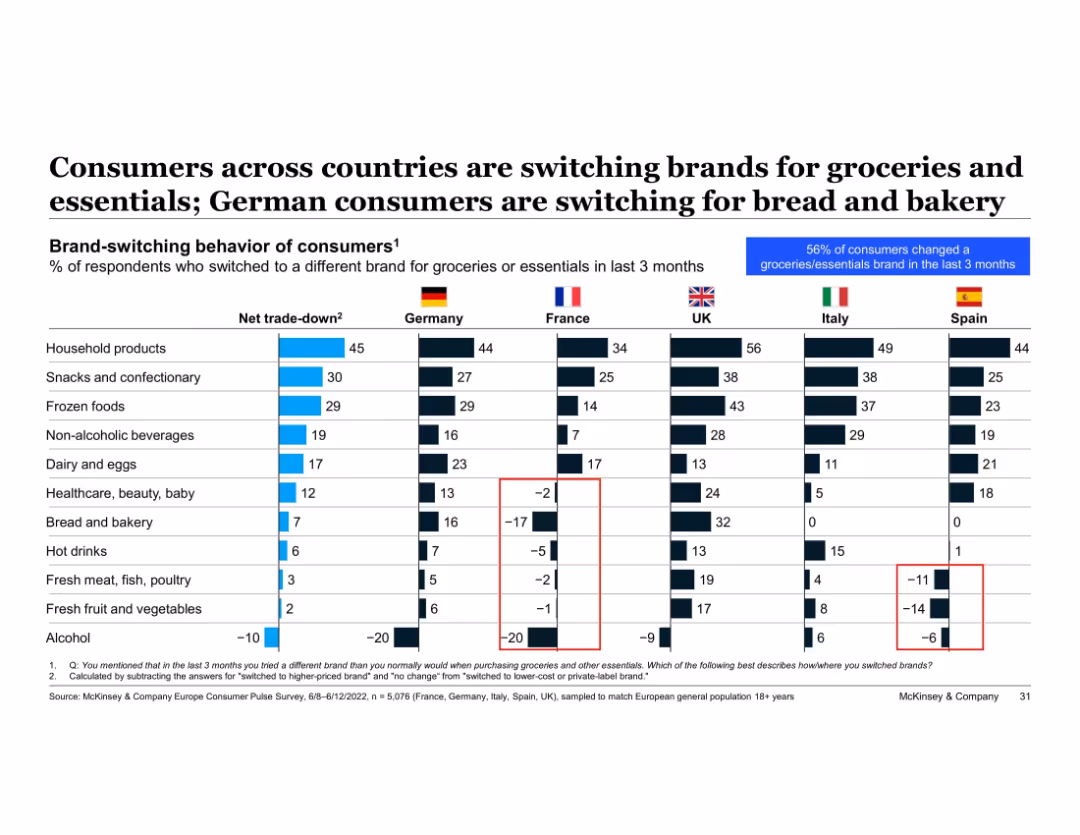
Table with net trade-down metrics by product type and country; color-coded and national flags used for comparison
Product and Service Analysis
Retail & E-commerce
Cross-country analysis of brand-switching shows Germany’s net trade-down behaviors are prominent in bread and bakery. Italy and Spain show negative trends in fresh produce and meat. This slide highlights national differences in consumer downgrading behavior across various grocery categories.
brand switching, trade-down, bakery, fresh food, groceries, Germany, Italy, Spain, cross-country comparison
Single Chart
McKinsey
Saved
This slide is a visual composite of column charts and textual analysis. It contrasts loans and net interest income by segment, utilizing different shades to represent diverse financial products and services.
Financial Performance
Financial Services
Designed for financial analysts, the slide compares loans and net interest income across various segments, providing insights into lending performance and interest revenue streams, crucial for evaluating a company's profitability and risk management.
loans, net interest income, financial segments, lending performance, interest revenue
Multiple Chart
Goldman Sachs
Saved
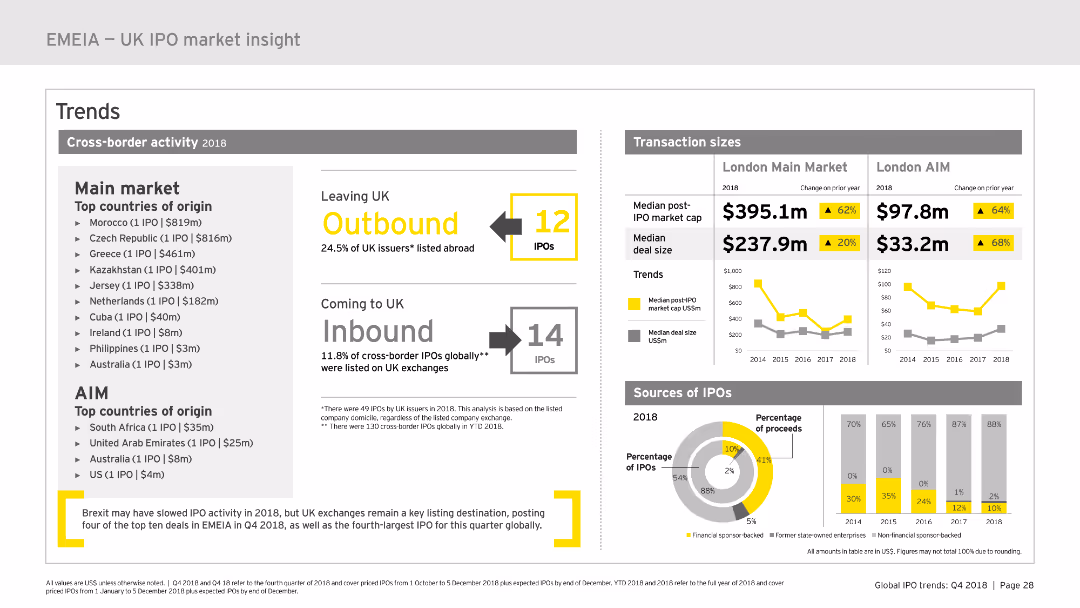
The slide features various charts including a column chart and a pie chart, highlighting cross-border IPO activity, transaction sizes, and sources of IPOs in 2018.
Market Analysis and Trends
Financial Services
Provides insights into cross-border IPO activity in the UK for 2018, highlighting outbound and inbound IPOs, transaction sizes, and IPO sources.
IPO, market cap, outbound, inbound, transaction size, median, deal size, percentage, financial services, 2018
Multiple Chart
EY
Saved
The slide features two column charts showing the percentages of participants who experienced gains or losses from crypto assets and crypto investment funds.
Financial Performance
Financial Services
This slide provides insights into the financial outcomes (gains or losses) for participants holding crypto assets and investment funds.
Gains, losses, crypto assets, investment funds, financial outcomes
Multiple Chart
IPSOS
Saved
Displays a column chart showing cement and clinker import sources for Australia, the US, and France, along with a table of top import countries.
Market Analysis and Trends
Industrial & Manufacturing
Analyzes the sources of cement and clinker imports for Australia, the US, and France. Provides insights into regional dependencies and major import partners.
Cement imports, clinker, US, France, Australia
Mixed Chart
LEK
Saved
Utilizes a combination of pie chart and line graph to display the spending on small businesses by Millennials and Gen Z. The design is streamlined, with a focus on clarity and ease of understanding the trends.
Market Analysis and Trends
Retail & E-commerce
Analyzes the significant contributions of Gen Z and Millennials to small business spending, emphasizing the importance of these demographics to local economies. Useful for economic analysis and strategic business planning.
Small Business, Spending Trends, Millennials, Gen Z
Multiple Chart
Accenture
Saved
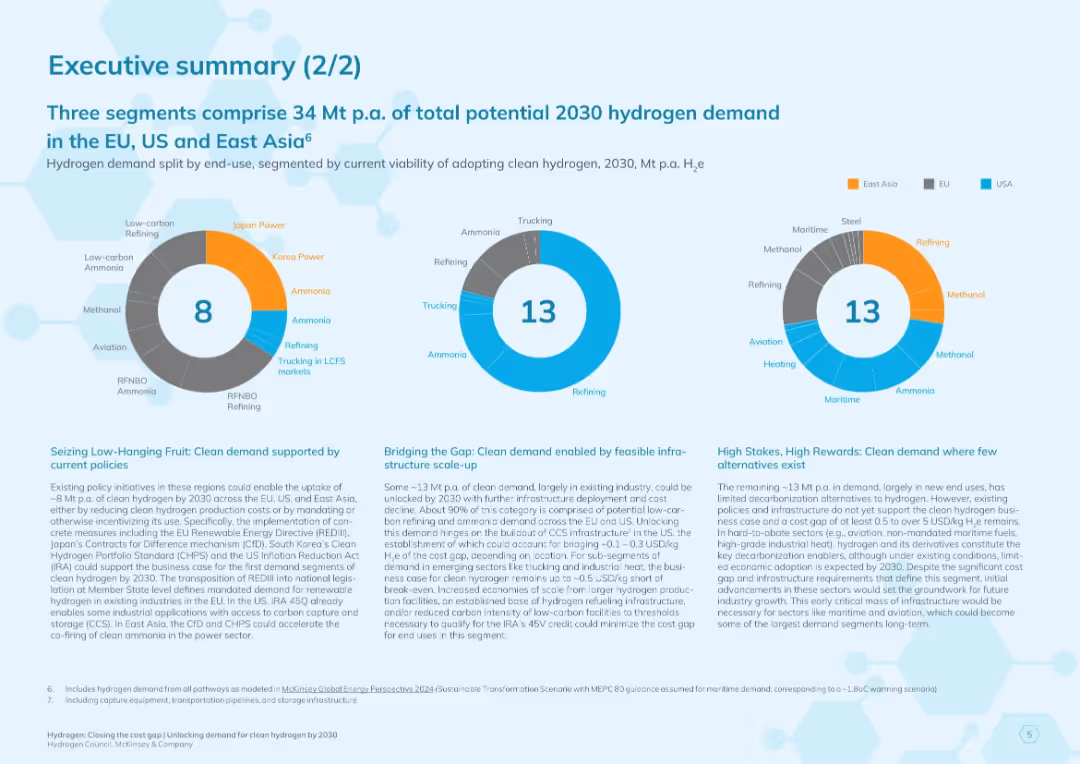
Blue-themed slide with three donut charts labeled with segment values (8, 13, 13). Bottom contains three text blocks summarizing segment potential and clean hydrogen adoption.
Market Analysis and Trends
Energy & Utilities
Summarizes three segments contributing to 2030 hydrogen demand across EU, US, and East Asia. Uses charts to split by feasibility and policy support. Describes strategic implications for hydrogen deployment.
hydrogen demand, clean energy, 2030 projections, East Asia, EU, USA, policy support, energy infrastructure, ammonia, refining
Multiple Chart
McKinsey
Saved
Contains multiple column charts, each representing different sectors of Vietnam's digital economy. It's moderately detailed with a mixture of light and dark blue bars, along with percentage labels for future projections.
Market Analysis and Trends
Technology & Software
Depicts Vietnam's digital economy and its expected growth by 2025 across various sectors like e-commerce, online travel, and transport & food. There are also expectations for economic growth influencing these projections.
Vietnam, Digital Economy, Growth, E-commerce, Online Travel, Transport, Food, Projections, 2025, Economic Expectations
Multiple Chart
Bain
Saved
A slide with two segments; the left side shows a circular diagram with sectors centered around client centricity, and the right side includes a descriptive statement on a black background.
Client Case Studies
Financial Services
This slide visually describes the integrated approach of the organization in serving global clients, emphasizing client centrality.
Integration, Client, Centricity, Global, Financial, Services, Organization, Approach
Diagram
Goldman Sachs
Saved
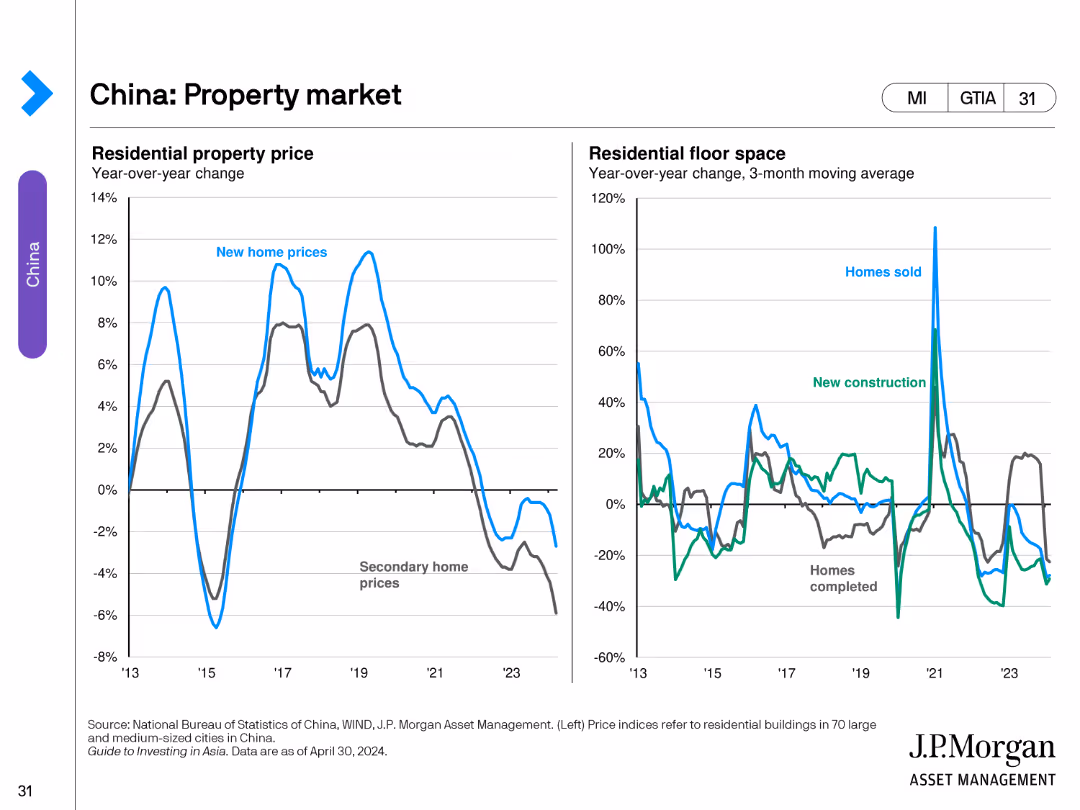
The slide includes two line charts. The left chart shows year-over-year changes in residential property prices. The right chart illustrates year-over-year changes in residential floor space for homes sold and new constructions.
Market Analysis and Trends
Real Estate & Construction
This slide evaluates the property market in China, analyzing trends in residential property prices and residential floor space changes.
Property, Market, China, Prices, Construction
Multiple Chart
JP Morgan
Saved
The slide includes two bar charts: the left chart shows investment values in infrastructure and real estate, while the right chart displays the number of deals in each sector.
Investment Analysis
Real Estate & Construction
This slide examines PE/VC investments in infrastructure and real estate sectors, detailing investment values and the number of deals over a specific period.
PE/VC investments, infrastructure, real estate, investment values, deal count
Multiple Chart
EY
Saved
The slide includes a split purple and violet background with two illustrative images and text. On the left are icons representing 'Essential tasks' and 'Enriching activities'.
Technology and Digital Transformation
Technology & Software
It showcases key messages about the nbn network's role in providing essential services and enriching lives, emphasizing its value and necessity.
nbn network, essential services, enriching activities, connectivity, online tasks, value proposition, brand messaging
Agenda
Accenture
Saved
Line graph showing the impact on EBITDA over time, comparing high performing transformations to median results.
Financial Performance
Financial Services
Evaluates the financial impact of high performing transformations on EBITDA over time.
EBITDA, financial, transformation, impact, performance
Single Chart
McKinsey
Saved
The slide includes a column chart that shows the types of risk management roles and functions anticipated to benefit from right-shoring or outsourcing strategies over the next five years.
Operational Efficiency
Financial Services
It discusses which risk management roles and functions, such as quantitative analytics and data management, are expected to be optimized through right-shoring or outsourcing. This slide helps in identifying key areas for operational efficiency improvements.
risk management, roles, functions, right-shoring, outsourcing, efficiency
Mixed Chart
EY
Saved
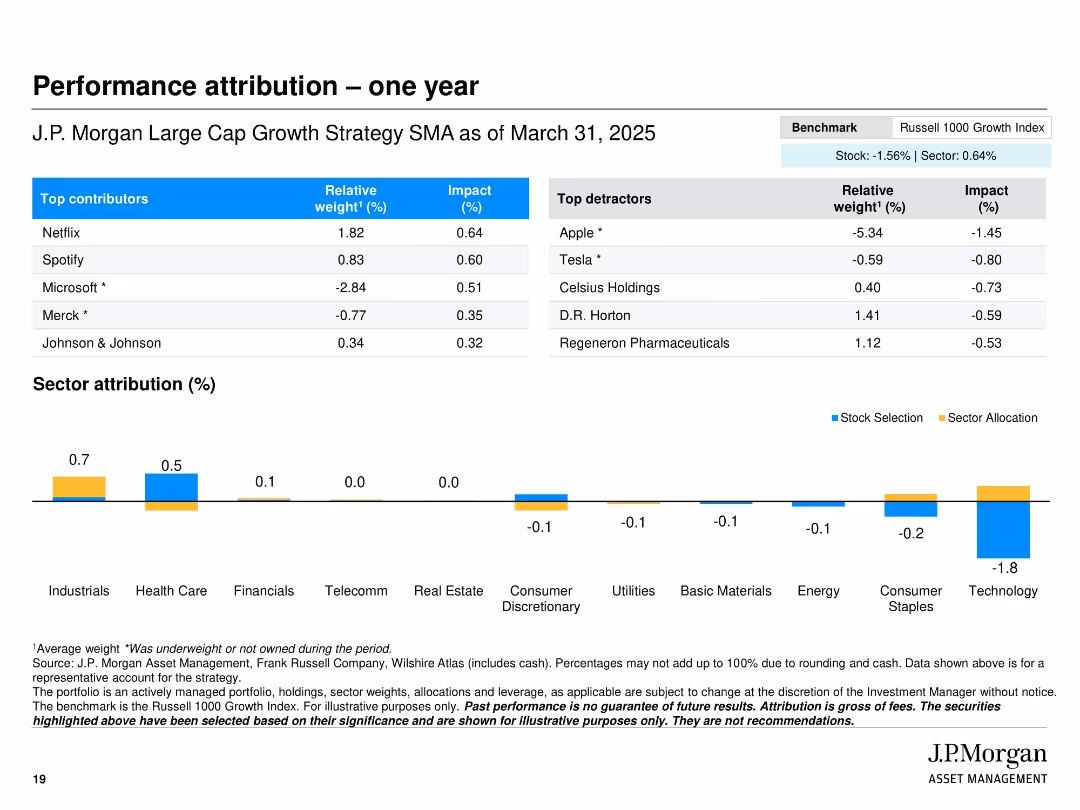
Two-column table layout with top contributors and detractors, a sector attribution bar chart, and clean color-coded impact visuals
Financial Performance
Financial Services
This slide presents a one-year performance attribution for the J.P. Morgan Large Cap Growth Strategy SMA, showing the top contributing and detracting stocks with respective weights and impacts. It also includes a sector-level attribution chart, highlighting stock selection and sector allocation contributions.
performance, attribution, sector, impact, contributors, detractors, stocks, strategy, J.P. Morgan, Russell 1000
Mixed Chart
JP Morgan
Saved
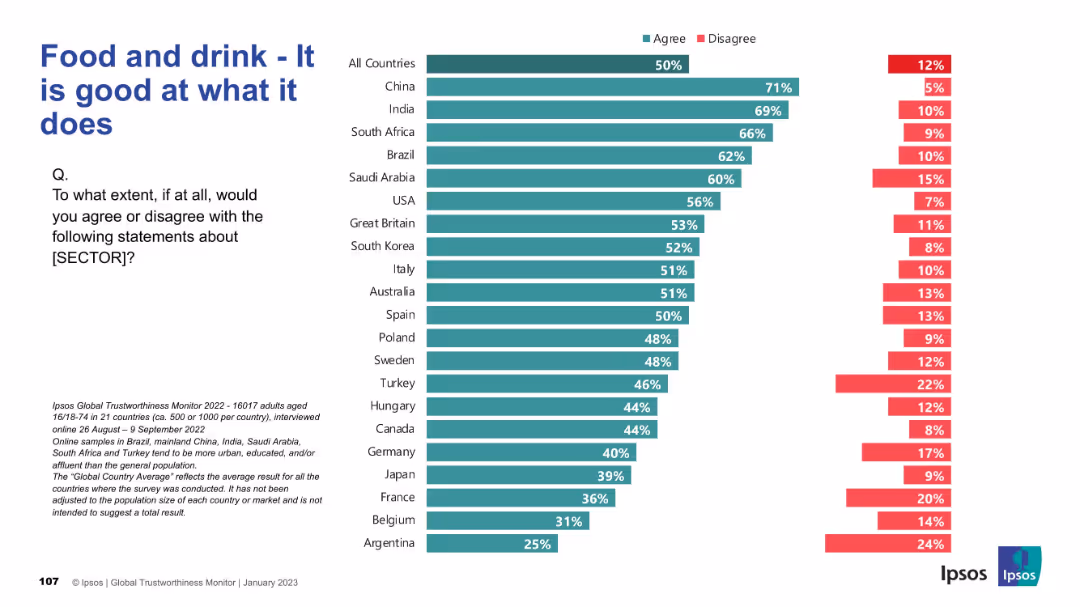
Similar bar chart design but covering the food and drink sector. Rankings by country on competence perception.
Product and Service Analysis
Consumer Goods
Surveys consumer confidence in the competence of the food and drink sector. China, India, and Brazil show high agreement that this sector performs well. Trust in product quality is central to the insights provided.
food industry, competence, trust, consumer perception, Ipsos, services
Mixed Chart
IPSOS
Saved
The slide features five business cases from Europe, the US, and China, demonstrating the diverse applications of biomass, including waste-to-energy in the UK, bio jet fuel in the US, biomethane in China, renewable diesel in the US, and co-firing in the cement industry.
Client Case Studies
Energy & Utilities
This slide showcases five business cases highlighting the diverse potential applications of biomass energy across different regions and industries, emphasizing the innovative solutions and benefits of biomass utilization.
biomass applications, business cases, waste-to-energy, bio jet fuel, biomethane, renewable diesel, co-firing, cement industry
Linear Flow
Kearney
Saved
The slide includes text discussing the inevitability of crises, a circular graph showing the percentage of respondents who have experienced crises in the past five years, and key statistics about crisis frequency.
Risk Assessment and Management
Professional Services
This slide emphasizes the prevalence and inevitability of corporate crises, supported by survey data indicating that nearly 70% of leaders have faced multiple crises recently.
Corporate crisis, inevitability, survey data, crisis frequency, risk management
Mixed Chart
PwC/Strategy&
Saved
Similar dark background and white text with circular charts displaying percentages and yellow highlights.
Market Analysis and Trends
Healthcare & Pharmaceuticals
This slide demonstrates consumer openness to personalized medicine and technology-enhanced care, with 66% willing to take genetic tests, 66% open to non-urgent care at mini clinics, 64% willing to take medications made for their genetic profile, and 61% using wearables and mobile apps for health monitoring.
technology-enhanced care, personalized medicine, genetic testing, wearables, U.S. consumers
Mixed Chart
EY
Saved
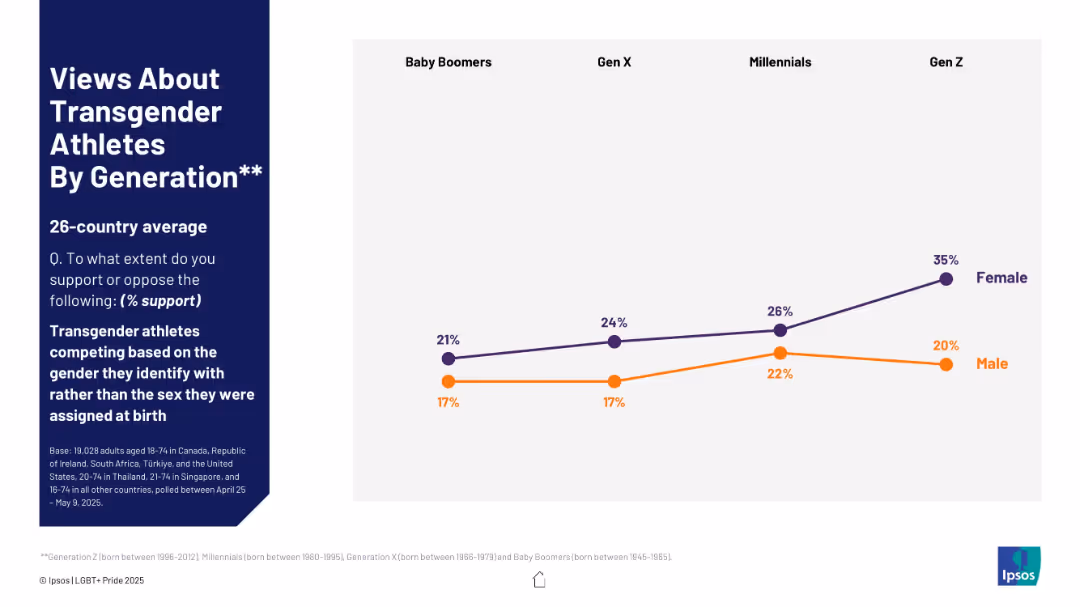
Line chart showing generational support trends, separated by gender, with a focus on Gen Z to Baby Boomers.
Regulatory and Compliance
Government & Public Sector
This slide shows generational differences in support for transgender athletes competing by gender identity. The data is segmented by gender and highlights increasing support among younger generations, especially among Gen Z females.
generational support, transgender athletes, Gen Z, gender identity, sports, gender split, LGBTQ+ survey, opinion by age
Mixed Chart
IPSOS
Saved
Column charts show historical free cash flow alongside annotations on financial strategies.
Financial Performance
Transportation & Logistics
Evaluates the company's financial resilience, focusing on adjusted free cash flow and liquidity over recent years.
free cash flow, financial resilience, cost management, liquidity, capital efficiency
Mixed Chart
Deutsche Bank
Saved
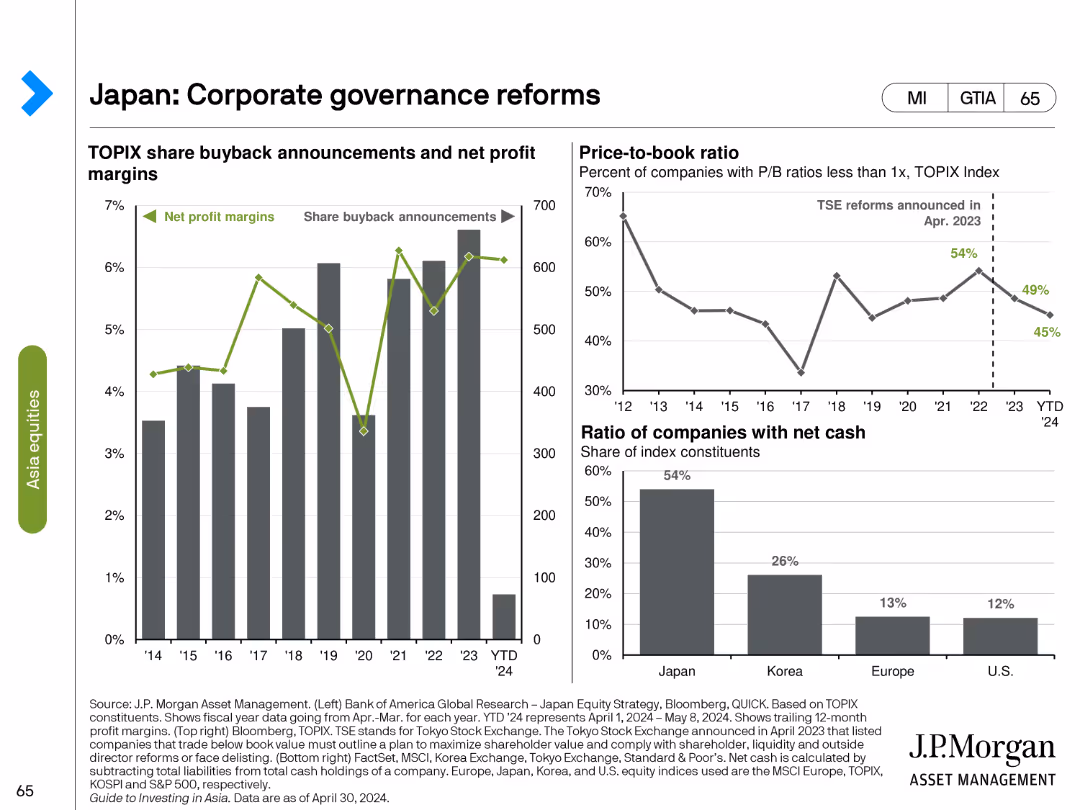
This slide includes three charts: a line chart showing TOPIX share buyback announcements and net profit margins, a line chart on the price-to-book ratio, and a bar chart showing the ratio of companies with net cash.
Regulatory and Compliance
Financial Services
The slide reviews the impact of corporate governance reforms in Japan, highlighting trends in share buybacks, net profit margins, price-to-book ratios, and the financial health of companies with net cash positions.
Japan, corporate governance, share buybacks, net profit margins, price-to-book ratio, financial health, net cash, regulatory reforms, compliance, financial analysis
Multiple Chart
JP Morgan
Saved
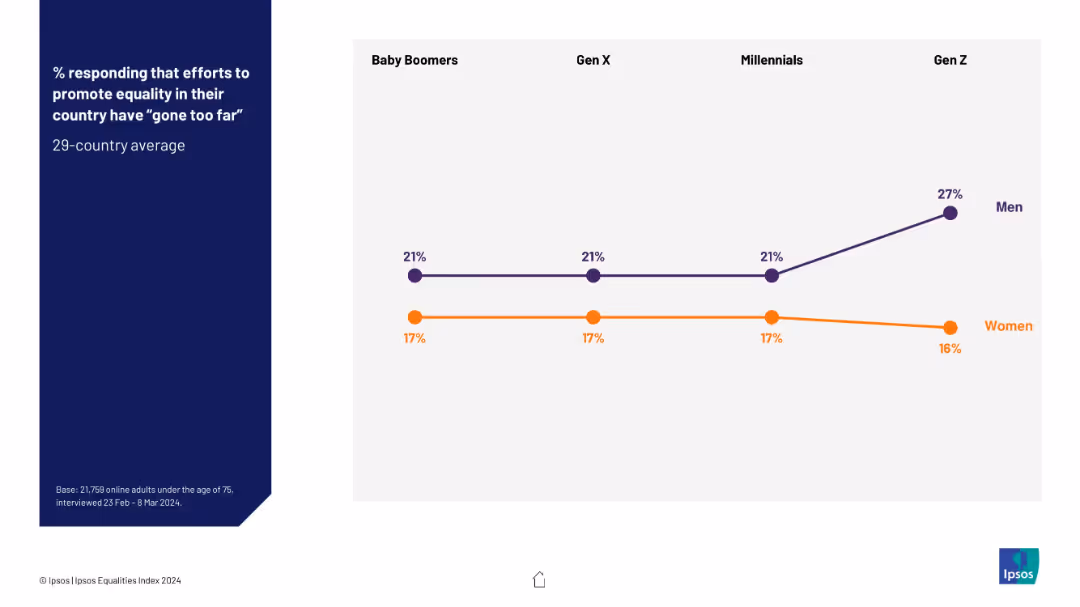
Line chart split by gender and generation; men and women plotted separately with distinct colors; Gen Z shows a rise among men.
Regulatory and Compliance
Government & Public Sector
The chart reveals generational and gender divides in the view that equality efforts have overreached. Notably, Gen Z men report significantly higher agreement that actions “have gone too far” compared to women.
gender gap, overreach, equality backlash, Gen Z, Ipsos data, public sentiment, demographic trends
Mixed Chart
IPSOS
Saved
Slide divided into two halves; left side has text boxes with bullet points, right side has a timeline from 2015 to 2018 with key initiatives marked along it, indicating progress.
Strategic Planning
Financial Services
Details supplier onboarding time reduction efforts, highlighting digital transformation milestones and future focus areas. Useful for presenting historical achievements and forward-looking strategies in process optimization.
Digital Transformation, Onboarding, Efficiency, Timeline, Process Improvement, Strategy, Milestones, Future Focus, Legal, RPA
Text Only
Citigroup
Saved
Previous
Next
If nothing, comes up, please save your slides first
Create a FREE account to continue browsing
Receive Instant Access to 1,000+ slides from companies like McKinsey, Google, and Goldman Sachs
First Name
Last Name
Email
Password
I agree to all
Terms & Privacy Policy
Thank you! Your submission has been received!
Oops! Something went wrong while submitting the form.
Have an account?
Sign in
Column Chart
Heatmap
Chevron
Org Chart
Infographic
Callouts
Timeline
List
Graphic
Picture
Process Flow
Diagram
Paragraph
Map
Table
Framework
Subtitle
Takeaway Box
Icon
Other Chart
Radar Chart
Waterfall Chart
Mekko Chart
Pie Chart
Scatter Plot
Line Chart
Bar chart
Bullet points