My Account
My Slides
Search by Category
Templates
Leave Feedback
Login
Logout
Get Started
Browse all Slides
Browse all Slides
Create a FREE Account
Instant access to 1,000+ real slides from top companies like McKinsey, BCG, Goldman Sachs, Google and many more!
First Name
Last Name
Email
Password
I agree to all
Terms & Privacy Policy
Thank you! Your submission has been received!
Oops! Something went wrong while submitting the form.
Have an account?
Sign in
Saved Slides
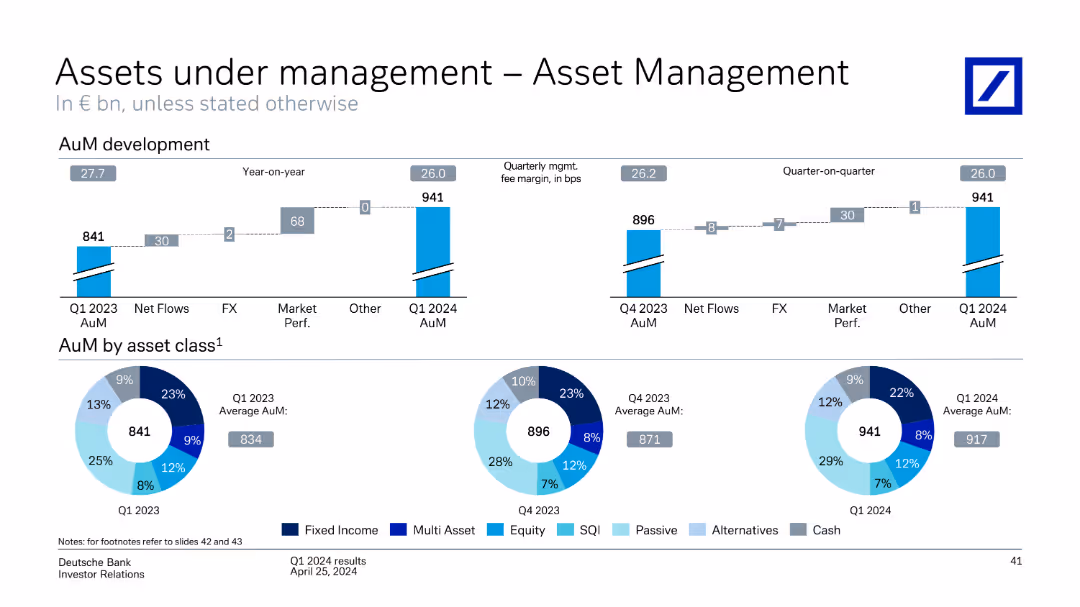
The slide contains column charts and pie charts showing assets under management development, including net flows, market performance, and asset class distribution.
Financial Performance
Financial Services
Discusses the development of assets under management in asset management, highlighting quarterly changes, asset class distribution, and market performance.
assets under management, asset management, net flows, market performance, asset class, financial performance
Multiple Chart
Deutsche Bank
Saved
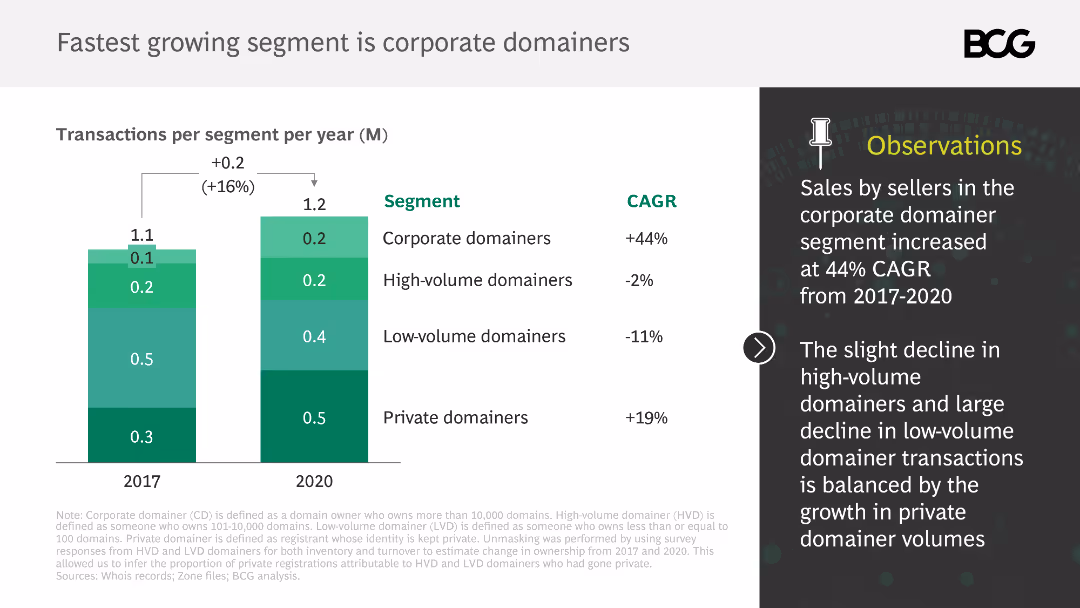
This slide presents a column chart comparing transactions per segment (corporate, high-volume, low-volume, private domainers) from 2017 to 2020. Observations are listed.
Market Analysis and Trends
Retail & E-commerce
It identifies the corporate domainer segment as the fastest-growing, with significant increases in transactions, while highlighting changes in other segments.
corporate domainers, transactions, growth, segments, market analysis
Mixed Chart
BCG
Saved
Bar charts, comparative analysis, color-coded data.
Market Analysis and Trends
Professional Services
Displays CEOs' concerns by region regarding various economic, policy, and social threats.
CEO, cyber threats, policy, health crises, economic growth, uncertainty, regulation
Single Chart
PwC/Strategy&
Saved
The slide includes a title, a column chart with net revenues, a table detailing financial results, and bullet points summarizing the highlights. The slide is well-organized with moderate visual complexity.
Financial Performance
Financial Services
Aimed at displaying detailed financial results for the global banking and markets sector of a company. It includes revenue from various services like investment banking and equities. The data is probably used to analyze market positions and inform strategy meetings or investor updates.
Investment Banking, Equities, Net Revenues, Financial Results
Mixed Chart
Goldman Sachs
Saved
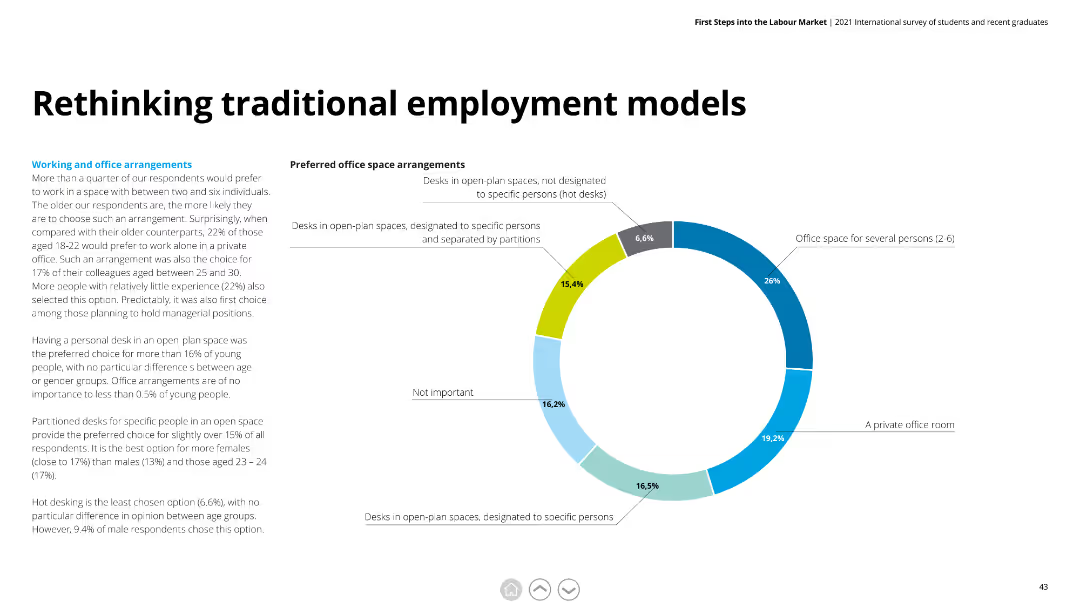
Features a pie chart with multiple segments in various shades of blue and green. Text is organized into two columns, providing detailed explanations of survey findings and their implications.
Human Resources and Talent Management
Professional Services
Explores preferred office space arrangements among respondents. Highlights preferences for open-plan spaces, private offices, and designated desks.
employment models, office space, preferences, open-plan, private offices, designated desks
Mixed Chart
Deloitte
Saved
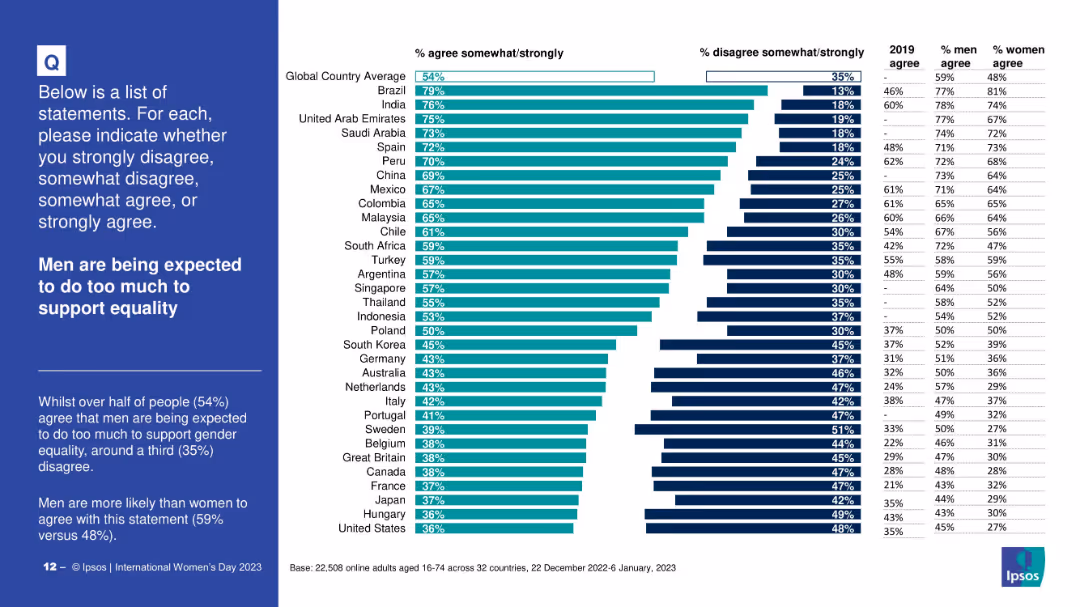
Horizontal bar chart with country-wise responses; sidebar includes summary insights and gender comparison; layout is clean and data-heavy
Market Analysis and Trends
Professional Services
The slide shows the percentage of people in various countries who agree or disagree that men are being expected to do too much to support gender equality. It highlights global and national sentiments and includes a gender-based breakdown.
gender equality, perceptions, expectations, men, global opinions, country comparison, Ipsos, International Women’s Day, 2023, attitudes
Mixed Chart
IPSOS
Saved
The slide presents a composite of bar charts and a list, comparing data between the years 2023 and 2024 in terms of business leaders' expectations for revenue, profits, and headcount. It also shows business planning priorities in a vertical list layout. The graphical elements are well organized, using color differentiation for each year.
Strategic Planning
Financial Services
This analytical slide illustrates the optimistic projections for 2024 by business leaders, with a focus on revenue, profits, headcount, and strategic planning. It provides valuable insights for companies preparing for the year ahead and serves as a tool for strategic business planning, indicating areas of expected growth and potential changes in operational focus.
Business Outlook, Revenue Growth, Profit Expectations, Strategic Planning, Operational Focus
Multiple Chart
JP Morgan
Saved
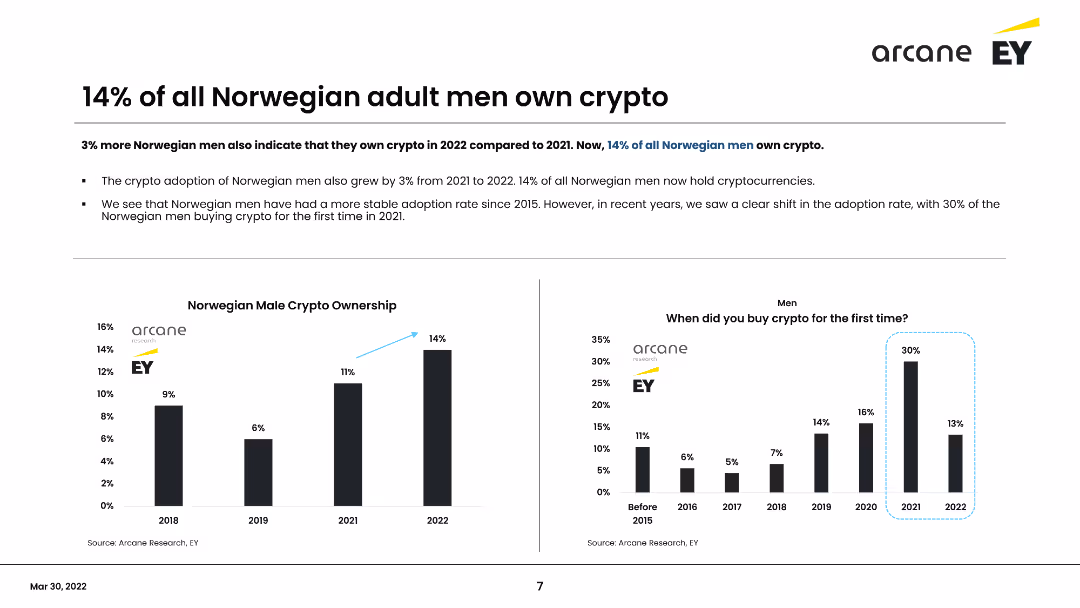
This slide presents data on Norwegian men owning cryptocurrency, including a column chart showing the percentage from 2018 to 2022 and a survey on when men first bought crypto. It highlights a 3% increase in ownership in 2022, reaching 14% overall.
Market Analysis and Trends
Financial Services
Shows that 14% of Norwegian men own cryptocurrency, with a steady increase over the years. Highlights the growth from 2021 to 2022 and the survey findings on the timeline of initial crypto purchases among men.
Cryptocurrency, Male adoption, Norway, Survey, Trends
Multiple Chart
EY
Saved
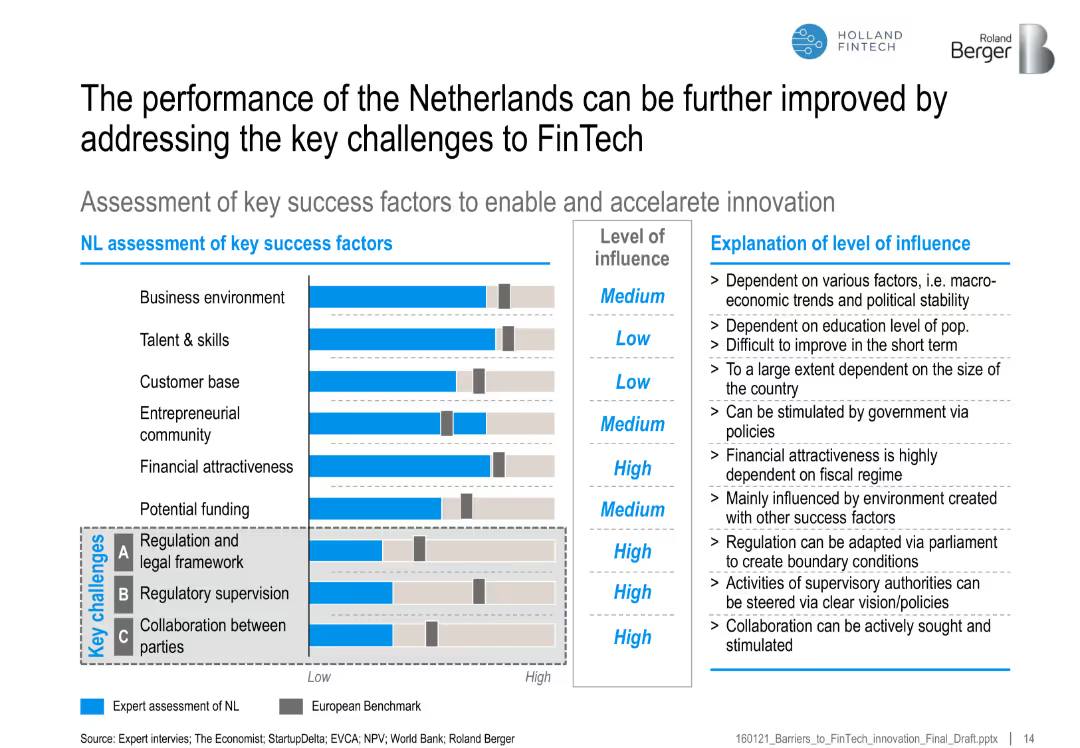
Horizontal bar chart of key success factors vs. European benchmark with commentary on level of influence
Strategic Planning
Financial Services
The slide assesses the Netherlands' strengths and gaps in FinTech success factors compared to European averages, highlighting regulatory and collaboration challenges with improvement suggestions.
Netherlands, FinTech, success factors, regulation, funding, talent, collaboration, benchmarking
Mixed Chart
Roland Berger
Saved
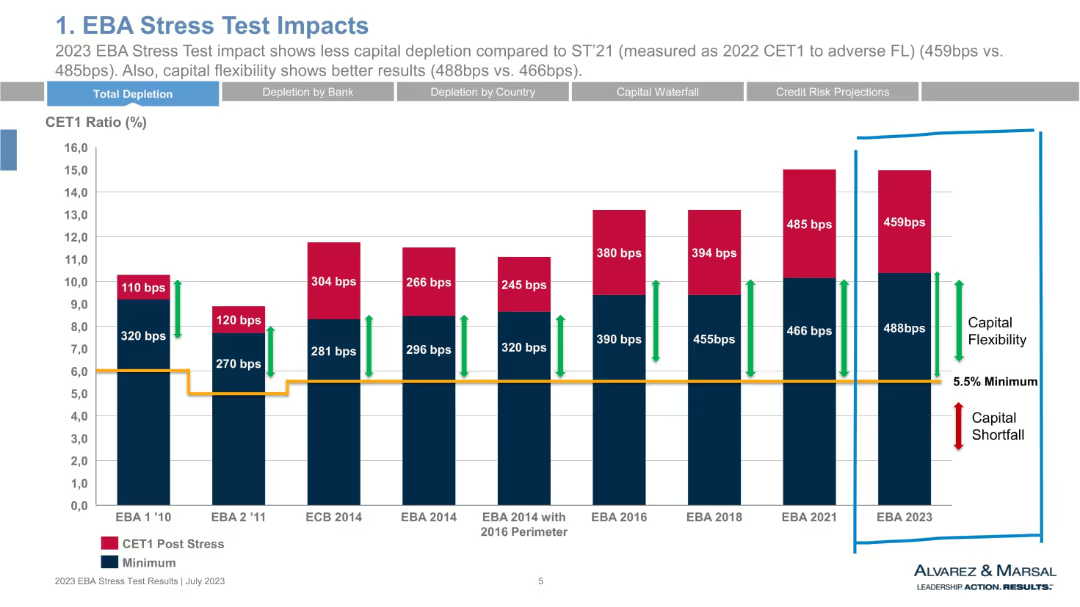
Bar chart showing CET1 ratio changes across different years. Uses color blocks (red and blue) and vertical markers. Axis labels in %, and years labeled at the bottom.
Risk Assessment and Management
Financial Services
A historical bar chart tracks CET1 ratio shifts during past EBA stress tests, comparing capital depletion (bps) and capital flexibility. 2023 results show slightly less depletion than 2021, with better capital buffers. Emphasizes the importance of resilience under severe scenarios.
CET1, stress test, capital flexibility, depletion, EBA history, 2023, EU banks
Single Chart
Alvarez & Marsal
Saved
Incorporates line graphs to depict trading profit and loss along with value-at-risk (VaR) metrics, clearly showing trends and fluctuations over the fiscal year, with key points noted for significant changes or anomalies.
Risk Assessment and Management
Financial Services
Provides a quantitative measure of potential financial risk over a given period, showcasing the bank's risk management effectiveness in handling market volatilities.
risk management, VaR, trading, finance, metrics
Single Chart
Deutsche Bank
Saved
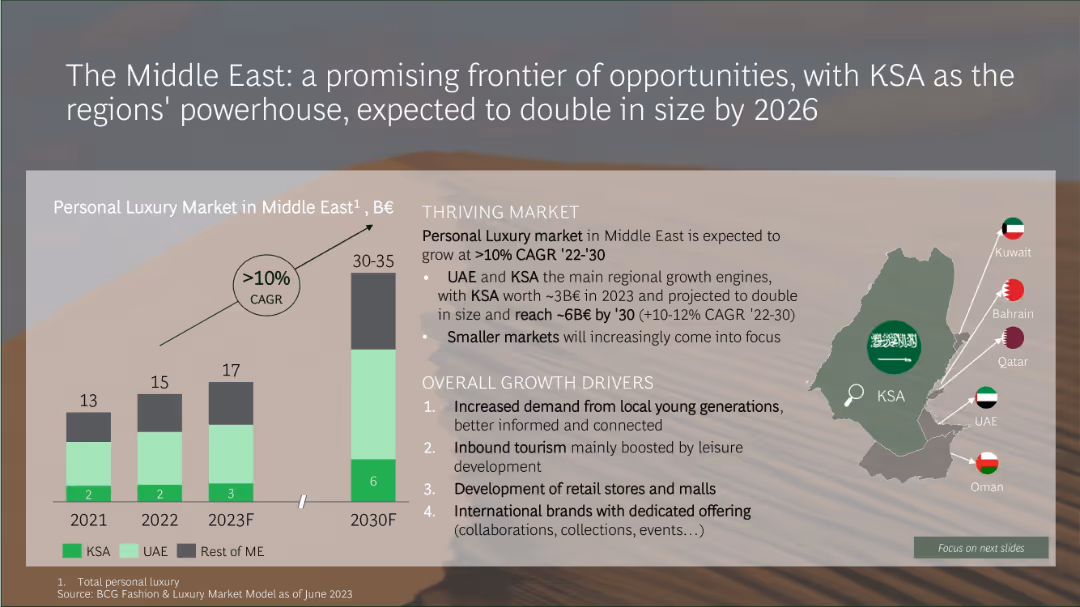
Infographic with a bar chart projecting Middle East luxury market growth and a map showing key Gulf countries
Market Analysis and Trends
Consumer Goods
The Middle Eastern luxury market is expected to double by 2030, growing at over 10% CAGR. KSA and UAE are the primary growth engines, driven by increased demand from younger consumers, tourism, retail development, and international brand expansion.
Middle East, KSA, luxury market, CAGR, retail growth, tourism, youth demand, market size
Mixed Chart
BCG
Saved
This slide includes two large pie charts displaying the distribution of markets between developed and emerging regions and the breakdown of sales channels.
Market Analysis and Trends
Consumer Goods
Discusses the geographical distribution and sales channels of the company's global business, highlighting its strong position in emerging markets.
global, emerging markets, sales channels, developed markets, market distribution
Multiple Chart
Deutsche Bank
Saved
A central black board with sections radiating outwards details client priorities and sustainable finance offerings, alongside a narrative of client solutions on the right.
Client Case Studies
Financial Services
Highlights a case study on sustainable finance, showing client priorities and the firm’s sustainable offerings in various business sectors.
Sustainable, Finance, Investment, Asset, Wealth, Management, Solutions, Client
Table
Goldman Sachs
Saved
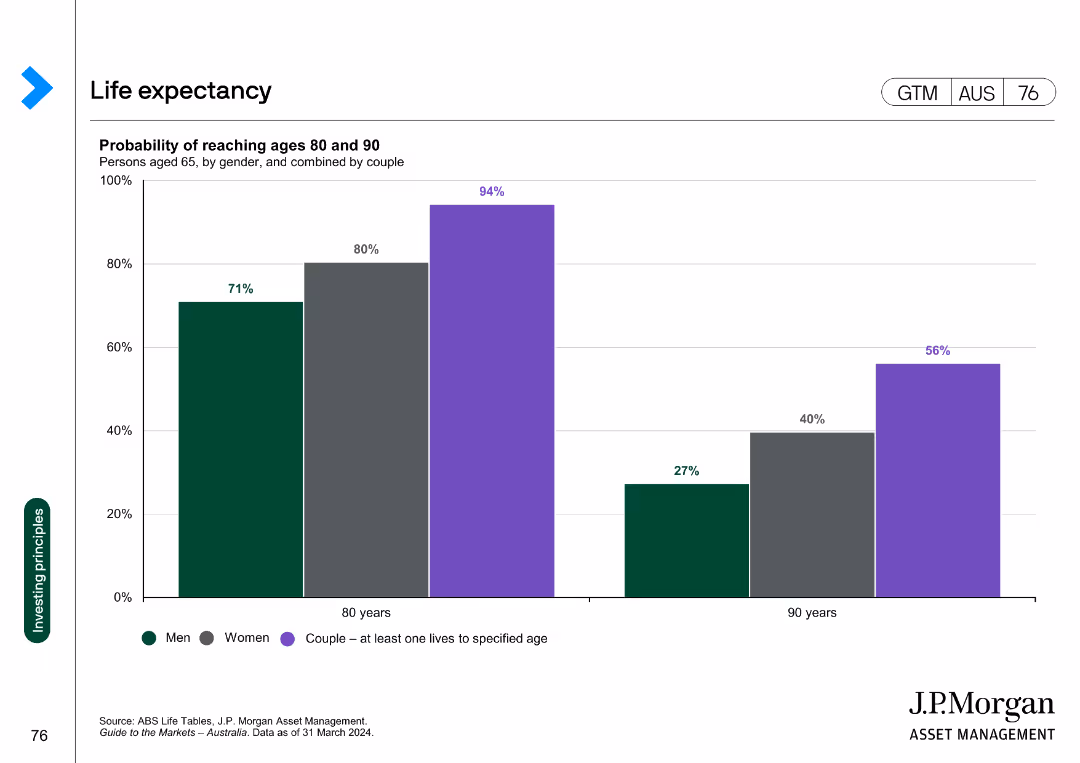
A column chart displaying the probability of men, women, and couples reaching ages 80 and 90. The bars represent the percentages for each group, with different colors for each category.
Market Analysis and Trends
Financial Services
The slide shows the probability of men, women, and couples reaching the ages of 80 and 90. It is used to illustrate longevity statistics relevant to financial planning.
Life expectancy, longevity, financial planning, retirement, demographics
Single Chart
JP Morgan
Saved
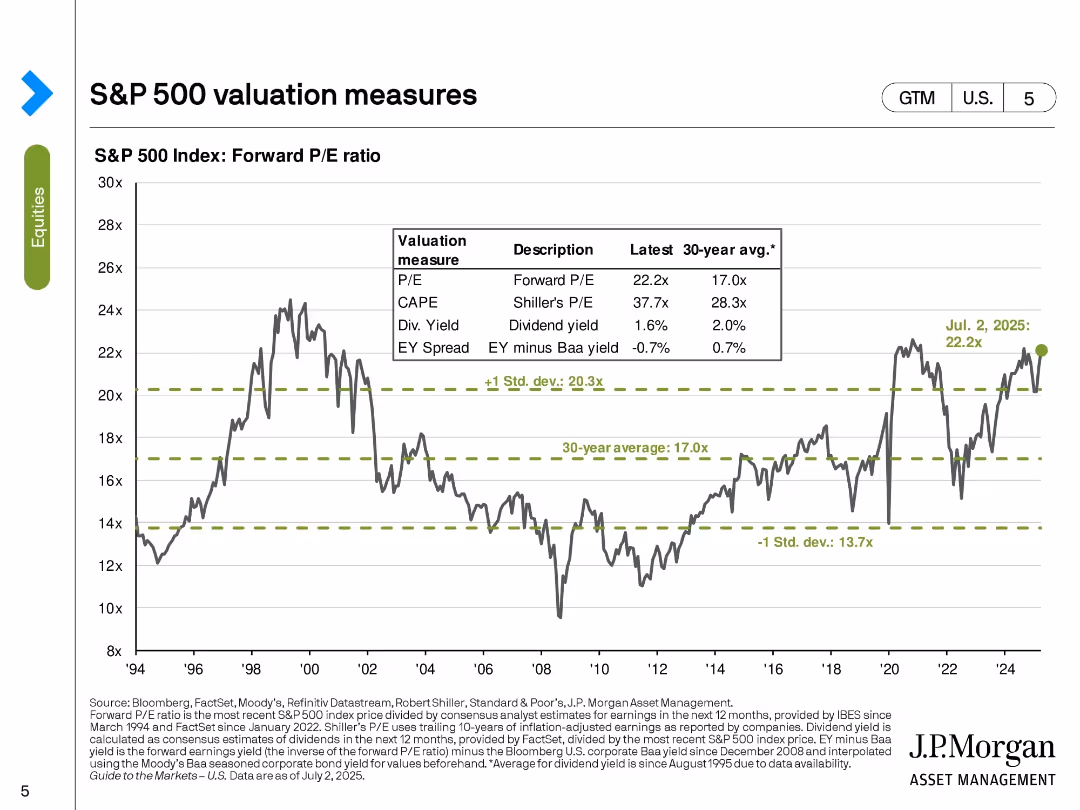
Line chart with horizontal benchmark lines and a data table overlay, tracking forward P/E ratio over time. Bold green text highlights recent data point.
Market Analysis and Trends
Financial Services
The slide presents the forward P/E ratio of the S&P 500, comparing the latest value (22.2x) with long-term averages and standard deviation bands. It includes a historical line chart from 1994 to 2025 and a summary table of related valuation metrics like CAPE, dividend yield, and EY spread.
P/E ratio, CAPE, EY spread, valuation, dividends, historical trend, market valuation, standard deviation, S&P 500, equity markets
Single Chart
JP Morgan
Saved
This slide presents three separate graphs on crop, livestock, and dairy production, using a blue and gray color scheme. It gives an overview of the US agriculture industry's financial output in these sectors.
Investment Analysis
Agriculture & Food Production
A financial breakdown of the US agriculture industry, highlighting the production value of crops, livestock, and dairy, and their respective growth figures over time.
agriculture, US industry, financial data, crops, livestock, dairy, production value
Multiple Chart
EY
Saved
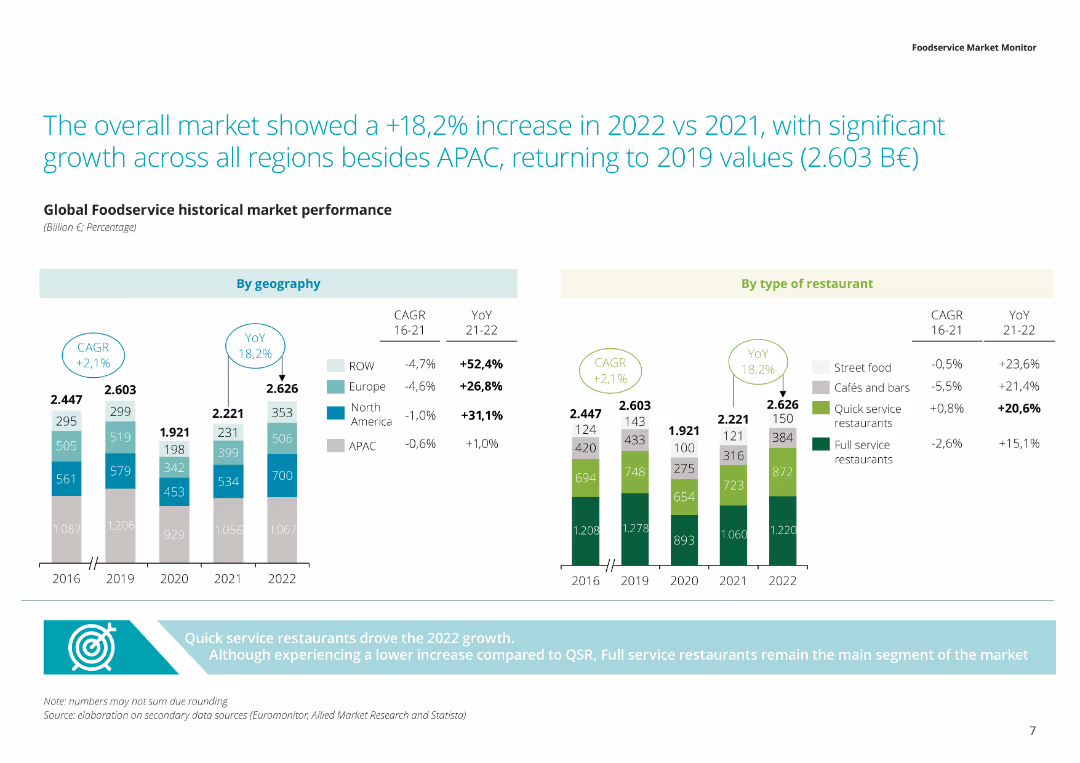
The slide includes a stacked column chart with green, gray, and blue segments representing different types of restaurants and their distribution across regions.
Market Analysis and Trends
Consumer Goods
Presents data on the global foodservice market, highlighting the distribution of various restaurant types across regions, and the overall market size in 2022.
Foodservice market, restaurant types, global distribution, market size, regional analysis
Multiple Chart
Deloitte
Saved
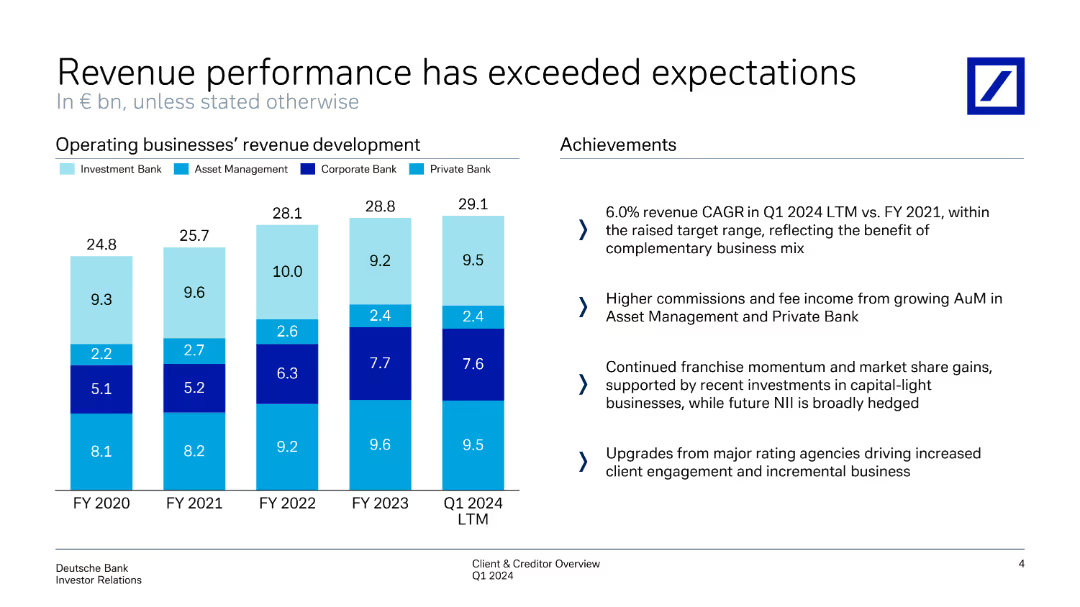
Includes a series of column charts displaying operating businesses' revenue development across fiscal years, with an achievements section on the right.
Financial Performance
Financial Services
Highlights revenue performance exceeding expectations across different business units, with achievements in growth and operational metrics.
revenue performance, expectations, operating businesses, revenue development, achievements
Mixed Chart
Deutsche Bank
Saved
Features a column chart showing survey results on companies' strategies to manage cost increases in 2023 and 2024, with opinions from various industry leaders about cost management challenges.
Financial Performance
Financial Services
Explores corporate strategies for offsetting cost increases due to inflation and other economic challenges, highlighting different industry perspectives on transferring costs to consumers.
cost management, inflation, economic challenges, consumer prices, efficiency plans, industry strategy, financial planning, cost offsetting, corporate strategy
Mixed Chart
Bain
Saved
Features a bar graph and breakout boxes highlighting the prioritization of agility by job titles and company size.
Market Analysis and Trends
Professional Services
Examines the priority levels that executives in different roles and company sizes place on achieving agility within their organizations.
Agility, Prioritization, Executives, Company Size, Bar Graph
Single Chart
Kearney
Saved
The slide includes a column chart comparing vacancy rates and a bar chart showing timely application processing. It has a mix of text and visual data elements, with a clear focus on workforce metrics.
Operational Efficiency
Professional Services
Slide includes bar charts and a text block. Displays vacancy comparisons and application processing timeliness over time.
Highlights workforce capacity issues within DEHS, comparing vacancy rates and analyzing the timeliness of application processing over a specified period.
Multiple Chart
Alvarez & Marsal
Saved
Features a multi-line chart showing percentages of talent retention strategies across industries. Icons represent different strategies at the top. Each line represents a sector with clear color coding.
Strategic Planning
Retail & E-commerce
Focuses on how retail industry's talent retention strategies align with other sectors, including CGS, Auto/IE, LS/Pharma/Biotech, and Travel/Hospitality, in foundational, programmatic, strategic, and integrated categories.
Retail, Talent Retention, Consistency, Industries, Strategies, Foundational, Programmatic, Strategic, Integrated
Mixed Chart
Accenture
Saved
The slide includes a pie chart on investor requirements for ESG solutions and an image of professionals outdoors with solar panels.
Market Analysis and Trends
Financial Services
Examines investor demand for ESG solutions, focusing on governance and climate risk, and details the percentage of investors required to invest in socially responsible products.
ESG, investor demand, governance, climate risk, socially responsible, investment, solar panels, professionals, analysis
Mixed Chart
EY
Saved
This slide features a pie chart showing reasons why consumers buy luxury goods, including superior quality and longevity, desire to treat oneself, and viewing the purchase as an investment.
Customer and Market Segmentation
Consumer Goods
The slide examines why Middle Eastern consumers buy luxury goods, highlighting motivations such as product quality, longevity, self-treating, and viewing luxury items as investments.
luxury, buying, consumer, Middle East, quality, longevity, investment
Multiple Chart
PwC/Strategy&
Saved
Previous
Next
If nothing, comes up, please save your slides first
Create a FREE account to continue browsing
Receive Instant Access to 1,000+ slides from companies like McKinsey, Google, and Goldman Sachs
First Name
Last Name
Email
Password
I agree to all
Terms & Privacy Policy
Thank you! Your submission has been received!
Oops! Something went wrong while submitting the form.
Have an account?
Sign in
Column Chart
Heatmap
Chevron
Org Chart
Infographic
Callouts
Timeline
List
Graphic
Picture
Process Flow
Diagram
Paragraph
Map
Table
Framework
Subtitle
Takeaway Box
Icon
Other Chart
Radar Chart
Waterfall Chart
Mekko Chart
Pie Chart
Scatter Plot
Line Chart
Bar chart
Bullet points