My Account
My Slides
Search by Category
Templates
Leave Feedback
Login
Logout
Get Started
Browse all Slides
Browse all Slides
Create a FREE Account
Instant access to 1,000+ real slides from top companies like McKinsey, BCG, Goldman Sachs, Google and many more!
First Name
Last Name
Email
Password
I agree to all
Terms & Privacy Policy
Thank you! Your submission has been received!
Oops! Something went wrong while submitting the form.
Have an account?
Sign in
Saved Slides
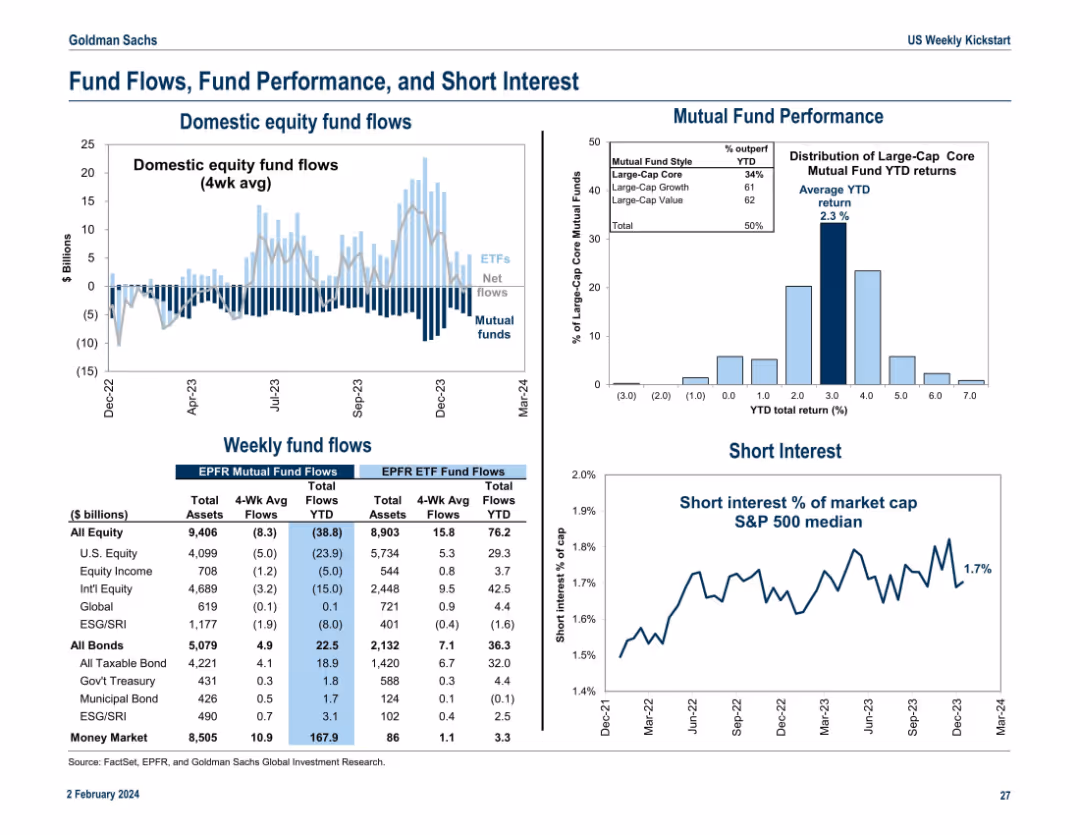
Divided into five segments: bar charts, fund performance histogram, line chart on short interest, and tables with flow data. Dense but organized presentation of capital movement trends.
Performance Metrics and KPIs
Financial Services
This slide summarizes current trends in equity and bond fund flows, mutual fund returns, and short interest levels. It tracks investor positioning and sentiment across asset classes with weekly and YTD data, along with S&P 500 short interest as a percentage of market cap.
fund flows, mutual funds, short interest, equity flows, ETF, performance
Multiple Chart
Goldman Sachs
Saved
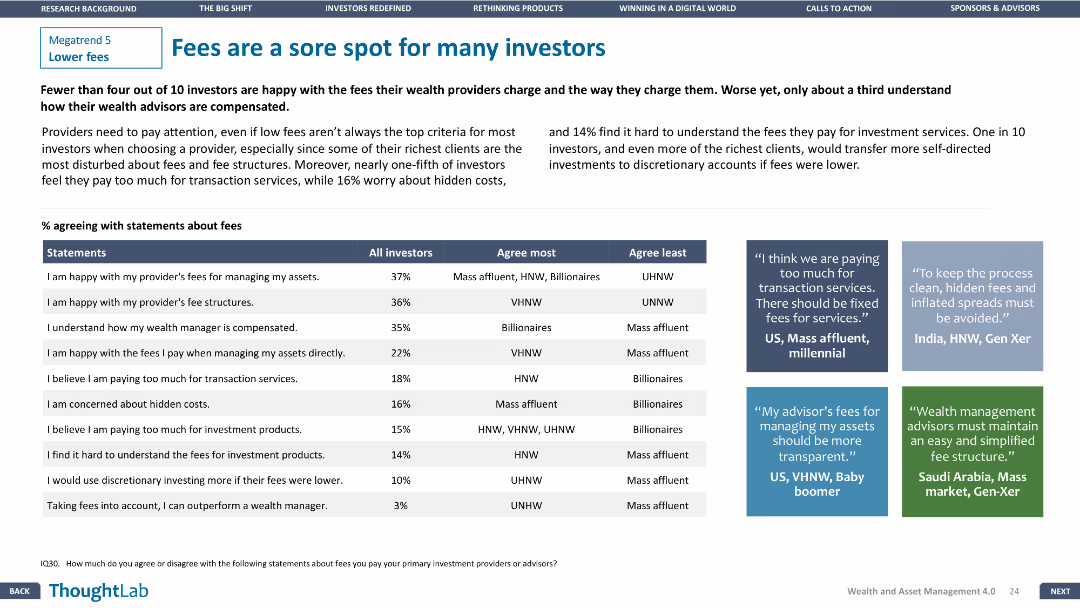
A table comparing investor agreement with fee statements. Three text boxes provide qualitative insights from different regions. Design is clear and focused.
Customer and Market Segmentation
Financial Services
Highlights investor dissatisfaction with fees and transparency issues, with specific agreement percentages and regional insights from investors.
fees, investors, satisfaction, transparency, regions
Header Vertical
Deloitte
Saved
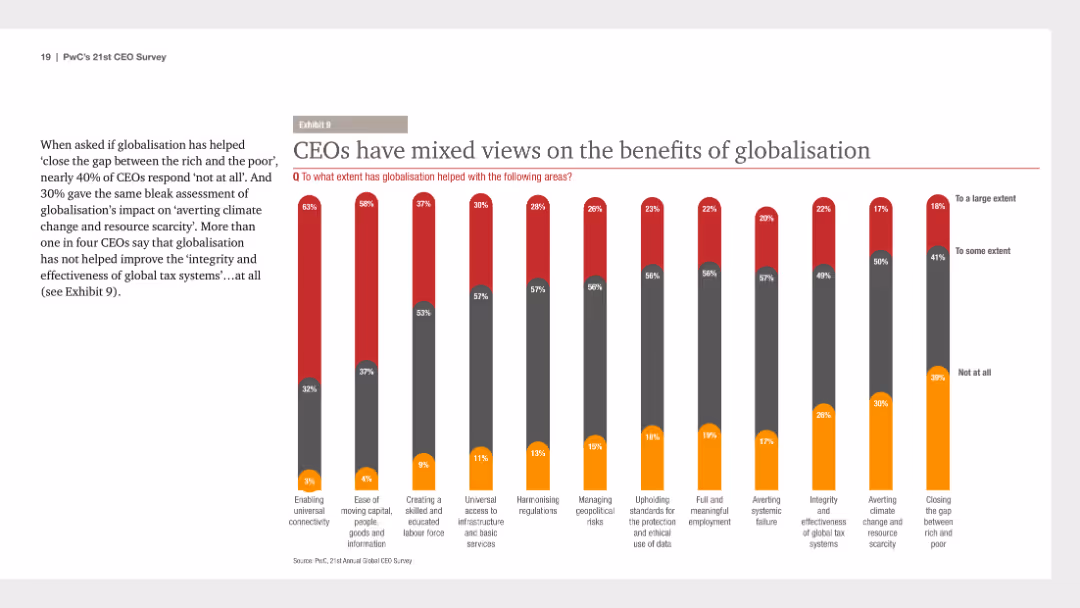
The slide features a series of column charts displaying CEOs' views on the benefits of globalization in various areas, with columns color-coded to show different extents of agreement.
Market Analysis and Trends
Financial Services
It presents mixed CEO opinions on globalization's benefits, such as enabling connectivity and managing geopolitical risks, useful for understanding diverse viewpoints on globalization impacts.
globalization, CEO views, benefits, market analysis, 2018, column charts, financial survey, PwC, CEO Survey, mixed opinions
Mixed Chart
PwC/Strategy&
Saved
A minimalistic design with the title text prominently displayed against a light blue geometric background.
Investment Analysis
Financial Services
This slide presents the fiscal year and quarter, highlighting its purpose as an investor presentation. It is used to set the context for the financial information that will follow.
Fiscal, Quarter, Investor, Presentation, Financial
Title
Booz Allen Hamilton
Saved
This slide presents a structured list with the table of contents for the ESG report, detailing different sections such as leadership, business, and approaches to ESG.
Regulatory and Compliance
Professional Services
The table of contents for the 2022 ESG report, outlining key sections and page numbers, functioning as a navigational guide for readers.
Contents, ESG, Sections, Structure, Professional
Agenda
Booz Allen Hamilton
Saved
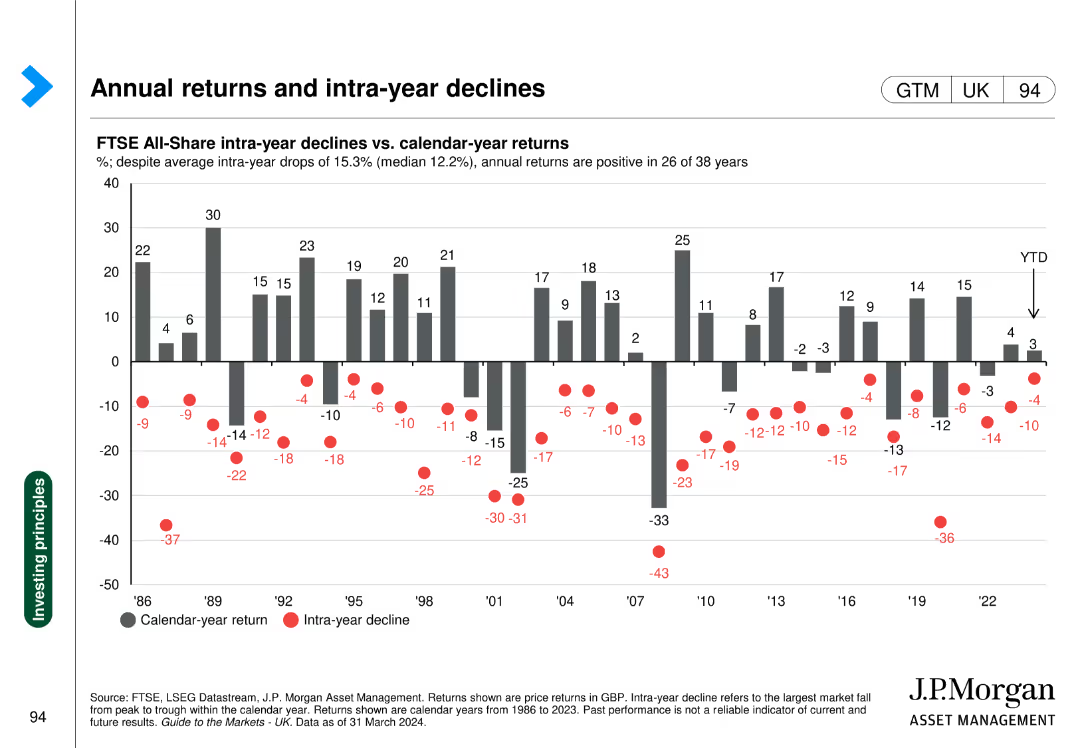
The slide features a column chart with annual returns and a scatter plot of intra-year declines represented as red dots for FTSE All-Share from 1986-2023.
Investment Analysis
Financial Services
This slide compares FTSE All-Share annual returns against intra-year declines, showing the volatility and overall performance trends over multiple years.
FTSE, annual returns, intra-year declines, volatility, investment analysis
Single Chart
JP Morgan
Saved
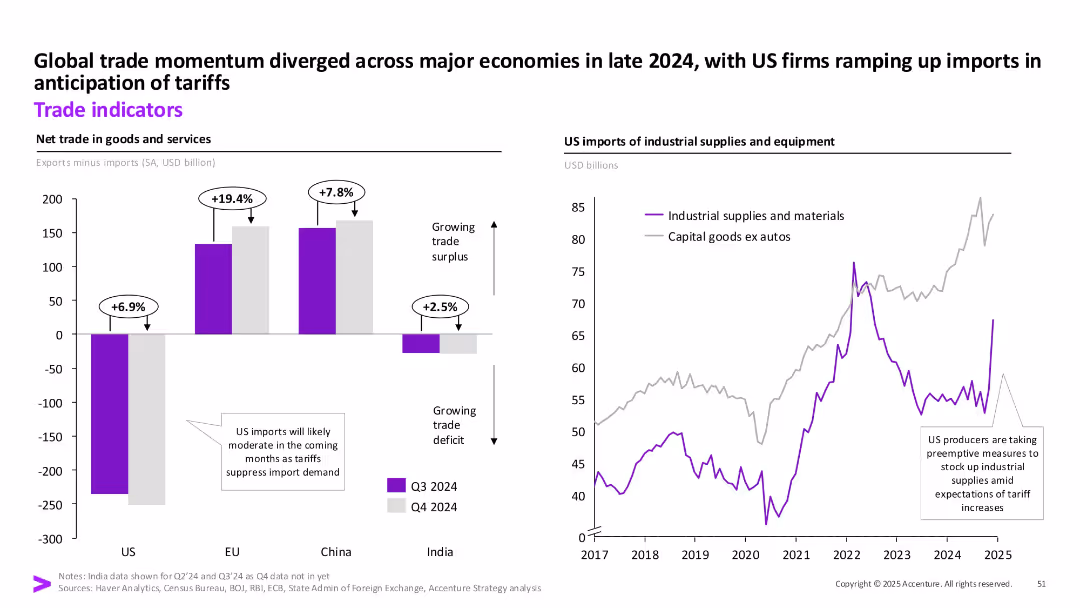
Two-panel visual: Left bar chart shows net trade in goods/services by region; Right line chart shows US imports of industrial supplies and equipment.
Market Analysis and Trends
Transportation & Logistics
The slide highlights shifts in trade balances and a sharp rise in US imports of industrial goods in late 2024, driven by preemptive action against anticipated tariff hikes. The chart compares Q3 and Q4 trade flows globally.
trade, imports, tariffs, industrial supplies, net trade, US, Q4 2024
Multiple Chart
Accenture
Saved
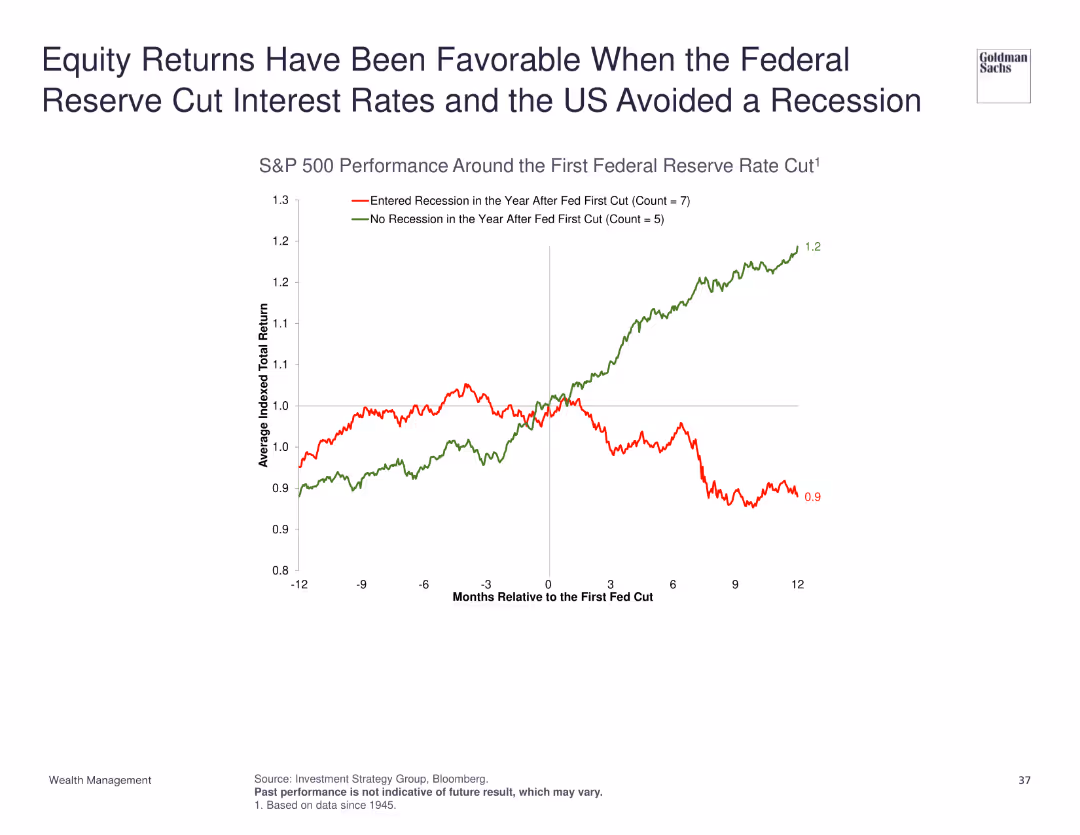
Line chart showing the performance of the S&P 500 around the first Federal Reserve rate cut, differentiating between periods with and without recession.
Market Analysis and Trends
Financial Services
Demonstrates that equity returns have been favorable when the Federal Reserve cuts interest rates and the US avoids a recession, with a detailed performance analysis of the S&P 500.
equity returns, Federal Reserve, interest rates, recession
Single Chart
Goldman Sachs
Saved
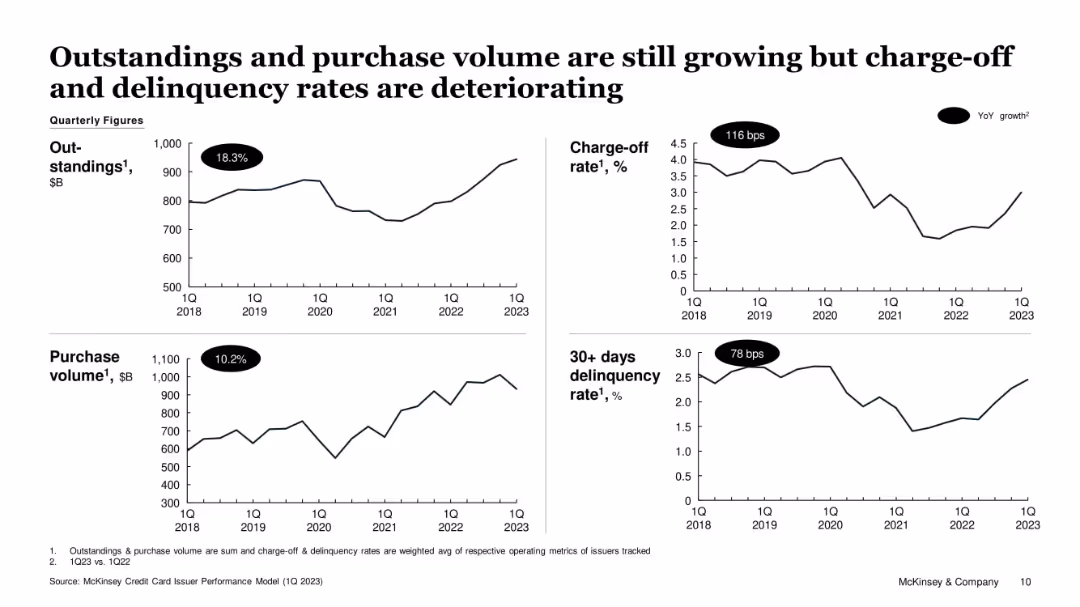
Four-panel line chart dashboard format; clear YoY labels for growth in key credit indicators
Performance Metrics and KPIs
Financial Services
The slide presents trends in credit metrics from 2018 to 2023. Despite 18.3% growth in outstandings and 10.2% growth in purchase volume, charge-off and 30+ day delinquency rates have risen significantly. This suggests increased consumer borrowing risks despite continued credit activity expansion.
credit cards, outstandings, delinquency, charge-off, purchase volume, consumer risk, McKinsey
Single Chart
McKinsey
Saved
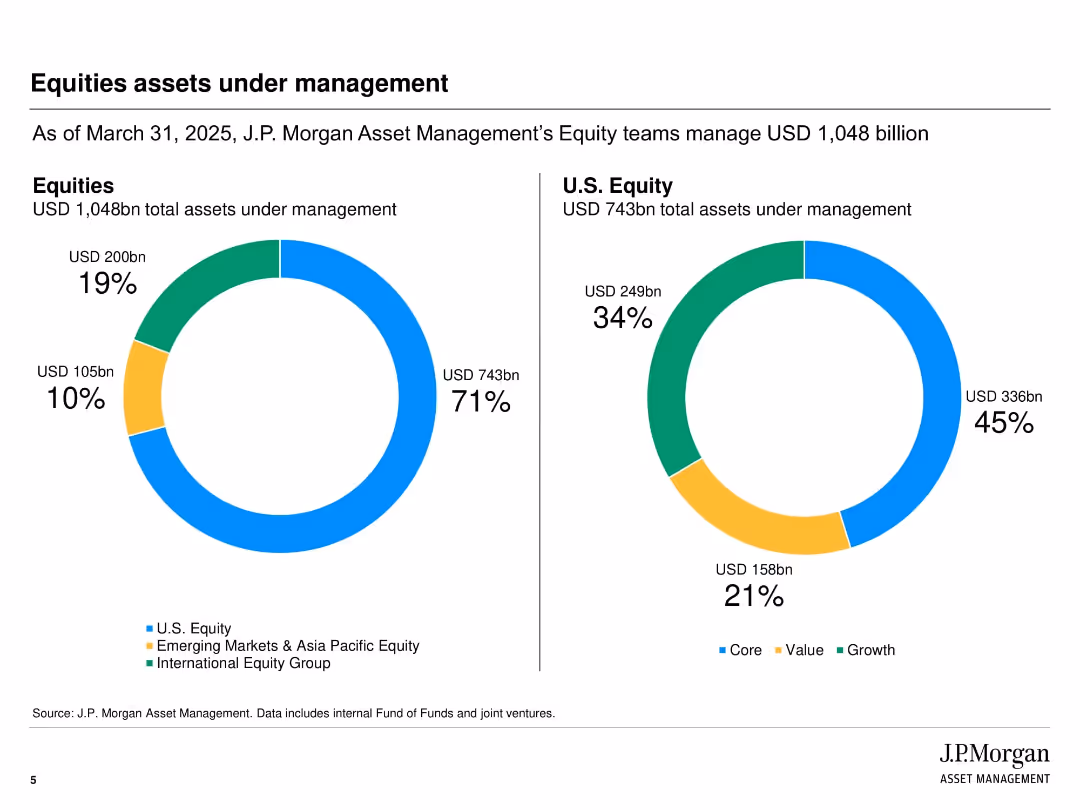
Dual donut charts visually breaking down total equities by region and style.
Performance Metrics and KPIs
Financial Services
Displays a detailed breakdown of USD 1,048 billion equities AUM. U.S. equity represents 71%, and styles are split into Core (45%), Growth (34%), and Value (21%). Helps stakeholders understand portfolio composition.
equities, AUM, U.S. equity, growth, value, portfolio distribution, investment strategy, performance
Multiple Chart
JP Morgan
Saved
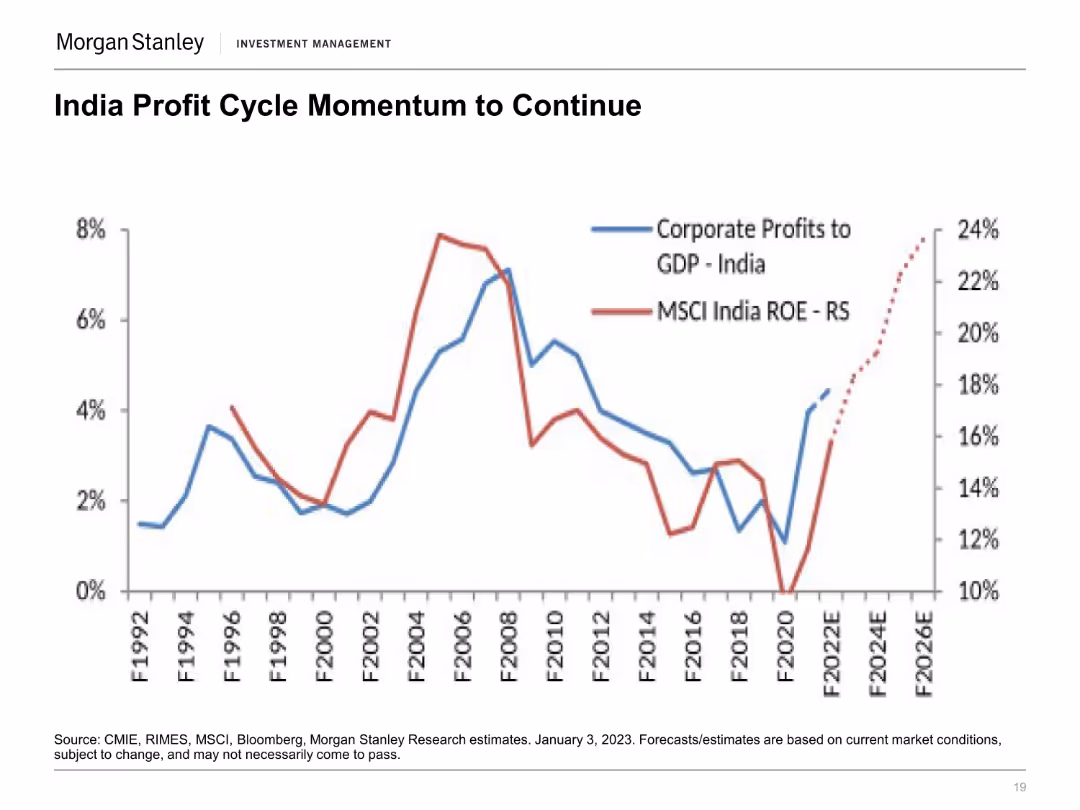
A line chart showing two lines: Corporate Profits to GDP - India (blue) and MSCI India ROE - RS (red) from F1992 to F2026E. The chart has two Y-axes for percentage values.
Market Analysis and Trends
Financial Services
The slide analyzes the profit cycle of Indian corporate profits relative to GDP and the MSCI India ROE, projecting continued momentum through 2026.
India, GDP, Corporate Profits, MSCI, ROE
Single Chart
Morgan Stanley
Saved
The slide features two doughnut charts detailing the number of deals and investment value distribution across different stages in Indonesia for 2017.
Market Analysis and Trends
Financial Services
Discusses the stages of investment in Indonesia, highlighting the predominance of seed and early-stage investments generating most of the value.
Indonesia, Investment Stages, Seed, Trends
Mixed Chart
Kearney
Saved
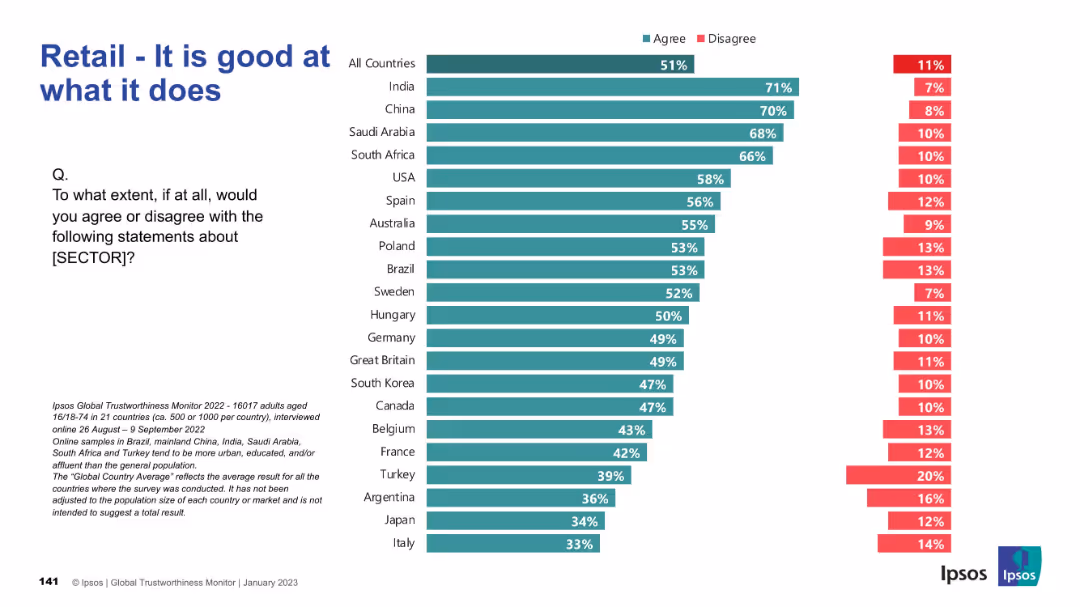
Horizontal bar chart on the competence of the retail sector as perceived by consumers in different countries.
Market Analysis and Trends
Retail & E-commerce
This slide displays international public perception on the competency and effectiveness of the retail sector, based on survey results from 21 countries.
retail, performance, competence, Ipsos, consumer view, global survey, public opinion, efficiency, trust
Mixed Chart
IPSOS
Saved
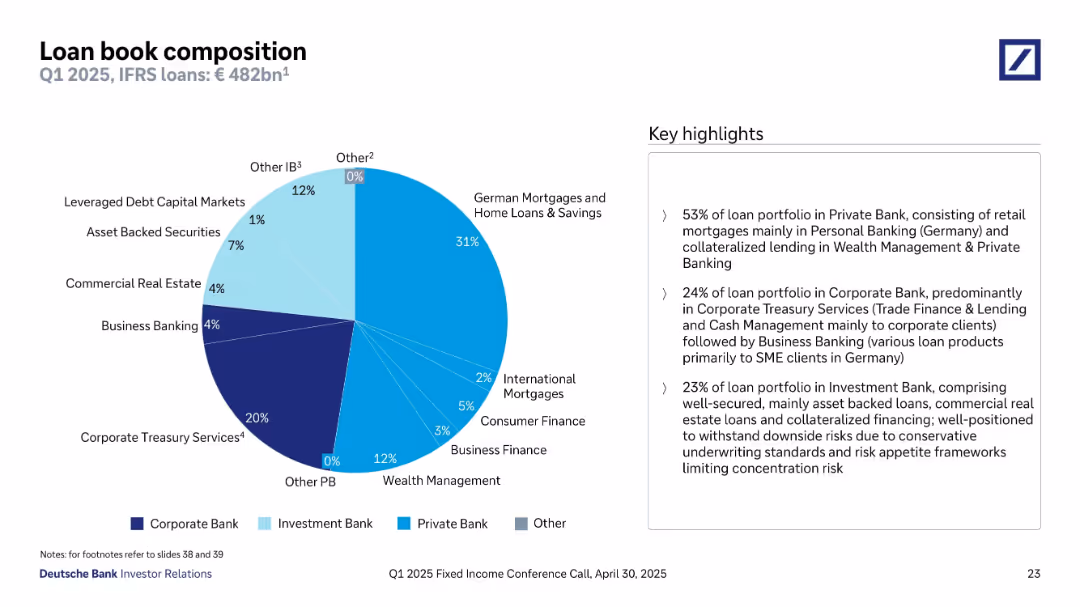
Pie chart on the left showing loan distribution by type and bank division; key highlights on right.
Financial Performance
Financial Services
The slide breaks down Deutsche Bank’s €482bn loan book as of Q1 2025. It categorizes loans across divisions: Private Bank (53%), Corporate Bank (24%), and Investment Bank (23%). Key components include German mortgages (31%), corporate treasury services (20%), and asset-backed securities (7%). Key insights describe loan types, risk positioning, and client segmentation.
loan book, private bank, investment bank, mortgage, corporate lending, asset-backed, Q1 2025, risk, client segmentation, Germany
Mixed Chart
Deutsche Bank
Saved
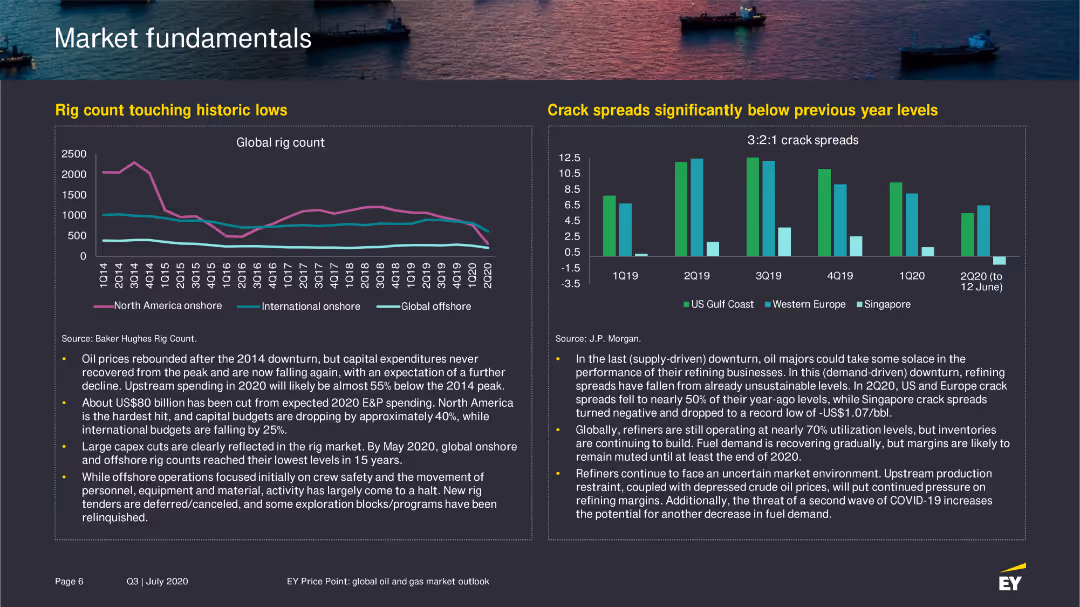
The slide includes a line chart showing the global rig count from Q1 2014 to Q2 2020 and a bar chart comparing crack spreads in different regions from 2019 to 2020.
Market Analysis and Trends
Energy & Utilities
Details the decline in global rig count and the low crack spreads, discussing the implications for the oil and gas industry.
rig count, oil industry, crack spreads, 2020
Multiple Chart
EY
Saved
Pie chart and accompanying text estimating the duration of COVID-19's impact on personal finances. Different time frames are shown as segments of the pie chart.
Market Analysis and Trends
Financial Services
This slide shows Canadian investors' perceptions of how long COVID-19 will affect their personal finances. It includes predictions ranging from a few months to more than 18 months, highlighting uncertainties and differences based on demographics.
COVID-19, Personal Finances, Canadian, Duration, Impact
Mixed Chart
IPSOS
Saved
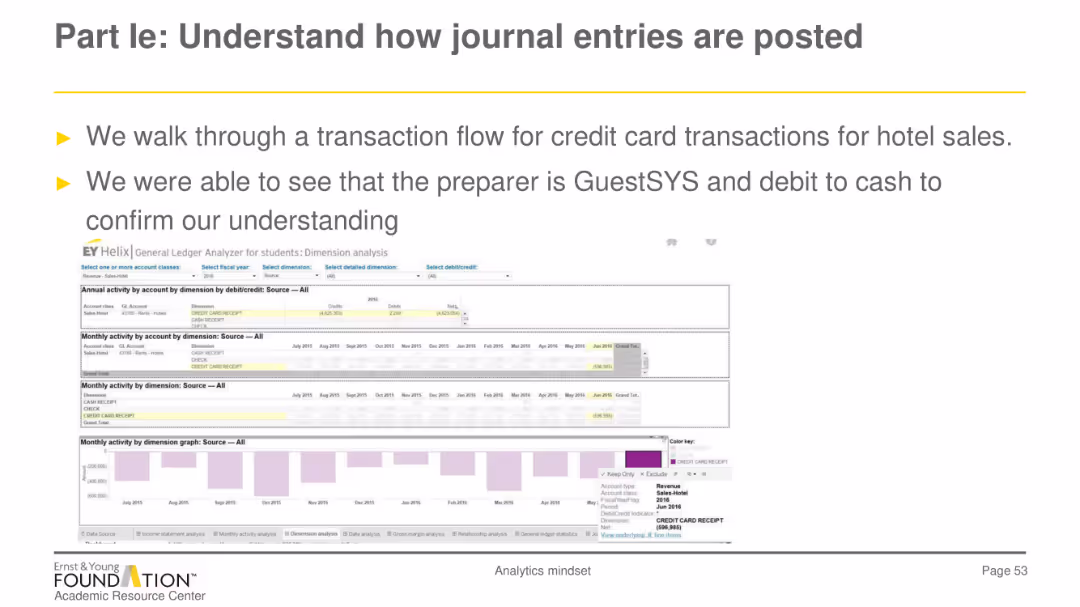
The slide includes detailed textual descriptions of the transaction flow for credit card transactions for hotel sales, along with a visual representation of the transaction process.
Regulatory and Compliance
Financial Services
This slide walks through the transaction flow for credit card transactions for hotel sales, illustrating the role of the preparer and the debit to cash for confirmation of understanding.
journal entries, transaction flow, credit card transactions, hotel sales, financial analysis
Mixed Chart
EY
Saved
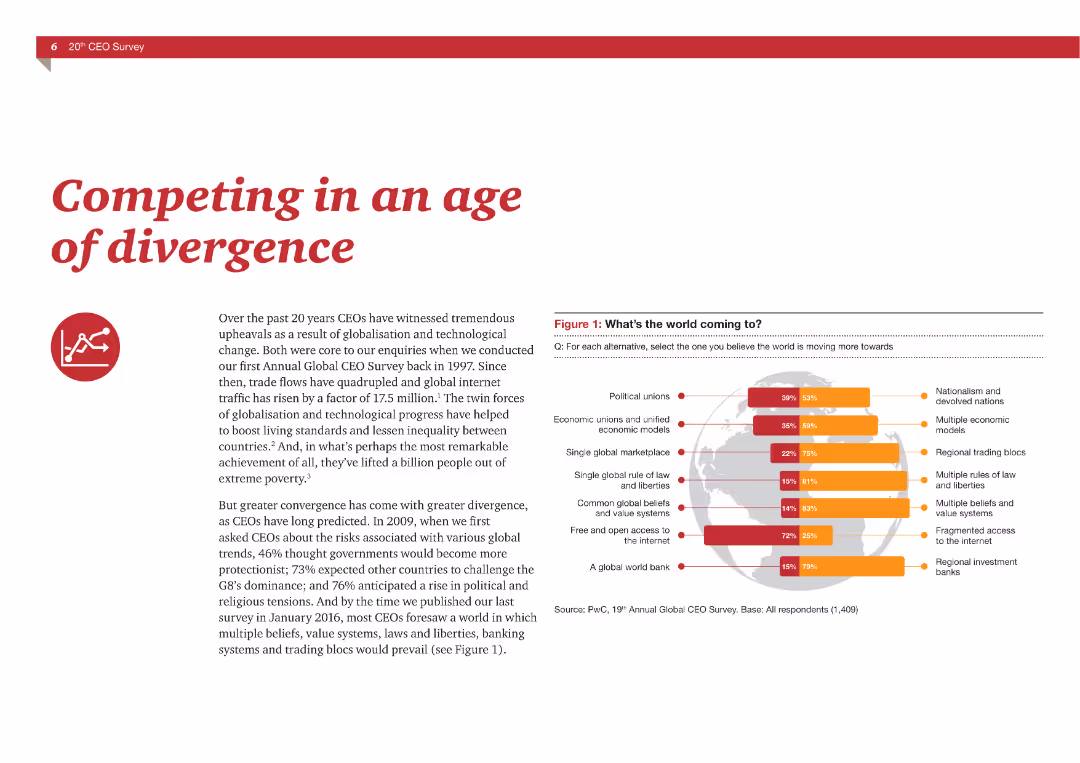
A mix of text and a chart, the chart shows CEOs' predictions about the future global scenario, with a world map highlighting different outcomes.
Strategic Planning
Professional Services
The slide discusses the impact of globalization and technological changes on business strategies, presenting survey data from CEOs.
globalization, CEO survey, future trends, business strategy, divergence
Mixed Chart
PwC/Strategy&
Saved
Slide contains column charts and future projections.
Investment Analysis
Financial Services
Highlights plans and performance regarding shareholder distributions.
shareholder, dividends, buybacks
Multiple Chart
Deutsche Bank
Saved
This slide consists of six line graphs, each for a different country, showing search volume trends for food delivery services over time, indexed to 2017 levels. The graphs are accompanied by annotations indicating the fold increase in search interest. The layout is clean, with each graph neatly separated and clearly labeled.
Market Analysis and Trends
Hospitality & Tourism
The slide details the enduring high interest in food delivery services post-COVID, as demonstrated by search volume data from Google Trends. Each country's graph underscores the sustained increase in consumer interest, with annotations providing a quick reference to the scale of change compared to 2017 levels.
food delivery, search trends, COVID-19 impact, consumer interest, Southeast Asia, Google Trends, index comparison, market analysis
Multiple Chart
Bain
Saved
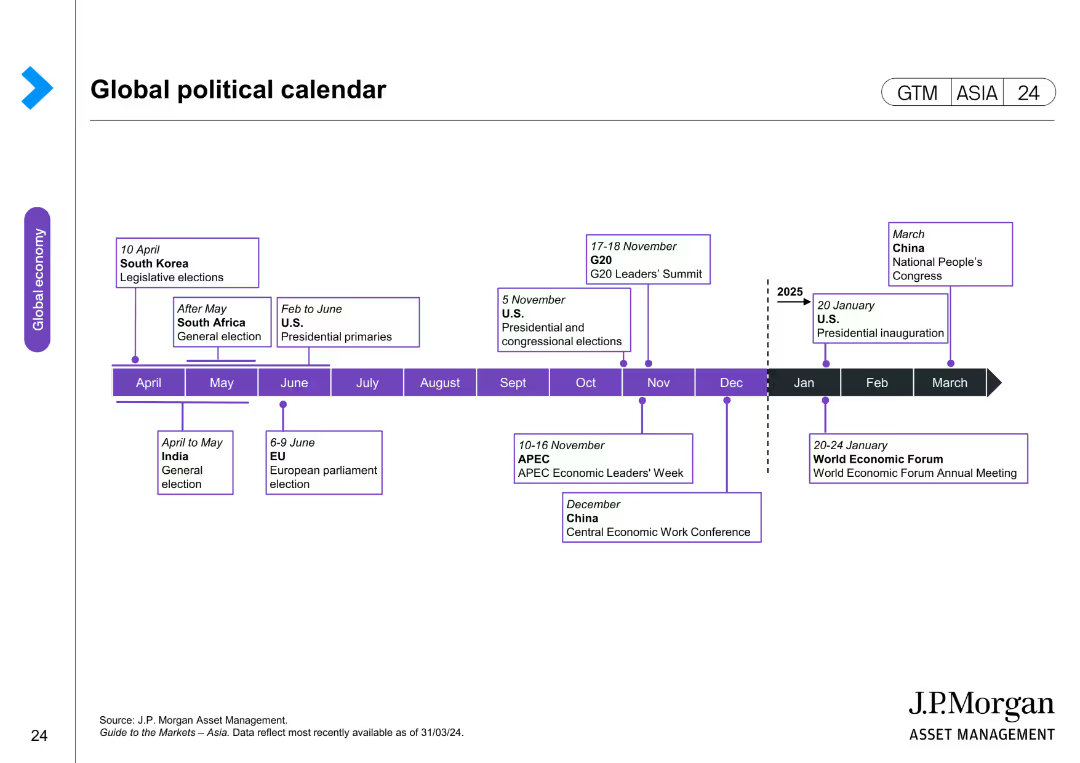
The slide displays a timeline with key global political events, including elections and summits, marked on a monthly basis. Events are categorized by country and type, with brief descriptions of each.
Strategic Planning
Government & Public Sector
The slide outlines a global political calendar, highlighting important political events and their timelines. It is used for strategic planning and understanding geopolitical impacts on markets.
political events, global timeline, elections, summits, geopolitical analysis, strategic planning, government calendar
Linear Flow
JP Morgan
Saved
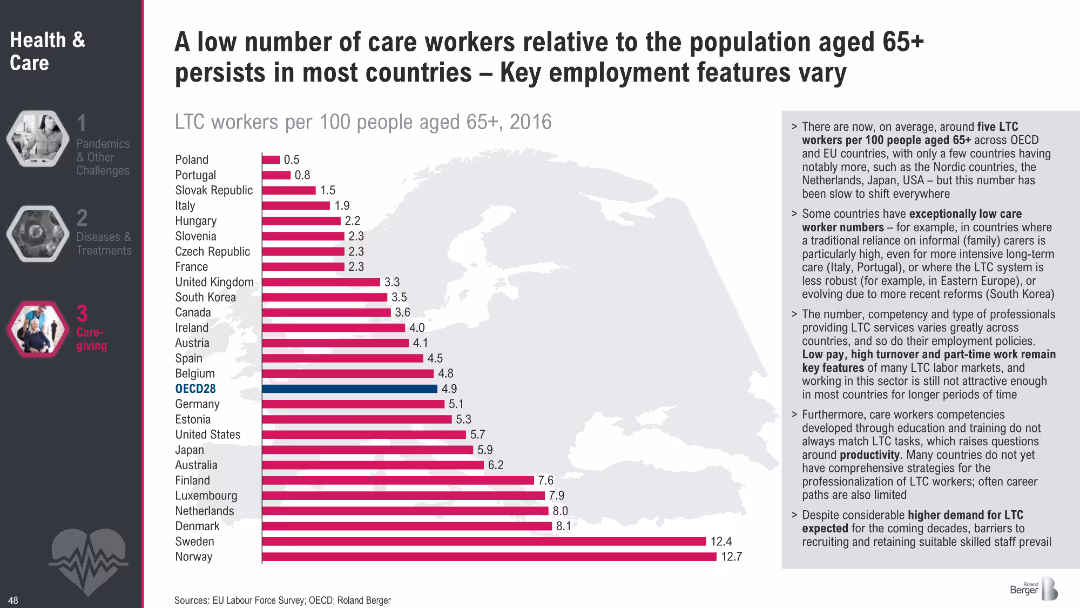
Bar chart ranking countries by LTC workers per 100 people aged 65+; side text outlines causes for variation and key challenges in care employment.
Human Resources and Talent Management
Healthcare & Pharmaceuticals
This slide highlights the low number of LTC workers relative to aging populations in most countries, with wide variations. It points to systemic employment challenges, including low pay, high turnover, and insufficient professional training.
LTC workforce shortage, care worker density, aging population, eldercare employment, international comparison, labor market
Mixed Chart
Roland Berger
Saved
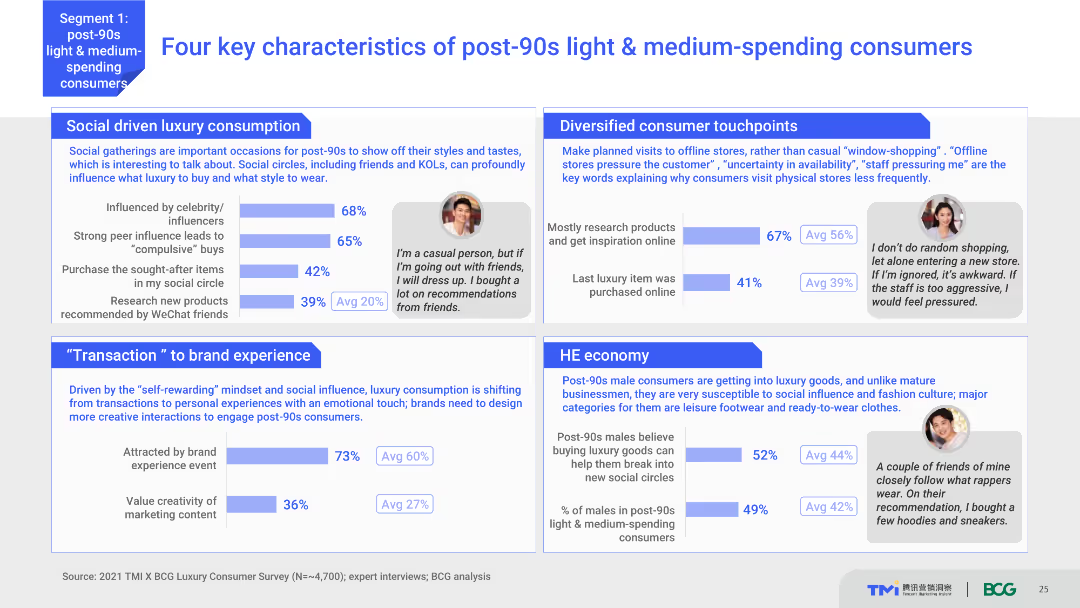
The slide uses a content layout with text, charts, and testimonials. It highlights four key characteristics of post-90s light & medium-spending consumers, supported by survey data and personal quotes. The visual complexity is moderate with clear segmentation and relevant visuals.
Customer and Market Segmentation
Consumer Goods
This slide outlines the main characteristics of post-90s light and medium-spending consumers, focusing on their social-driven luxury consumption, diversified touchpoints, and specific economic behaviors. It includes testimonials for context.
consumer characteristics, post-90s, luxury consumption, social influence, economic behavior
Multiple Chart
BCG
Saved
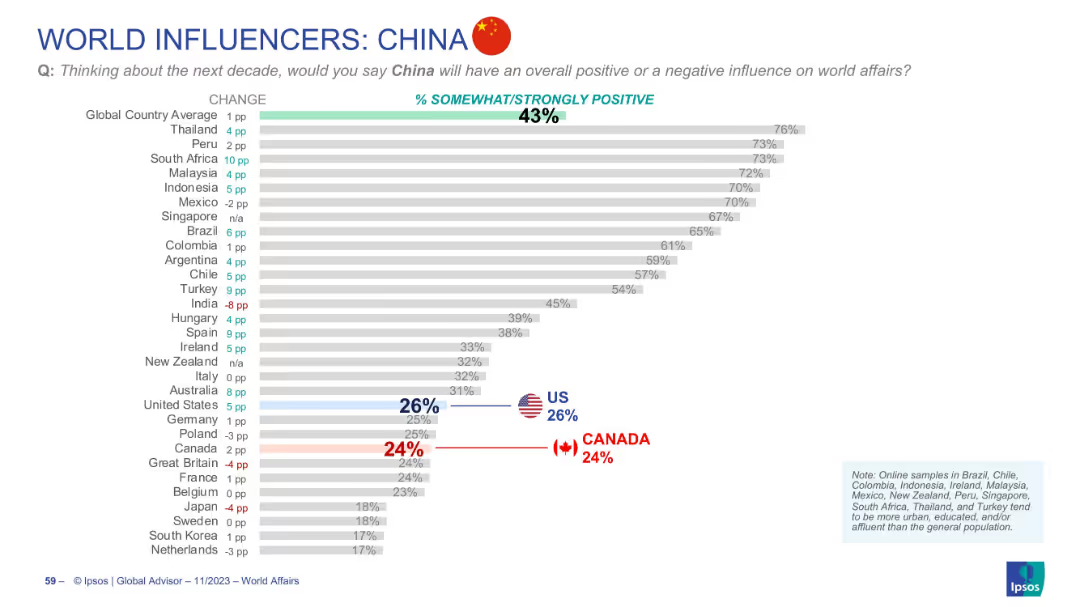
Horizontal bar graph of countries’ perceptions of China’s influence, with flags and large percentage markers for US and Canada.
Market Analysis and Trends
Government & Public Sector
This slide ranks global sentiment on China's influence over the next decade. The average positive view is 43%, with Southeast Asia showing high support. Western countries, especially Canada and the US, are much lower.
China, global influence, opinion, trends, perception, Ipsos, international relations, Asia
Single Chart
IPSOS
Saved
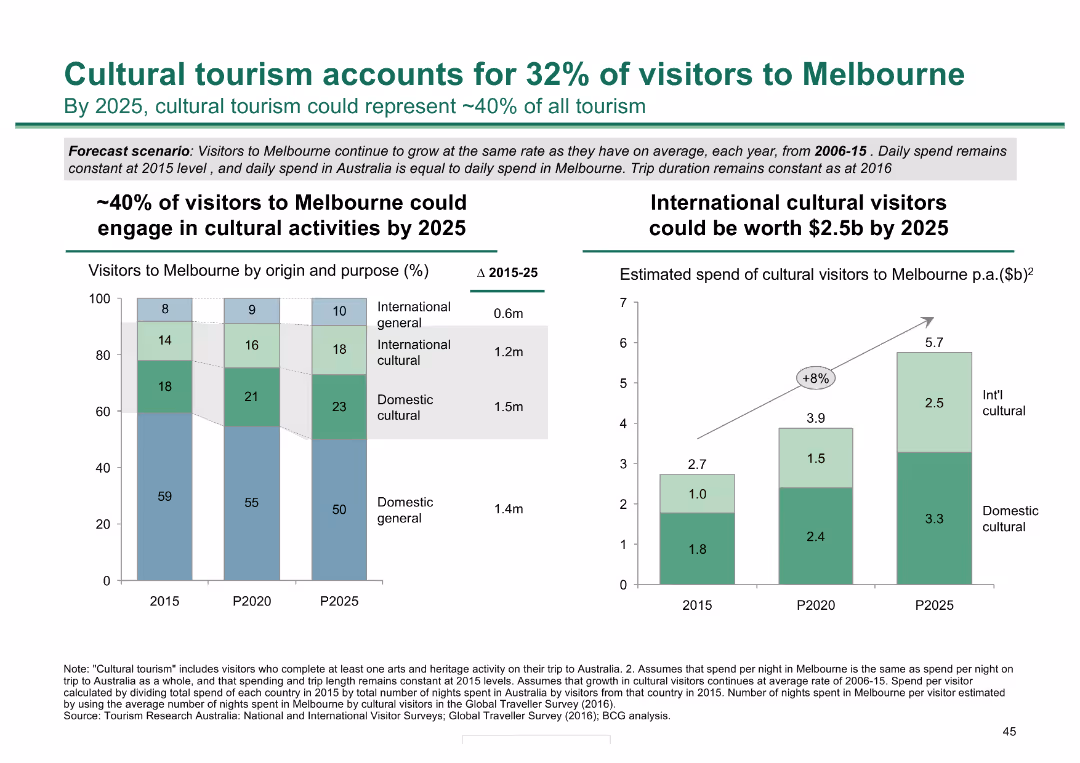
Two column charts: one shows the percentage of visitors to Melbourne by origin and purpose, the other estimates the spend of cultural visitors by 2025.
Market Analysis and Trends
Hospitality & Tourism
Projects the growth of cultural tourism in Melbourne by 2025, predicting it could account for 40% of visitors and be worth $2.5 billion annually.
cultural tourism, Melbourne, visitors, market analysis, spending
Multiple Chart
BCG
Saved
Previous
Next
If nothing, comes up, please save your slides first
Create a FREE account to continue browsing
Receive Instant Access to 1,000+ slides from companies like McKinsey, Google, and Goldman Sachs
First Name
Last Name
Email
Password
I agree to all
Terms & Privacy Policy
Thank you! Your submission has been received!
Oops! Something went wrong while submitting the form.
Have an account?
Sign in
Column Chart
Heatmap
Chevron
Org Chart
Infographic
Callouts
Timeline
List
Graphic
Picture
Process Flow
Diagram
Paragraph
Map
Table
Framework
Subtitle
Takeaway Box
Icon
Other Chart
Radar Chart
Waterfall Chart
Mekko Chart
Pie Chart
Scatter Plot
Line Chart
Bar chart
Bullet points