My Account
My Slides
Search by Category
Templates
Leave Feedback
Login
Logout
Get Started
Browse all Slides
Browse all Slides
Create a FREE Account
Instant access to 1,000+ real slides from top companies like McKinsey, BCG, Goldman Sachs, Google and many more!
First Name
Last Name
Email
Password
I agree to all
Terms & Privacy Policy
Thank you! Your submission has been received!
Oops! Something went wrong while submitting the form.
Have an account?
Sign in
Saved Slides
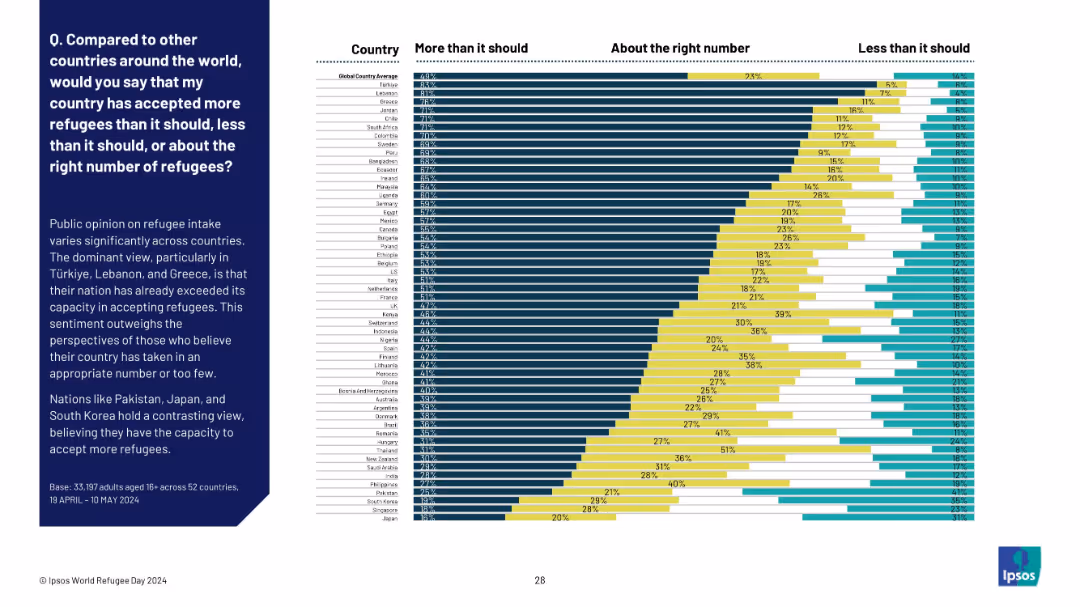
Country-by-country horizontal stacked bar chart
Market Analysis and Trends
Government & Public Sector
Similar to slide 19908 but at the country level, this visualization shows national attitudes toward refugee intake. Türkiye and Lebanon top the list for believing their countries have exceeded capacity, while Japan and South Korea indicate room for increased acceptance.
refugee capacity, country comparison, Ipsos, over-intake, under-intake, perceptions
Mixed Chart
IPSOS
Saved
The slide displays a diagram outlining data collection methods for operations and maintenance, linking past surveys to updated methods and areas of focus like energy use.
Operational Efficiency
Environmental Services & Sustainability
Highlights the methodology for collecting data on operations and maintenance, updating from past practices to improve accuracy in resource use and environmental impact assessments.
Data collection, operations, maintenance, environmental impact, resource use, methodology update, energy consumption, sustainability practices
Diagram
Deloitte
Saved
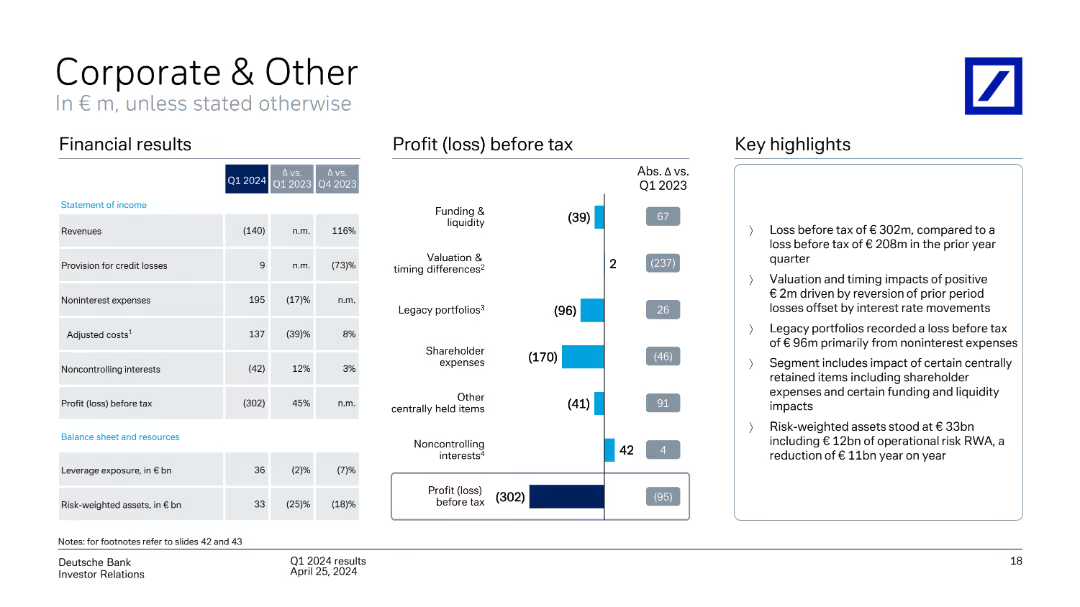
A column chart showing profit (loss) before tax by segment, with a table of financial results and key highlights. The slide is moderately dense with a mix of textual and visual elements.
Financial Performance
Financial Services
The slide details Q1 2024 financial results for the Corporate & Other segment, highlighting revenue, profit (loss) before tax, and key insights into various financial metrics and performance.
Corporate & Other, profit before tax, financial results, Q1 2024, performance
Mixed Chart
Deutsche Bank
Saved
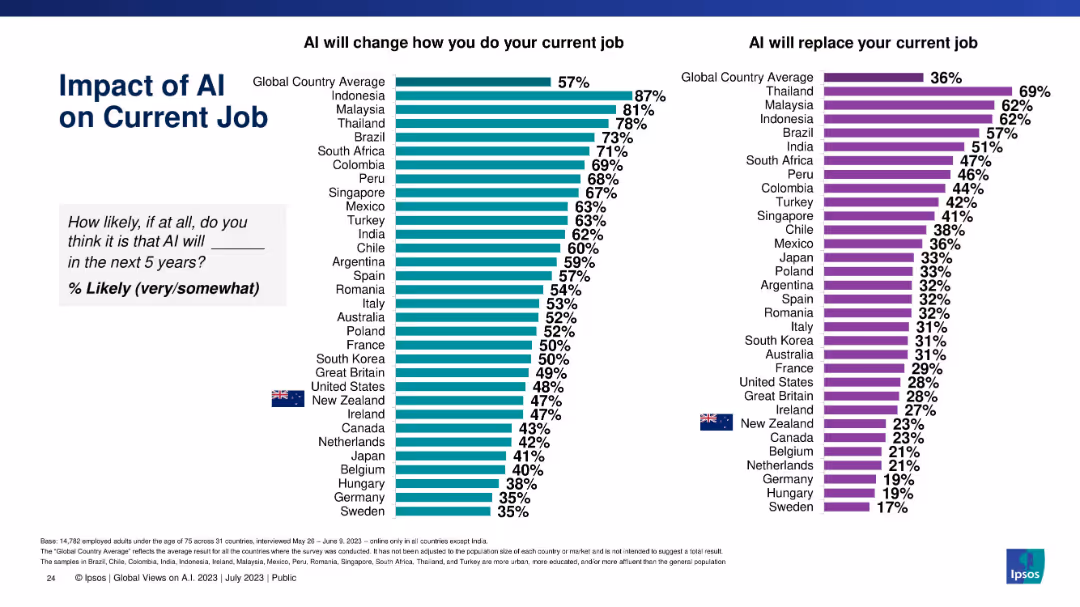
Horizontal bar charts comparing 30+ countries' likelihood perception on AI changing or replacing jobs, with country flags and percentage values.
Market Analysis and Trends
Artificial Intelligence
This slide presents global comparisons of opinions on whether AI will change or replace jobs in the next five years. It ranks countries based on perceived likelihood, highlighting global disparities.
AI, global comparison, job change, job replacement, perception, countries, survey data, Ipsos, horizontal bars
Multiple Chart
IPSOS
Saved
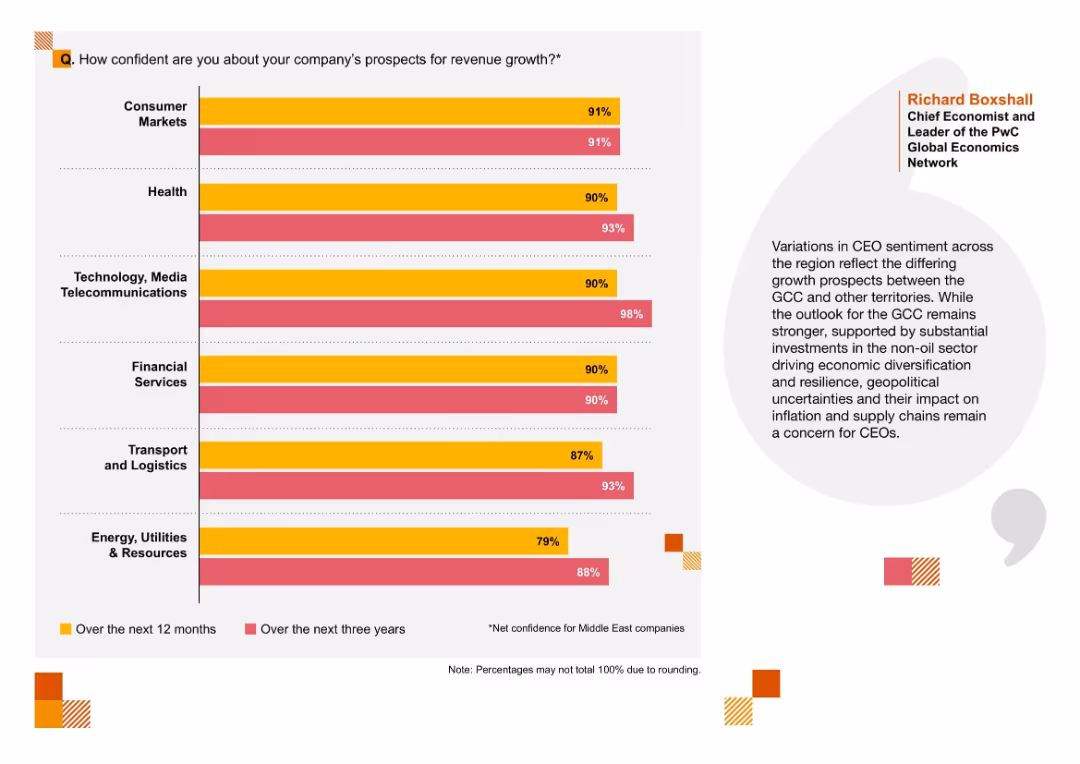
Vertical bar chart comparing confidence levels across industries for revenue growth over 12 months vs three years. Minimalist design with strong color contrast.
Financial Performance
Professional Services
This slide presents CEO confidence in revenue growth across various sectors, showing strongest outlooks in Consumer Markets, Technology, and Health sectors. It uses dual bars per industry to represent confidence over short- and mid-term horizons and reflects regional growth sentiment.
revenue growth, confidence, sectors, short-term, long-term, GCC, consumer markets
Mixed Chart
PwC/Strategy&
Saved
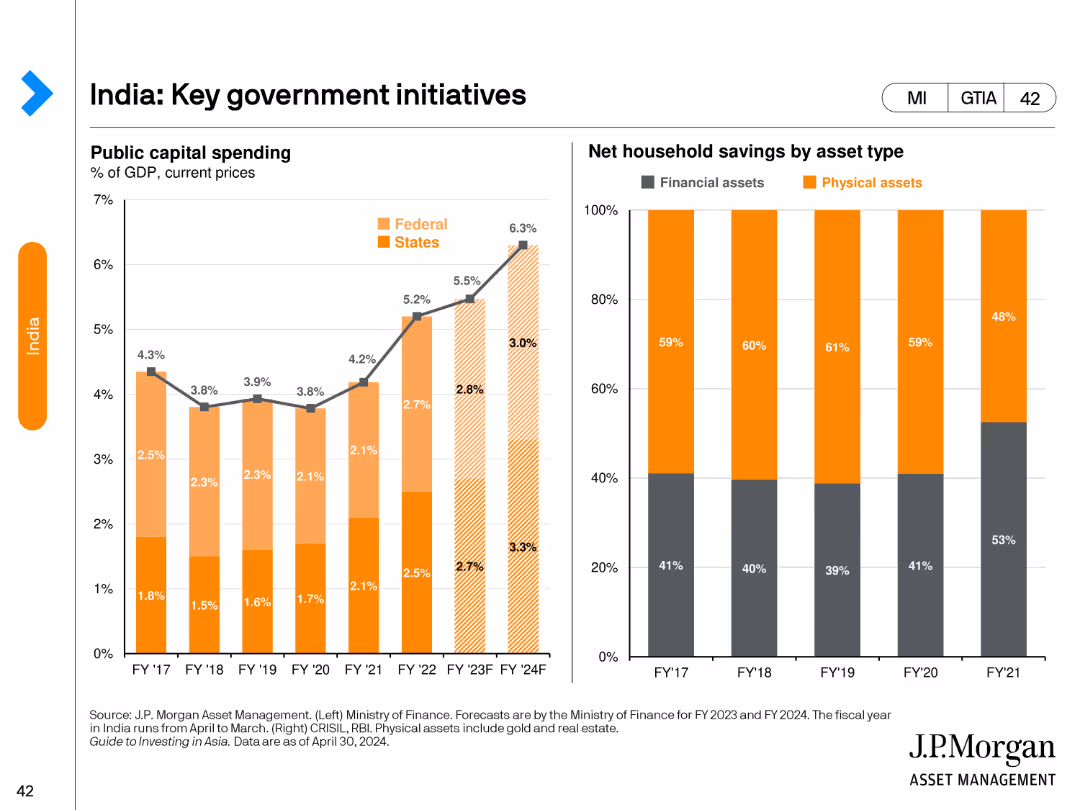
The left side of the slide features a stacked column chart showing public capital spending by federal and state levels from FY17 to FY24F. The right side has a stacked bar chart displaying net household savings by asset type from FY17 to FY21.
Regulatory and Compliance
Government & Public Sector
This slide outlines key government initiatives in India, highlighting trends in public capital spending and household savings to understand fiscal and economic policies.
India, government initiatives, public spending, household savings, fiscal policy
Multiple Chart
JP Morgan
Saved
Slide showing a timeline with a series of column charts depicting the number of deals and their value in the Vietnamese internet sector, annotated with year labels.
Investment Analysis
Technology & Software
Offers an investment overview of Vietnam's internet sector, detailing the number of deals and their values over time. It serves to analyze investment trends and assess the sector's growth, valuable for stakeholders and investors considering the Vietnamese market.
investment, internet sector, Vietnam, deals, growth trend, market analysis
Single Chart
Bain
Saved
Slide contains column chart with projected earnings growth, expense savings, and balance sheet optimization, set against blue and yellow highlights.
Financial Performance
Financial Services
Outlines the strategic path to achieving earnings growth and target returns, emphasizing efficiency, revenue growth, and balance sheet management.
Earnings Growth, Target Returns, Revenue, Expenses, Balance Sheet, Efficiency
Single Chart
Citigroup
Saved
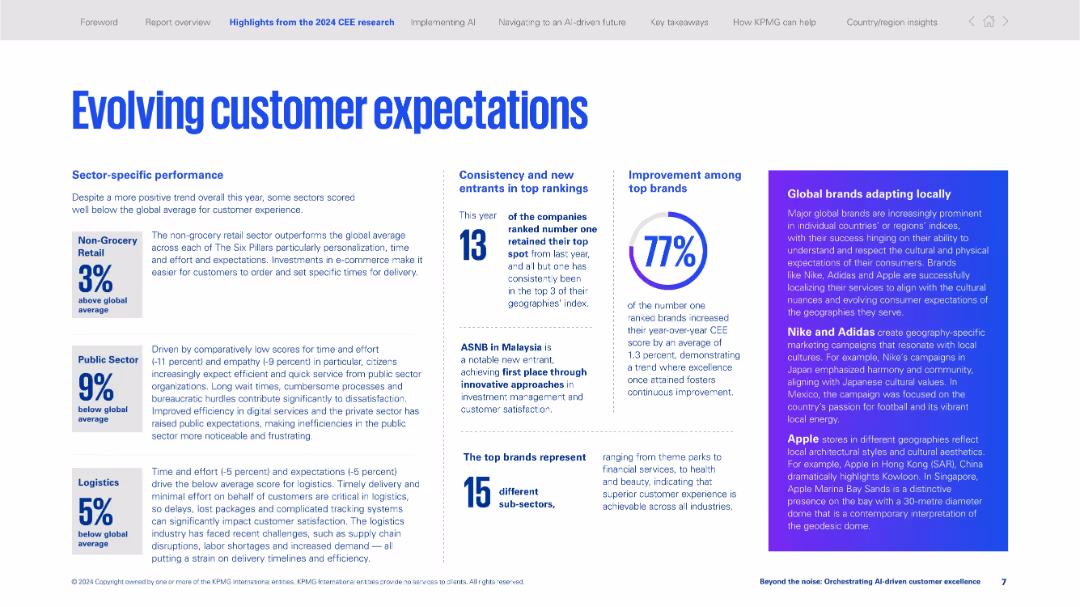
Grid-style layout with data points, stats, and textual commentary about customer experience trends by sector.
Market Analysis and Trends
Professional Services
Analyzes customer experience across sectors such as retail, public, and logistics. Discusses emerging consumer expectations and brand localization strategies. Provides CEE performance benchmarks and brand highlights.
customer experience, sector trends, logistics, retail, public sector, localization, brand strategy, global brands, expectations
Mixed Chart
KPMG
Saved
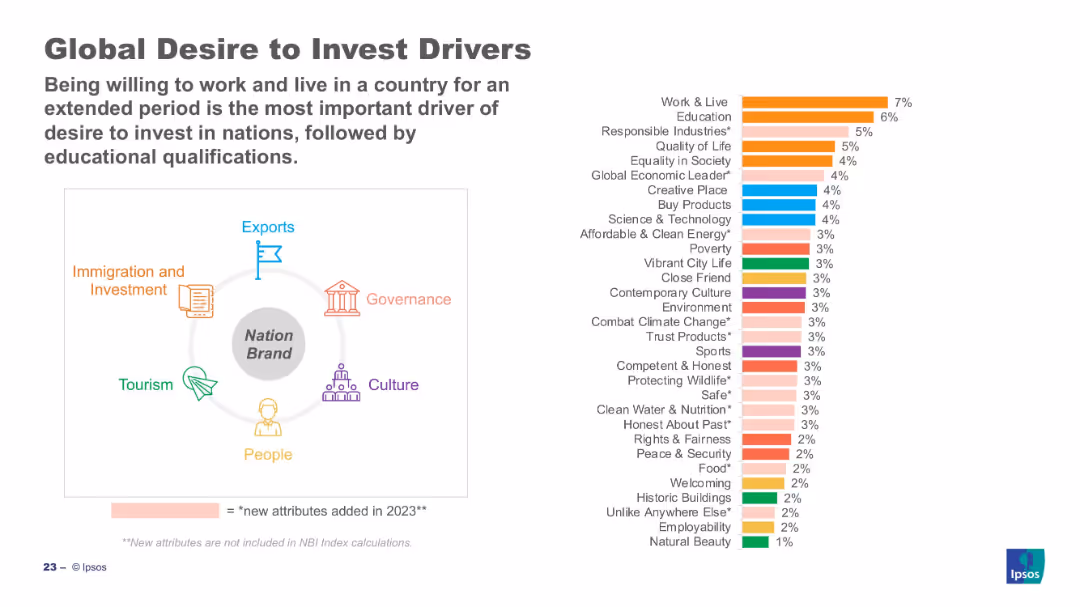
Bar chart (right) ranks top investment drivers; left visual maps drivers to nation brand sectors.
Customer and Market Segmentation
Professional Services
Work & live, education, and responsible industries are top investment drivers globally. The visual shows these drivers categorized under broader nation brand domains such as governance and economy. Many of the attributes were newly added in 2023.
investment, business drivers, Ipsos, perception, work, education, 2023, attributes, sustainability
Mixed Chart
IPSOS
Saved
This slide includes a title, column charts contrasting the number of cases finalised per FTE in FCoA and FCC, and a sidebar explaining differences in judicial output.
Regulatory and Compliance
Government & Public Sector
The slide details the differences in case finalisation per FTE between FCoA and FCC, with a focus on the lower finalisation rate in FCoA despite its higher number of non-judicial staff, pointing to differences in case complexity.
judicial efficiency, FCoA, FCC, finalisation rate, full-time equivalent, case complexity
Multiple Chart
PwC/Strategy&
Saved
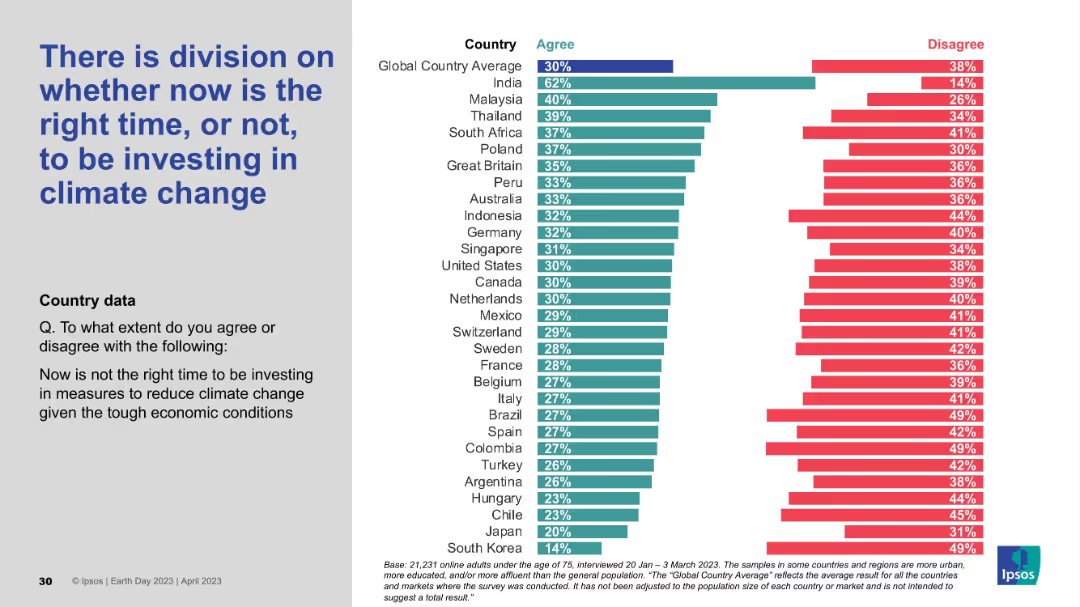
Layout includes left-aligned text and a country-based agreement/disagreement bar chart. Shows mixed levels of agreement across regions.
Investment Analysis
Environmental Services & Sustainability
This slide addresses timing concerns over investing in climate action during economic uncertainty. Opinions are divided, indicating that while some countries like India support immediate investment, others remain hesitant, revealing a tension between urgency and economic pressure.
climate investment, economic conditions, timing debate, public opinion, Ipsos, climate strategy
Mixed Chart
IPSOS
Saved
The slide shows bar graphs comparing Booz Allen's dividend growth to peer average, alongside textual information.
Financial Performance
Financial Services
Highlights the company's quarterly dividend growth compared to peers, reflecting on Booz Allen's strong performance. Used in investment analysis or shareholder presentations.
Dividend, Growth, Comparison, Performance, Market
Single Chart
Booz Allen Hamilton
Saved
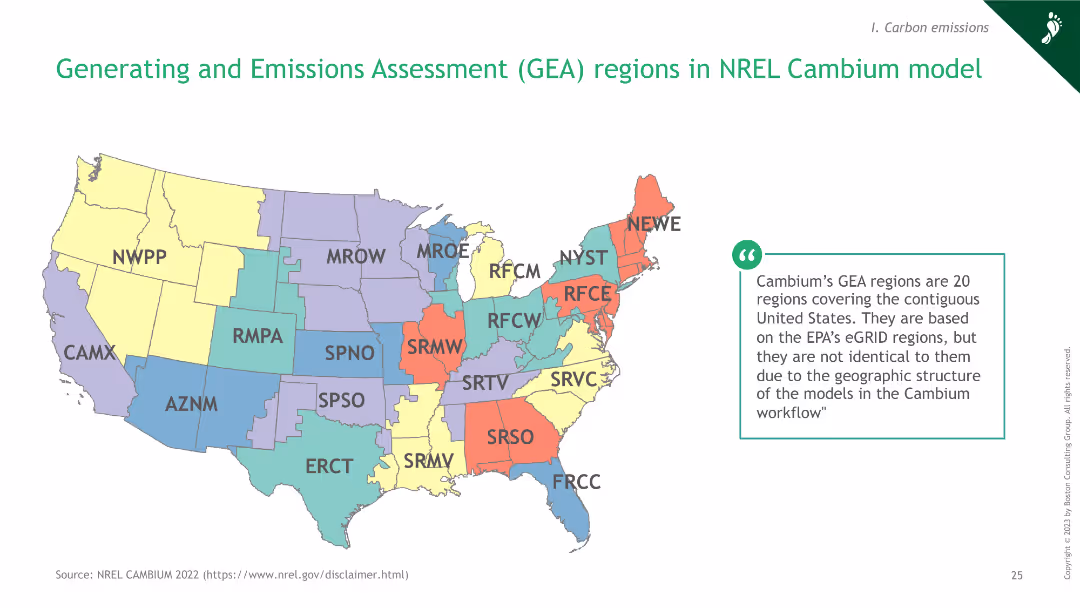
A map of the United States showing the Generating and Emissions Assessment regions as defined by the NREL Cambium model.
Regulatory and Compliance
Energy & Utilities
The slide presents the GEA regions within the NREL Cambium model, outlining the regional coverage for emissions and generation assessments.
hydrogen, GEA, regions, NREL, emissions
Graphic
BCG
Saved
This slide features multiple line charts displaying year-on-year changes in credit card sales across various retail sectors. The layout includes two main sections for short-term impacts and recovery paths, with annotations and a clear color-coded legend.
Market Analysis and Trends
Retail & E-commerce
This slide analyzes the short-term impact of the COVID-19 pandemic on different retail sectors and predicts their recovery paths. It highlights the contrast between essential and non-essential retailers, using data-driven insights to project future industry trends.
Retail, COVID-19, Recovery, Online Sales, Impact Analysis
Multiple Chart
BCG
Saved
Contains multiple bar graphs comparing platform usage over two years across different Southeast Asian countries, with a clear legend and annotations.
Customer and Market Segmentation
Retail & E-commerce
Shows the increase in the average number of online platforms used per person in Southeast Asia from 2021 to 2022.
Online shopping, user data, SEA
Boxed
Bain
Saved
This slide is rich with column charts, dotted lines, and textual annotations, displaying financial growth trends in navy blue and light blue.
Financial Performance
Financial Services
Demonstrates a decade of financial performance, emphasizing consistent growth and strong returns, relevant for investors and analysts.
net income, ROTCE, TBVPS growth, financial growth, performance, decade, trends, investment
Multiple Chart
JP Morgan
Saved
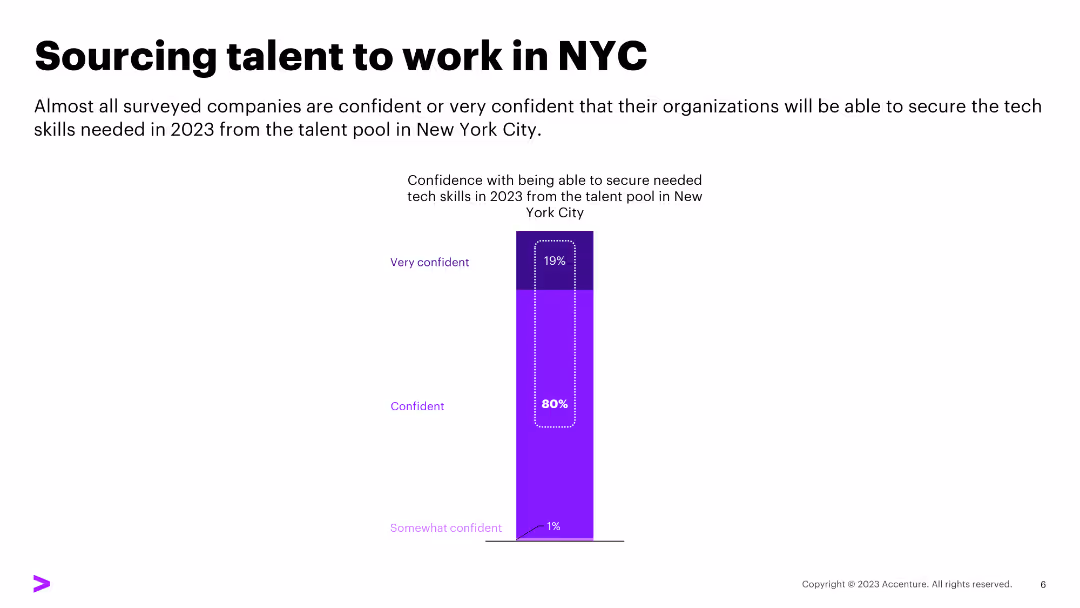
White background with multiple purple column charts comparing hiring priorities and difficulties
Human Resources and Talent Management
Technology & Software
It highlights the top skills in demand for tech talent, focusing on cloud, security, and AI skills
Cloud, Security, AI, Tech Skills, Hiring Priorities
Single Chart
Accenture
Saved
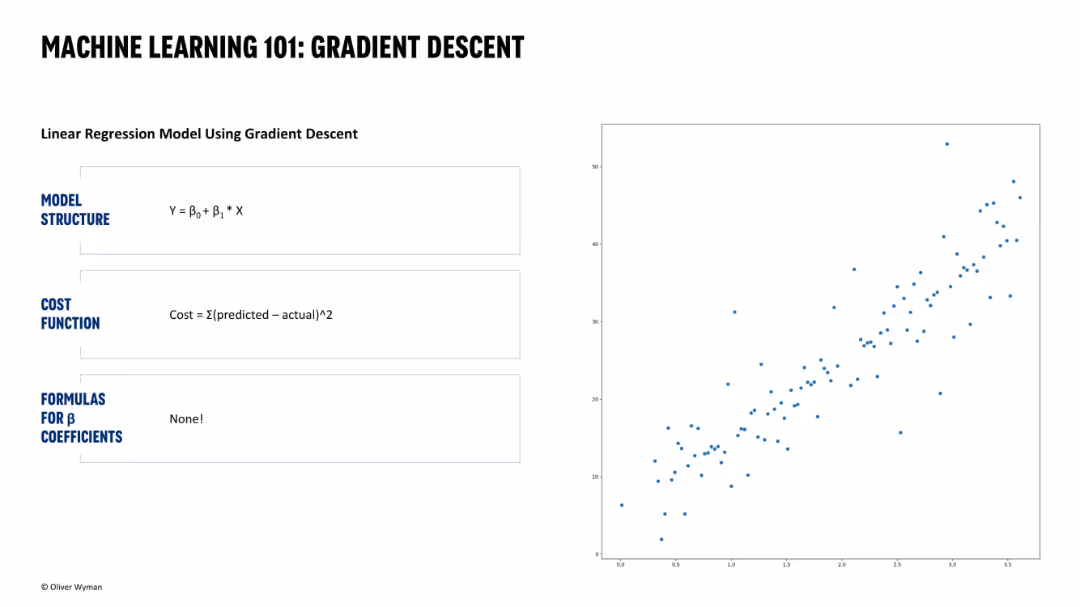
Similar layout to Slide 16331. Left panel shows model structure and cost function with "None!" under formulas. Scatter plot on the right shows data without regression line.
Technology and Digital Transformation
Artificial Intelligence
Introduces the gradient descent method for linear regression. It contrasts traditional analytical formulas by not requiring explicit coefficient formulas and visually represents raw data distribution.
gradient descent, linear regression, cost function, machine learning, no formulas, model structure, predictive analysis, data visualization, scatter plot
Single Chart
Oliver Wyman
Saved
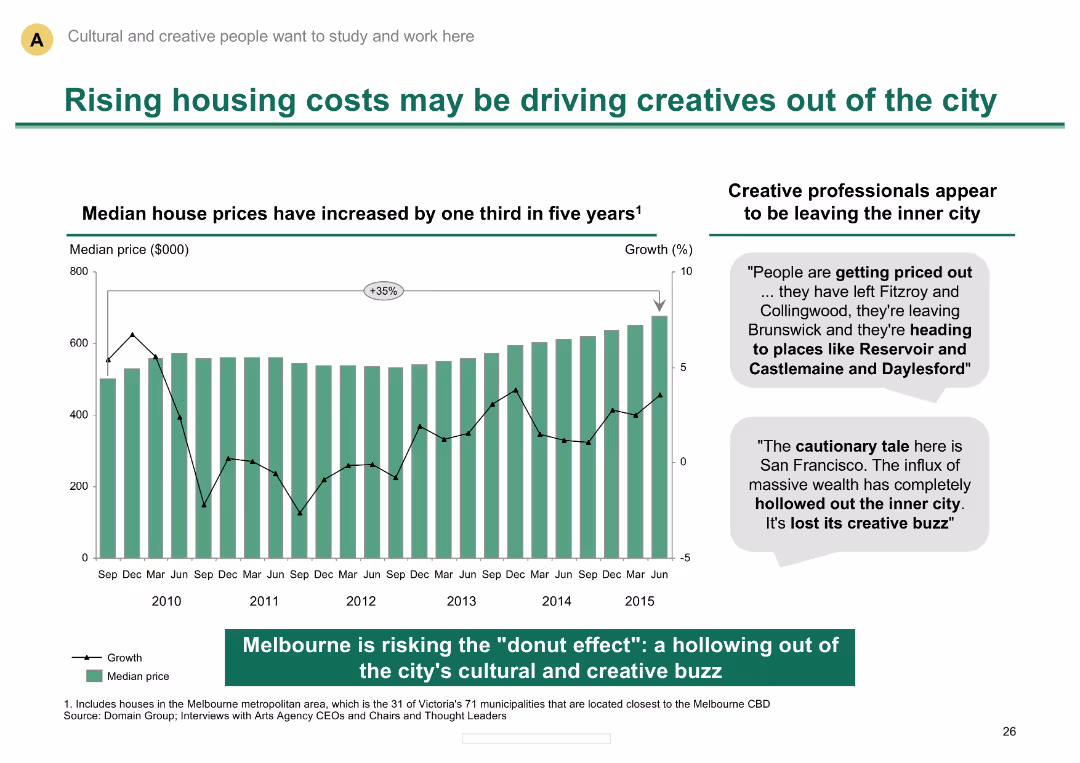
Column chart showing rise in median house prices; text describing impact on creative professionals
Market Analysis and Trends
Real Estate & Construction
Discusses the impact of rising housing costs on creative professionals in Melbourne, highlighting migration trends
Housing costs, creative professionals, real estate trends, Melbourne, urban migration, median house prices
Mixed Chart
BCG
Saved
A dual-axis chart showing semiconductor supply shortages and price pressures from Jan 2019 to Jan 2023, indicating supply and price trends.
Risk Assessment and Management
Technology & Software
The slide highlights the easing but still elevated semiconductor supply and price pressures, with insights into inventory improvements.
semiconductor, supply chain, price pressures, technology, risk management, inventory
Mixed Chart
Accenture
Saved
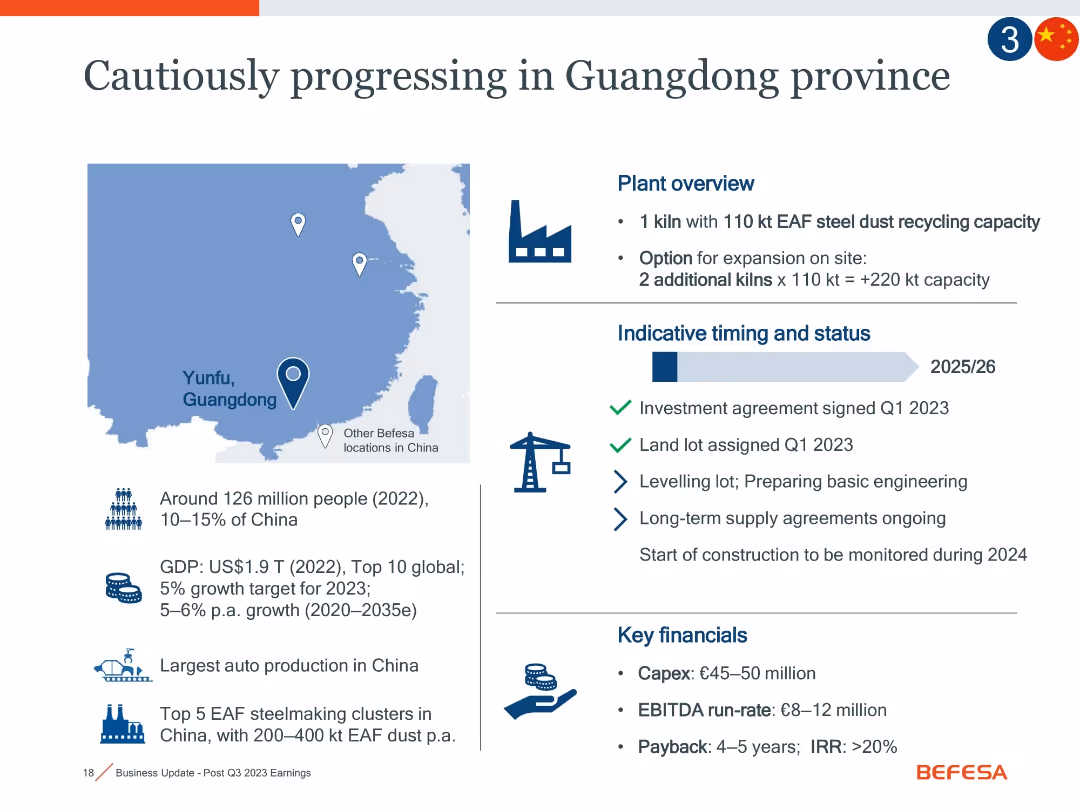
Left map with text on demographics, right section on plant overview and timing, plus bottom right financial metrics.
Strategic Planning
Industrial & Manufacturing
The slide discusses a new steel dust recycling plant in Yunfu, Guangdong, China. It outlines the strategic importance, growth potential of the region, and phased investment. Expected Capex is €45–50m with EBITDA of €8–12m. Timeline extends to 2025/26.
Guangdong, China, steel dust, EAF, Capex, recycling, market potential
Mixed Chart
Goldman Sachs
Saved
Contains lists and icons to depict workforce trends on the left and their implications on the right, with emphasis on career length, generational shifts, and skill relevancy.
Technology and Digital Transformation
Professional Services
Explores future workforce trends, including the predominance of millennials and changing skill requirements, and the subsequent implications for organizations.
workforce trends, millennials, skill requirements, organizational implications, future planning
Framework
Deloitte
Saved
Includes a column chart for ASEAN-6 y/y CPI (2023-2025F), a line chart for unemployment and real earnings growth rate (2016-2025F), and a bar chart for total trade.
Market Analysis and Trends
Financial Services
Analyzes disinflation trends in ASEAN, economic risks, and central bank policies. Discusses inflation, earnings growth, and trade outlook.
Disinflation, ASEAN, CPI, Trade, Earnings
Multiple Chart
EY
Saved
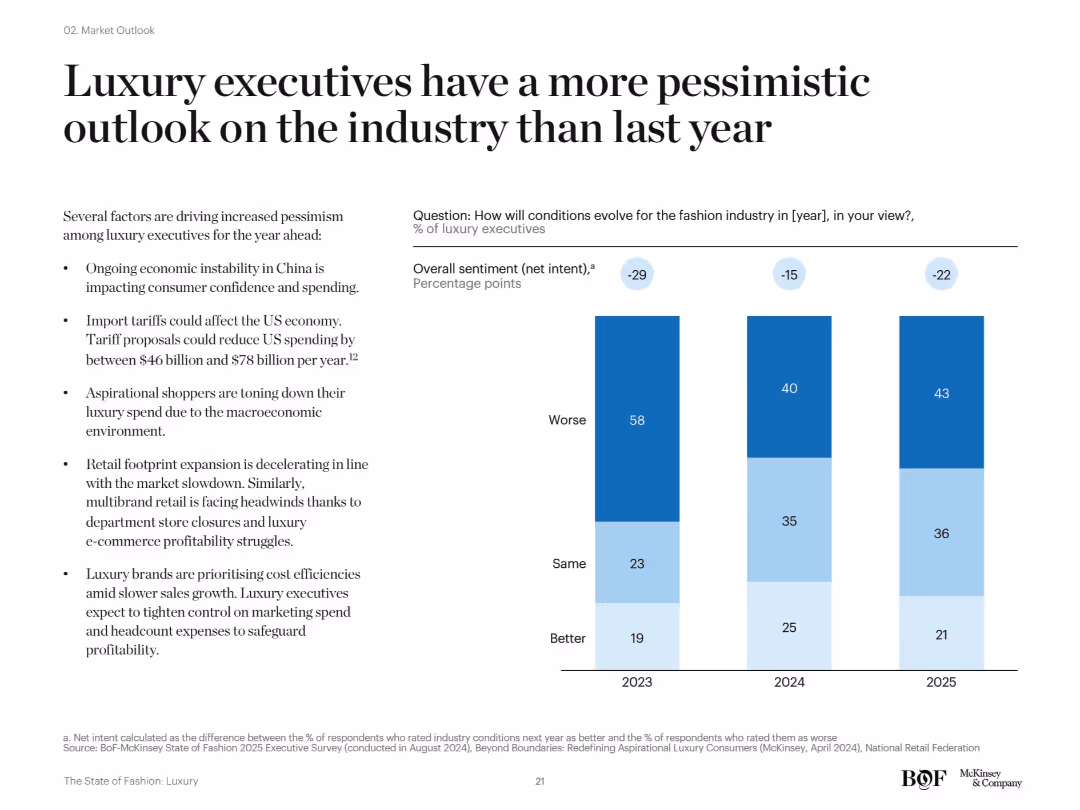
Bar chart showing net sentiment of luxury executives (better/same/worse) for 2023–2025. Accompanied by bullet points listing reasons for pessimism.
Strategic Planning
Consumer Goods
The slide illustrates declining optimism among luxury executives, with a majority expecting worse industry conditions in 2023–2025. Key concerns include macroeconomic headwinds, China’s instability, tariffs, and reduced spending from aspirational shoppers.
executive sentiment, pessimism, luxury outlook, 2024 forecast, tariffs, consumer behavior
Mixed Chart
McKinsey
Saved
Previous
Next
If nothing, comes up, please save your slides first
Create a FREE account to continue browsing
Receive Instant Access to 1,000+ slides from companies like McKinsey, Google, and Goldman Sachs
First Name
Last Name
Email
Password
I agree to all
Terms & Privacy Policy
Thank you! Your submission has been received!
Oops! Something went wrong while submitting the form.
Have an account?
Sign in
Column Chart
Heatmap
Chevron
Org Chart
Infographic
Callouts
Timeline
List
Graphic
Picture
Process Flow
Diagram
Paragraph
Map
Table
Framework
Subtitle
Takeaway Box
Icon
Other Chart
Radar Chart
Waterfall Chart
Mekko Chart
Pie Chart
Scatter Plot
Line Chart
Bar chart
Bullet points