My Account
My Slides
Search by Category
Templates
Leave Feedback
Login
Logout
Get Started
Browse all Slides
Browse all Slides
Create a FREE Account
Instant access to 1,000+ real slides from top companies like McKinsey, BCG, Goldman Sachs, Google and many more!
First Name
Last Name
Email
Password
I agree to all
Terms & Privacy Policy
Thank you! Your submission has been received!
Oops! Something went wrong while submitting the form.
Have an account?
Sign in
Saved Slides
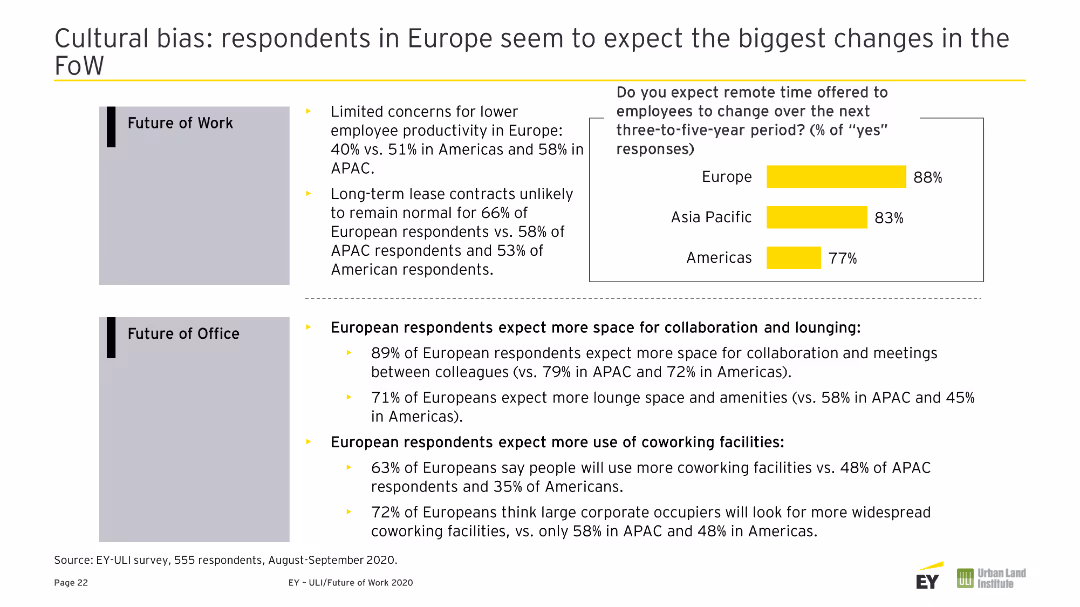
Includes text describing EY's operations in real estate, with a diagram in the center highlighting key areas of transformation. Right side contains EY viewpoints in a list format.
Industry Overview
Real Estate & Construction
Overview of EY’s involvement in real estate, hospitality, and construction sectors, with a focus on future transformation areas.
EY, Real Estate, Hospitality, Construction, Overview, Transformation, Industry, Operations, Viewpoints
Mixed Chart
EY
Saved
A comparative analysis layout showing potential profit losses for Asian and Chinese BEV manufacturers under different market scenarios. Utilizes color coding for clarity.
Risk Assessment and Management
Transportation & Logistics
Focuses on the challenges facing Asian and Chinese manufacturers in the BEV market, detailing the risk of significant profit losses under slow electrification scenarios and potential gains in more favorable conditions.
BEV, Asian OEMs, Chinese OEMs, profit loss, risks
Table
BCG
Saved
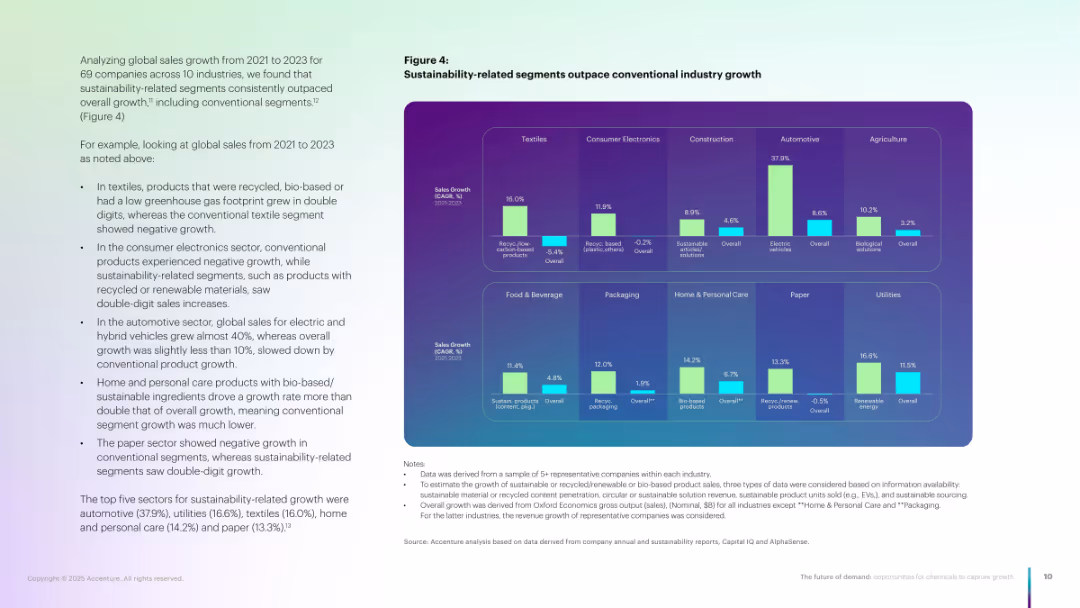
Grid-style chart with 10 industry segments; each has dual bars (sustainable vs. overall).
Market Analysis and Trends
Environmental Services & Sustainability
Compares growth of sustainable vs. conventional products across ten industries. Shows double-digit growth in sustainable segments in textiles, auto, HPC, etc., with overall demand lagging behind.
Sustainability, industry growth, recycled products, bio-based, segments
Multiple Chart
Accenture
Saved
This slide uses a bar graph to show the distribution of applications across various sectors like Agriculture, ICT, and Education, alongside a pie chart depicting the business stage (e.g., Idea, Growth) of these applications.
Market Analysis and Trends
Technology & Software
Analyzing the sector distribution and business stage of applications, this slide highlights the predominance of sectors like Agriculture and ICT and shows the maturity stages of these business ideas.
Sector Distribution, Applications, Agriculture, ICT, Education, Business Stage, Analysis, Maturity, Predominance
Multiple Chart
Accenture
Saved
Features maps and bar graphs depicting the distribution of mobile and fixed broadband access across Indonesia's districts and provinces.
Strategic Planning
Telecommunications
Addresses the uneven distribution of broadband connectivity in Indonesia, particularly the lack of mobile signal and low fixed broadband penetration in many areas.
broadband, Indonesia, mobile signal, fixed broadband, connectivity, provinces, districts
Graphic
BCG
Saved
This slide features a line chart with annotations for specific years and acquisitions, a sidebar with bullet points emphasizing revenue growth, and a company logo. The color scheme is blue, green, and black on a white background. The chart is the central visual element, with textual information in the sidebar presented in a clear, hierarchical layout with the use of bold fonts and contrasting colors.
Financial Performance
Industrial & Manufacturing
The slide illustrates the company's economic revenue growth over the years, highlighting significant acquisitions. The sidebar emphasizes a nine-fold increase in revenue since 2000, with equal contributions from organic growth and mergers and acquisitions. It appears to be used for showcasing the company's financial growth trajectory and strategic acquisitions to stakeholders or investors.
Growth, Acquisitions, Revenue, Organic, M&A, Economic, Line Chart, Annotations, Industrial, Strategic
Single Chart
Goldman Sachs
Saved
Contains two overlapping line graphs tracking the rate changes over time, complemented by a column chart for annual data. The layout is clean with a clear title.
Market Analysis and Trends
Financial Services
Evaluates insurance rate trends over an extended period, highlighting shifts in the market, with a focus on the direct Energy sector. Provides historical data to assess market conditions.
historical data, insurance rates, market analysis, energy sector, trends
Mixed Chart
PwC/Strategy&
Saved
The slide contains multiple pie charts showing the division of advertising revenues between digital and non-digital formats for Asia Pacific (excluding Mainland China), Mainland China, and Hong Kong from 2016 and projecting to 2025. It includes percentages and a color-coded system to distinguish between digital and non-digital revenues, alongside text boxes summarizing key insights.
Market Analysis and Trends
Media & Entertainment
Analyzes the transition in advertising revenue streams from non-digital to digital formats in Hong Kong versus other regions. It highlights that despite the shift towards digital, non-digital advertising still dominates Hong Kong's market, contrary to the faster digital adoption seen in Mainland China and the broader Asia Pacific region. The slide discusses factors influencing these trends, such as technological adoption and market maturity.
digital, non-digital, advertising, Hong Kong, Asia Pacific, 2025, revenue shares
Multiple Chart
PwC/Strategy&
Saved
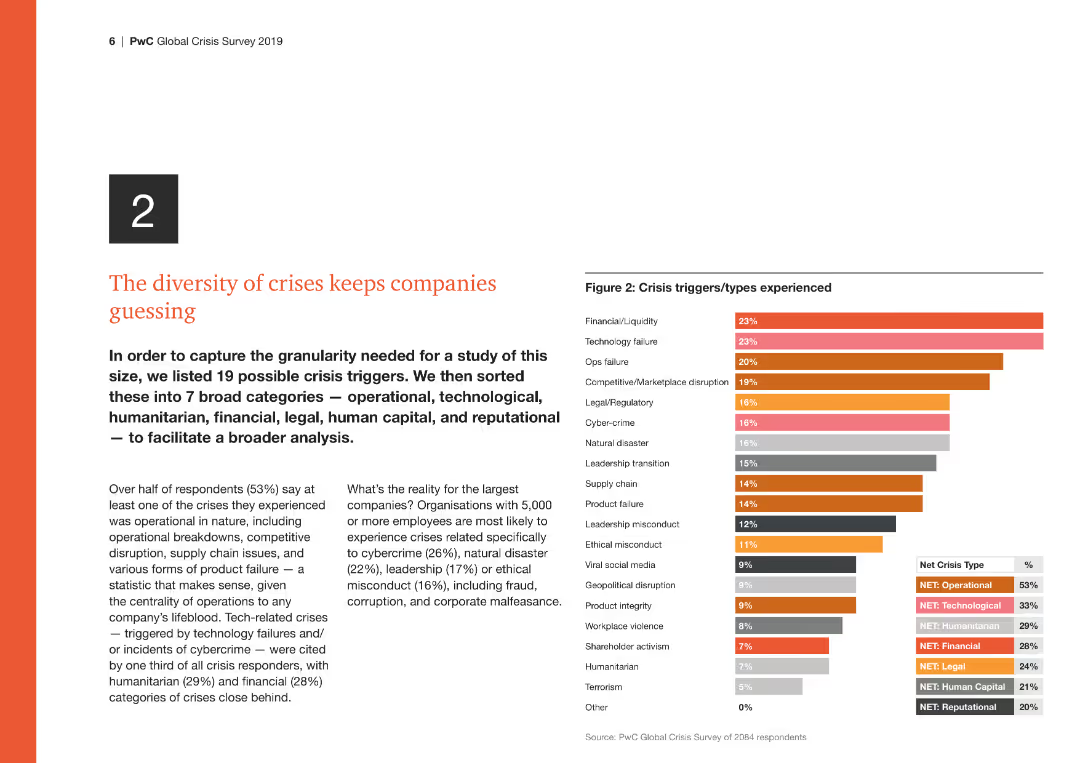
The slide includes a column chart on the right side showing different crisis triggers/types experienced, with financial/liquidity and technology failure at the top.
Risk Assessment and Management
Financial Services
This slide lists 19 possible crisis triggers categorized into seven broad categories for comprehensive analysis, highlighting the importance of diverse crisis preparedness.
Crisis triggers, financial, operational, technology, human capital, reputational
Mixed Chart
PwC/Strategy&
Saved
Dominated by green hues, this slide details the concept of systemic resilience across a multi-point list.
Organizational Structure and Change
Professional Services
It provides a deep dive into building resilience, with six points explaining the approach, including seeking advantage in adversity and valuing diversity.
resilience, collaboration, performance, diversity, change, advantage
Boxed
BCG
Saved
Left page includes a textual analysis with bullet points, while the right page features a vertical bar chart with percentages comparing perceptions among tech companies and the total sample.
Strategic Planning
Government & Public Sector
Discusses how Greece can enhance its image as a destination for investment, focusing on technology and innovation, with supporting survey data.
Greece, investment, technology, innovation, strategic image
Mixed Chart
EY
Saved
A column chart representing annual revenue from FY 2019 to FY 2022, with future projections. The design is simple and uses shades of blue.
Financial Performance
Financial Services
Analysis of Deutsche Bank's revenue growth over four years, highlighting exceeded expectations and future revenue goals.
Revenue, performance, growth, Deutsche Bank, financial, projections, analysis, FY
Mixed Chart
Deutsche Bank
Saved
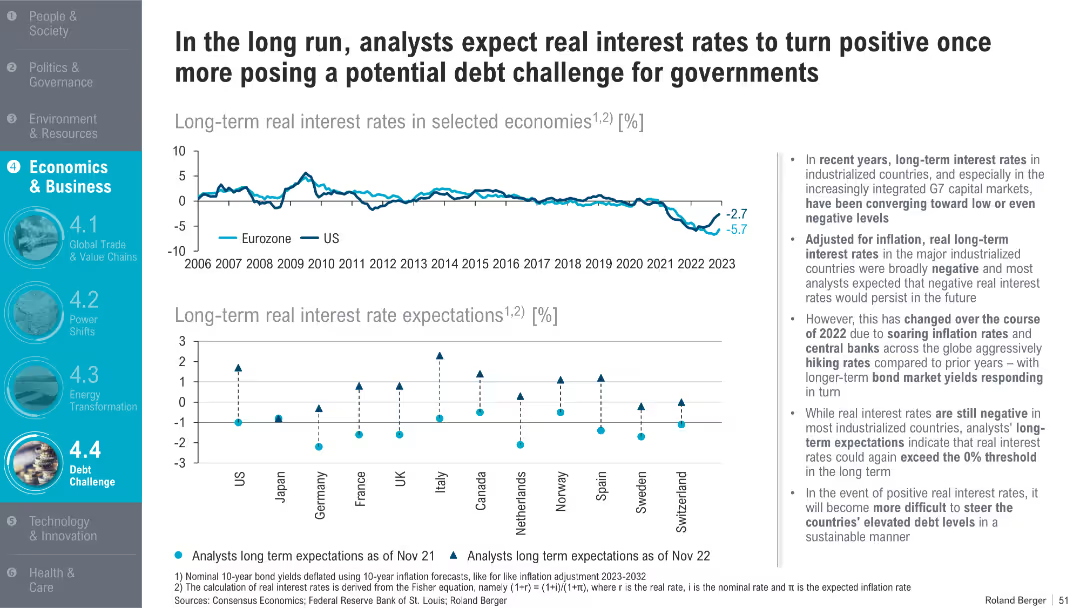
Two-part chart: top shows long-term real interest rates for Eurozone & US; bottom visualizes expectations for major economies; right panel provides analysis
Financial Performance
Government & Public Sector
This slide outlines the shift in real interest rate expectations following inflationary pressures and central bank interventions in 2022. It discusses the implications for managing public debt under higher real rates.
real interest rates, inflation, central banks, public debt, monetary policy, forecasts, G7, long-term yields
Multiple Chart
Roland Berger
Saved
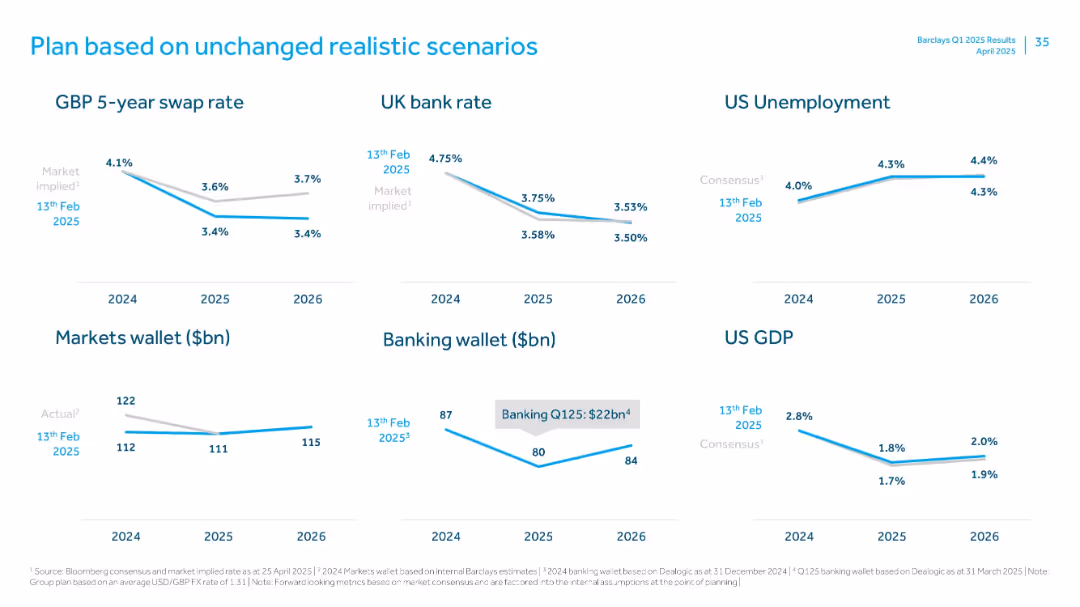
Six mini-line charts with macroeconomic forecasts and market estimates (2024–2026)
Strategic Planning
Financial Services
Displays economic assumptions behind Barclays' planning, including interest rates, unemployment, GDP, and market wallets. Emphasizes a stable outlook with moderate adjustments in macro indicators through 2026.
forecasts, interest rate, GDP, unemployment, wallet size
Single Chart
Barclays
Saved
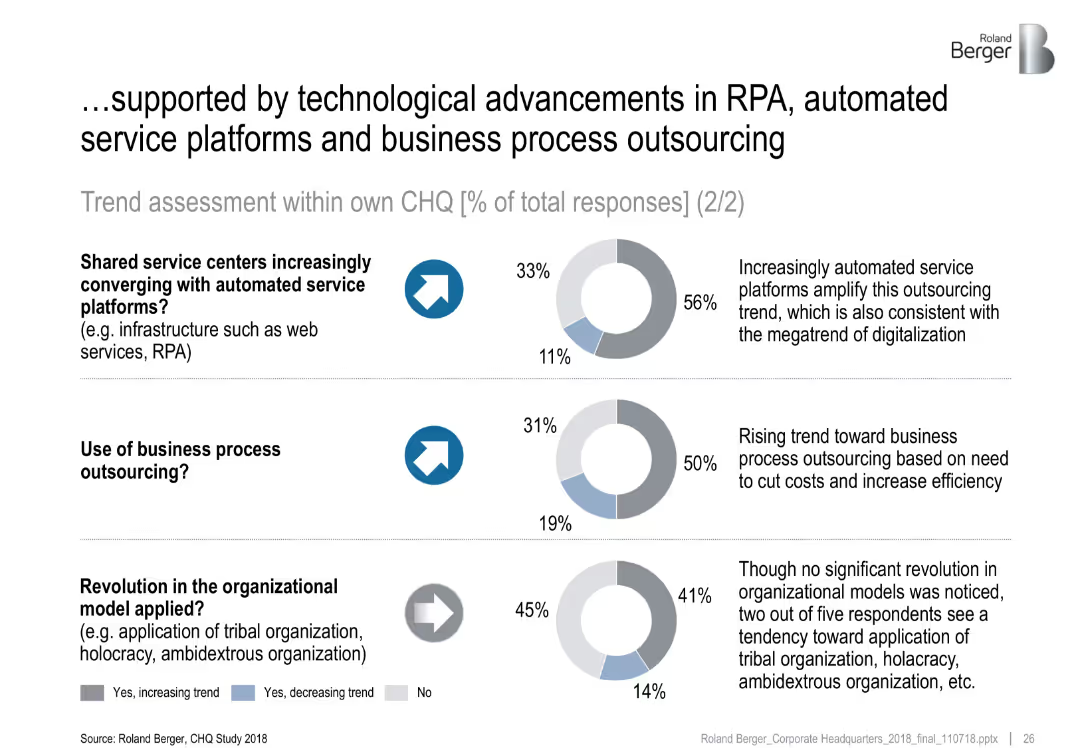
Three horizontal sections, each with donut charts showing trend data. Icons and arrows indicate direction of trend. Right-side annotations provide interpretation of each trend.
Technology and Digital Transformation
Professional Services
This slide presents data from a CHQ study highlighting how technological advancements—especially in RPA and automated platforms—are driving convergence in shared services, increasing outsourcing, and influencing organizational models. Most respondents observe growing trends in shared services and BPO.
RPA, shared services, business process outsourcing, automation, digitalization, CHQ, trend analysis, organizational models
Multiple Chart
Roland Berger
Saved
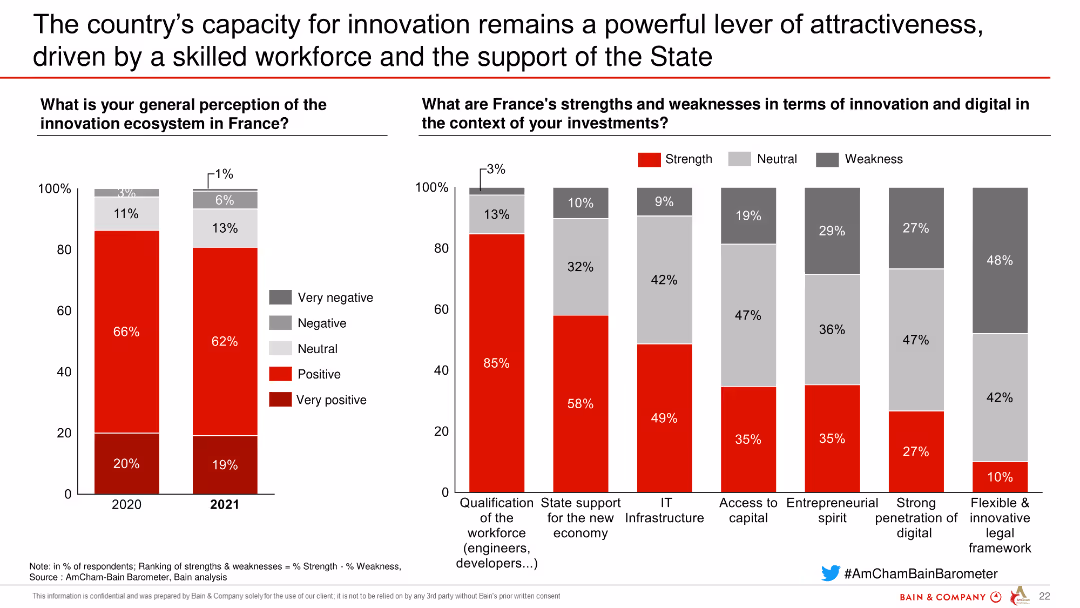
This slide has column charts comparing perceptions of the innovation ecosystem in France and analyzing strengths and weaknesses in innovation and digital terms for investments.
Market Analysis and Trends
Technology & Software
The slide evaluates perceptions of the innovation ecosystem in France and highlights strengths and weaknesses in terms of innovation and digital factors affecting investments.
innovation, ecosystem, France, strengths, weaknesses, digital, investments, technology, software
Multiple Chart
Bain
Saved
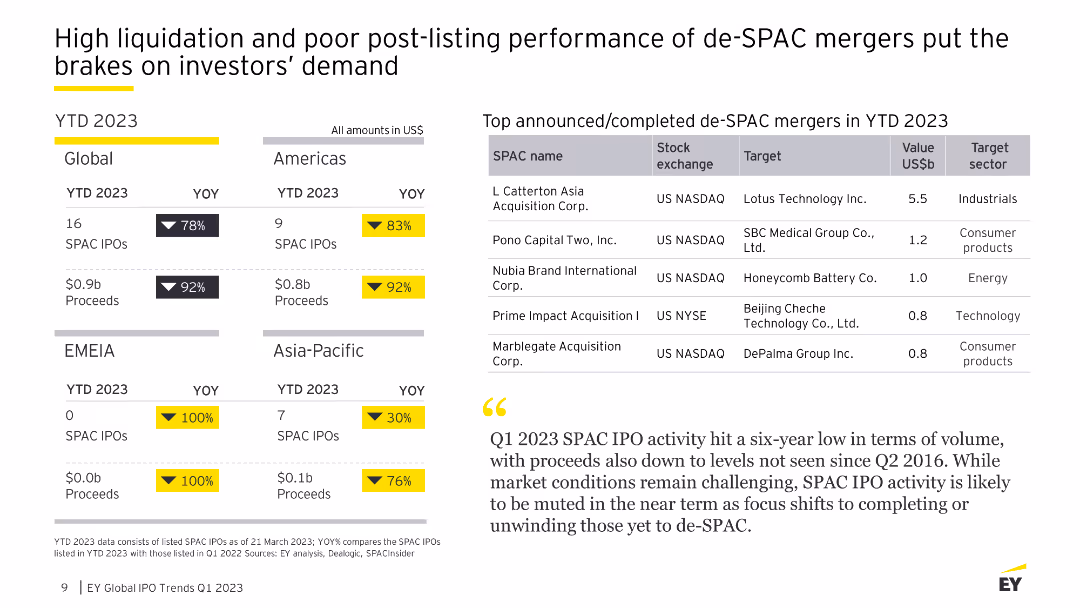
Features multiple graphs including a line chart showing SPAC IPO trends and column charts for de-SPAC mergers and post-merger performance for YTD 2023.
Market Analysis and Trends
Financial Services
The slide discusses the decline in SPAC IPOs and de-SPAC mergers, highlighting high liquidation rates and poor post-merger stock performance.
SPAC IPOs, de-SPAC mergers, YTD 2023, liquidation, market trends, financial services, column charts, line chart
Table
EY
Saved
Slide includes multiple column charts and bullet points comparing various financial metrics like revenue CAGR, CIR development, RoTE development, and CET1 ratio across different quarters.
Performance Metrics and KPIs
Financial Services
This slide presents key performance indicators for a bank, highlighting trends in revenue, costs, returns on equity, and capital ratios, essential for financial analysis and strategic planning.
Revenue, CIR, RoTE, CET1, financial analysis
Multiple Chart
Deutsche Bank
Saved
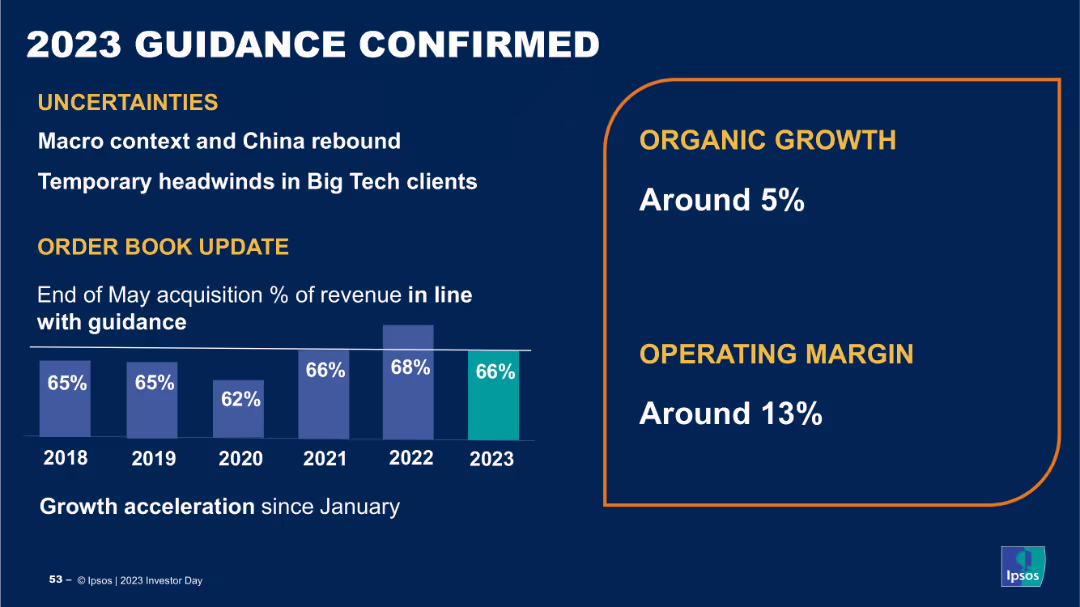
The slide contains a column chart showing percentage of revenue over years from 2018 to 2023, and a section with growth and operating margin percentages. The layout is structured and uses clear data visualizations.
Strategic Planning
Financial Services
The slide confirms Ipsos' 2023 guidance, highlighting uncertainties, organic growth, and operating margin targets, providing an update on order book and revenue projections, indicating stability and future growth prospects.
guidance, revenue, growth, operating margin, projections
Mixed Chart
IPSOS
Saved
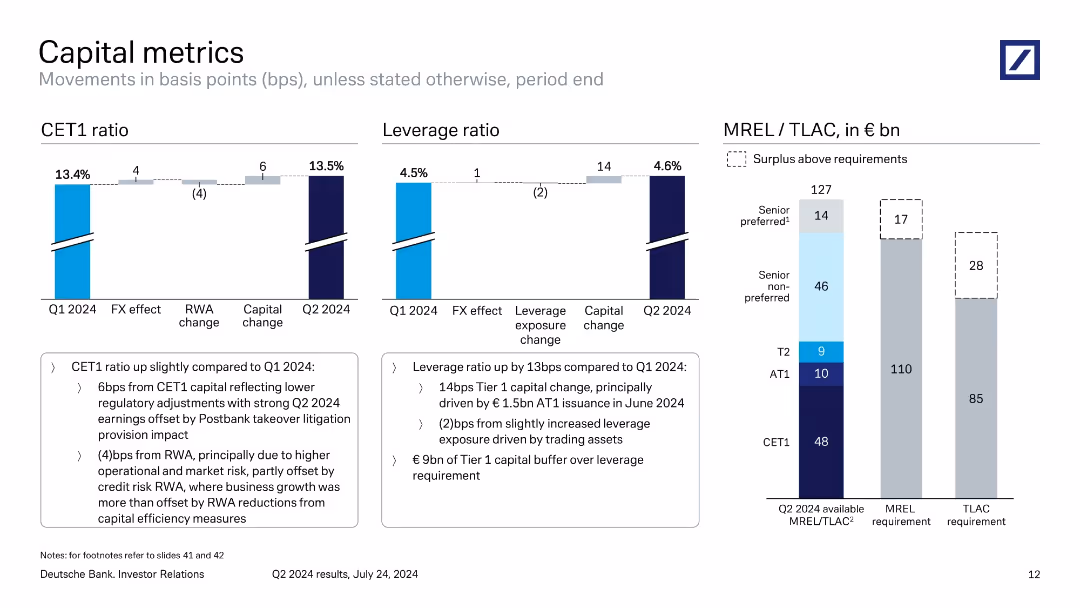
Three-panel chart layout for CET1 ratio, leverage ratio, and MREL/TLAC with supporting commentary.
Regulatory and Compliance
Financial Services
Summarizes capital adequacy and regulatory ratios as of Q2 2024. The CET1 and leverage ratios improved, driven by capital changes. MREL/TLAC status shows a surplus above requirements, reinforcing financial strength amid regulatory requirements.
CET1, leverage ratio, MREL, TLAC, regulatory capital, surplus, Deutsche Bank
Multiple Chart
Deutsche Bank
Saved
The slide includes a column chart on the left showing the number of Earths required to meet ecological demand sustainably, and a bar chart on the right showing US sales growth.
Market Analysis and Trends
Environmental Services & Sustainability
It highlights the sustainability concerns by showing the ecological footprint and the growth rate of US sales for products with and without ESG claims.
ecological footprint, sustainability, ESG, sales growth, US market, consumer concerns, environmental impact, resource consumption, J.P. Morgan, global footprint
Multiple Chart
JP Morgan
Saved
Slide features three overlapping circles in blue, green, and grey, labeled Work, People, and Technology. Within the intersection of all three is a central question about harnessing insights for performance.
Risk Assessment and Management
Technology & Software
Discusses the interplay between work, people, and technology, and how to harness insights to drive performance. Ideal for discussions on managing disruption and leveraging insights in business.
Disruption, Insights, Performance, Technology
Diagram
Deloitte
Saved
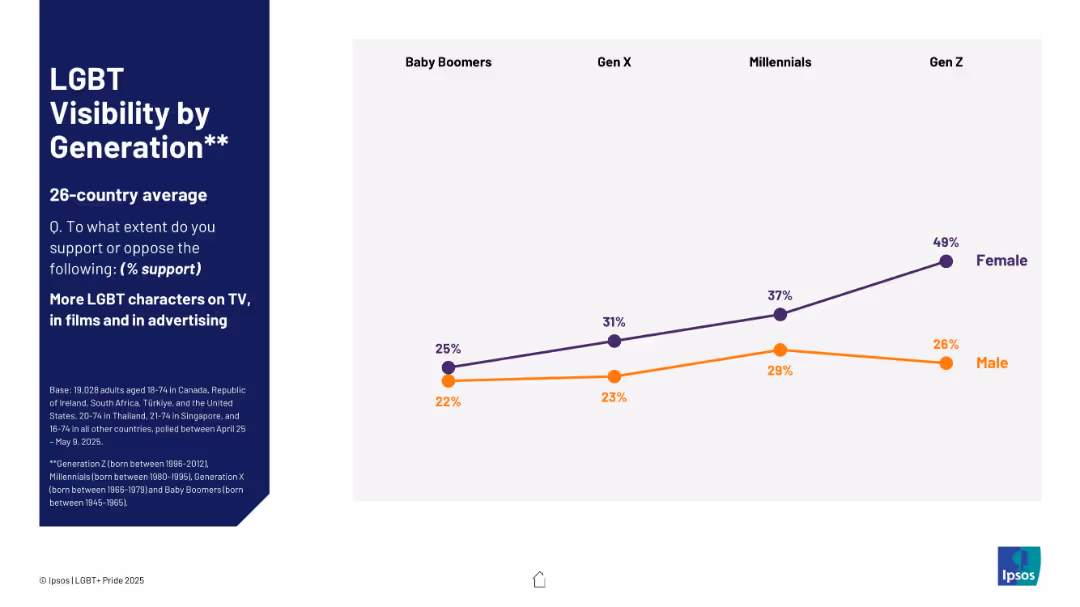
Similar layout as 19721; right side features a line chart split by gender across generations.
Market Analysis and Trends
Government & Public Sector
This slide tracks generational trends in supporting LGBT representation in media, noting that Gen Z women are significantly more supportive than their male counterparts.
support, TV, advertising, LGBT, generations, gender difference, Gen Z, Ipsos
Mixed Chart
IPSOS
Saved
Features column charts comparing the proportion of women in managerial positions across various regions and time periods, presented with clear labels and contrasting colors for easy comparison.
Market Analysis and Trends
Professional Services
Highlights the slow progress and continuing challenges in achieving gender parity in managerial roles globally, providing a basis for discussions on gender equity in professional settings.
gender equality, managerial roles, global, trends, workplace, diversity, equity, data, analysis
Mixed Chart
Roland Berger
Saved
The slide features four maturity curves comparing conditioning, pretreatment, conversion technologies, and biofuels maturity levels. Each curve shows the progression from research to mature technology, highlighting key processes and technologies at different maturity stages.
Technology and Digital Transformation
Energy & Utilities
This slide illustrates the maturity levels of various bioenergy technologies, including conditioning, pretreatment, conversion, and biofuels, showing their development stages from research to mature deployment.
maturity curve, conditioning technologies, pretreatment, conversion, biofuels, research, deployment, maturity levels
Multiple Chart
Kearney
Saved
Previous
Next
If nothing, comes up, please save your slides first
Create a FREE account to continue browsing
Receive Instant Access to 1,000+ slides from companies like McKinsey, Google, and Goldman Sachs
First Name
Last Name
Email
Password
I agree to all
Terms & Privacy Policy
Thank you! Your submission has been received!
Oops! Something went wrong while submitting the form.
Have an account?
Sign in
Column Chart
Heatmap
Chevron
Org Chart
Infographic
Callouts
Timeline
List
Graphic
Picture
Process Flow
Diagram
Paragraph
Map
Table
Framework
Subtitle
Takeaway Box
Icon
Other Chart
Radar Chart
Waterfall Chart
Mekko Chart
Pie Chart
Scatter Plot
Line Chart
Bar chart
Bullet points