My Account
My Slides
Search by Category
Templates
Leave Feedback
Login
Logout
Get Started
Browse all Slides
Browse all Slides
Create a FREE Account
Instant access to 1,000+ real slides from top companies like McKinsey, BCG, Goldman Sachs, Google and many more!
First Name
Last Name
Email
Password
I agree to all
Terms & Privacy Policy
Thank you! Your submission has been received!
Oops! Something went wrong while submitting the form.
Have an account?
Sign in
Saved Slides
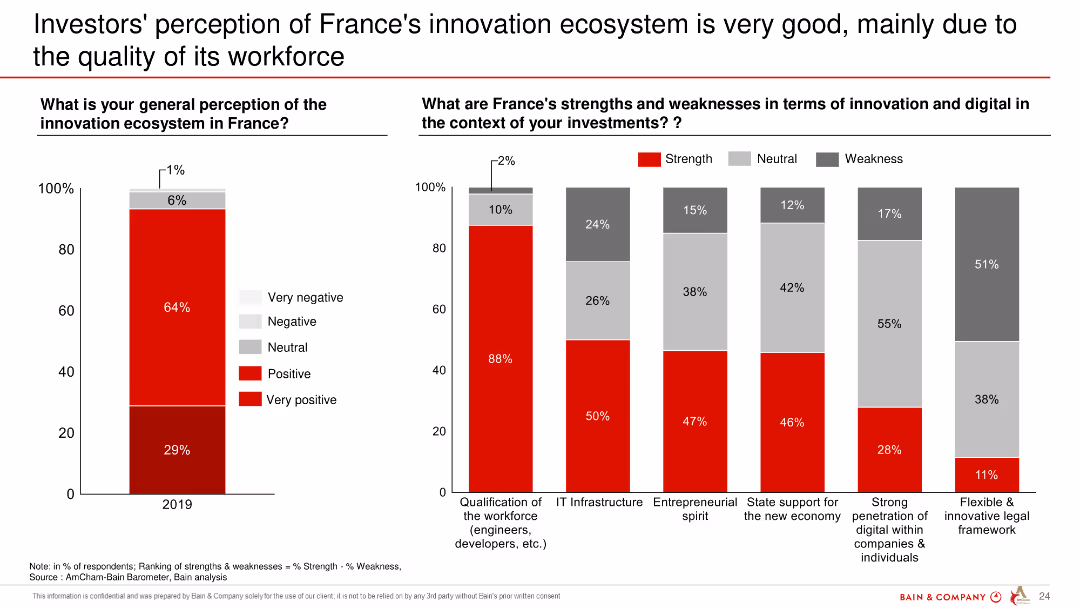
Column chart showing investors' general perception of the innovation ecosystem in France and its strengths and weaknesses in terms of innovation and digital.
Market Analysis and Trends
Professional Services
The slide evaluates investors' positive perception of France's innovation ecosystem, highlighting workforce quality as a key strength.
innovation ecosystem, workforce quality, perception, strengths, weaknesses, France
Multiple Chart
Bain
Saved
The slide includes a multi-line chart tracking the percentage deviation from the 2018-2019 trend for core goods and services price levels globally. It shows three lines representing goods, services, and the total, indicating various changes over the years 2018 through 2022.
Market Analysis and Trends
Financial Services
The slide analyzes the normalization of price levels for goods and services after pandemic-related adjustments, showing deviations from previous trends. It is intended for discussions on global economic recovery, inflation trends, and pricing strategies post-pandemic.
Price Levels, Pandemic, Global Economy, Goods, Services, Inflation Trends, Economic Recovery
Single Chart
JP Morgan
Saved
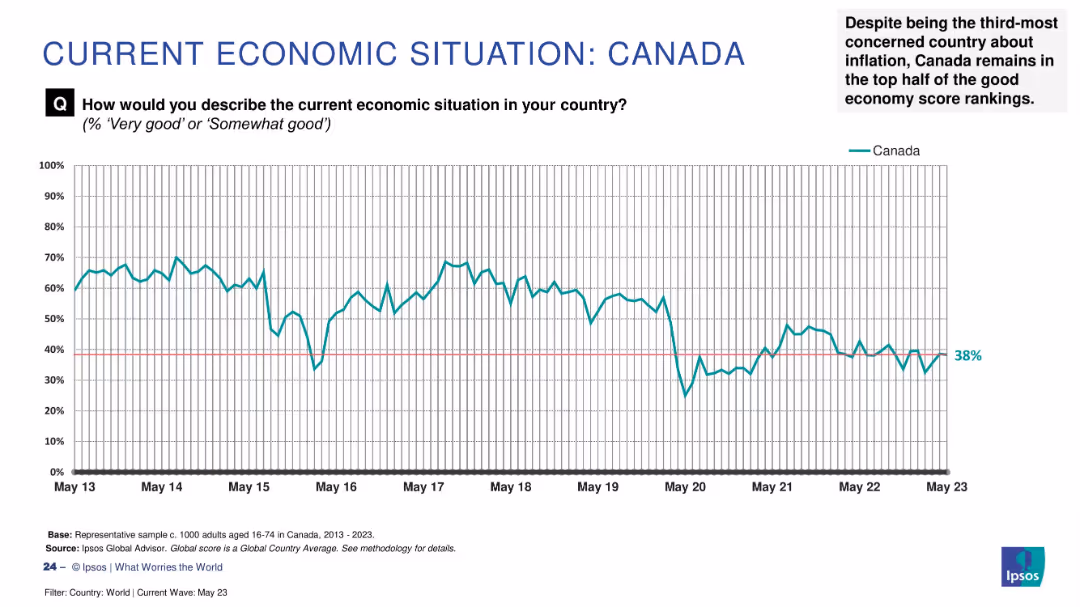
Line graph tracking Canada's economic sentiment (2013–2023); explanatory note in top right summarizes context.
Strategic Planning
Financial Services
Canada's “good economy” score stands at 38%, placing it in the upper half of the global ranking despite inflation concerns. The time-series chart shows fluctuations over the last decade, with a notable dip in May 2020. The narrative notes Canada’s resilience relative to other economies.
Canada, economic sentiment, Ipsos, inflation, public perception, resilience, global context, economic trend
Single Chart
IPSOS
Saved
Features a graph titled "Figure 7", a sidebar with additional text and headers, and a purple footer. The graph shows changes in skill importance over time.
Technology and Digital Transformation
Technology & Software
Highlights the evolving importance of various skills for science and engineering roles, implying a trend towards increasing value in creativity and social skills.
Skills Evolution, Science and Engineering, Data Analysis, Creativity, Social Skills
Single Chart
Accenture
Saved
The slide employs a flowchart design to illustrate treasury management solutions, paired with text descriptions and icons. The layout is clear and organized, allowing easy navigation through the content.
Product and Service Analysis
Financial Services
It breaks down how commercial banking provides differentiated treasury solutions, making it suitable for presentations aimed to inform about value-driven client services in treasury management.
treasury solutions, commercial banking, client value, service analysis, flowchart
Header Vertical
JP Morgan
Saved
Bar graph comparison between 'Today' and '2026' expectations of business agility, accompanied by a pie chart indicating industry goals for agility.
Market Analysis and Trends
Media & Entertainment
Details executive insights on the need for agility in business processes and systems, forecasting changes by 2026.
Agility, Business Processes, Executive Survey, Future Forecasting, Industry Goals, Respondent Views
Mixed Chart
Kearney
Saved
Features a hexagonal, honeycomb-like graphic with icons and bullet points describing eight significant trends in the high-tech industry.
Strategic Planning
Technology & Software
The slide illustrates key industry trends impacting the high-tech sector, such as AI integration and 5G solutions, indicating a shift in industry paradigms.
high-tech, trends, AI, 5G, industry paradigm, cloud computing, smart devices
Diagram
Accenture
Saved
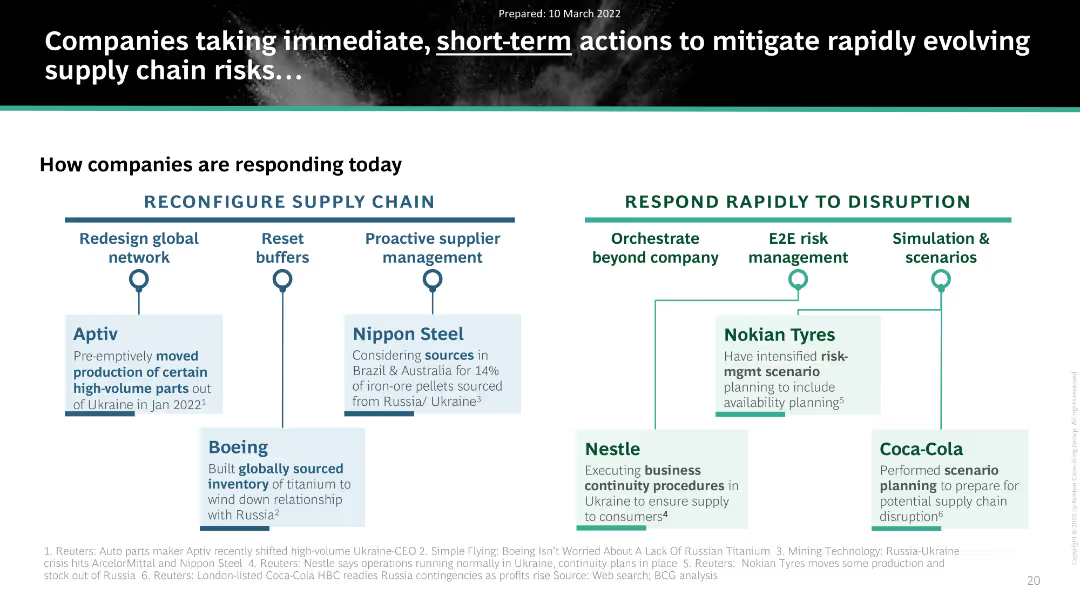
The slide lists actions by various companies in response to supply chain risks, using a two-column format with icons.
Strategic Planning
Consumer Goods
The slide details how companies are mitigating supply chain risks by reconfiguring their supply chains and responding rapidly to disruptions.
Supply Chain, Risk Mitigation, Strategic Planning, Companies
Header Horizontal
BCG
Saved
Bar graph on the slide represents global capital spending as a percentage of GDP, with an increasing trend shown in different shades of blue. Annotations provide a year-by-year breakdown.
Investment Analysis
Environmental Services & Sustainability
Describes the front-loaded nature of investment in the net-zero transition, with spending rising to a peak percentage of global GDP by 2030 before reducing again. Indicates the importance of initial investment to facilitate long-term change.
Global GDP, Capital Spending, Net-Zero, Transition, Investment, 2030
Single Chart
McKinsey
Saved
Two-column layout with a bar chart showing operating expenses over time and text describing cost structure changes, including immediate exit rate savings and defragmentation strategies.
Operational Efficiency
Financial Services
This slide explains the cost structure transition from a federated to a centralized model, highlighting operating expense reductions and strategies for immediate savings and defragmentation.
cost, structure, transition, centralized, savings
Mixed Chart
Credit Suisse
Saved
The slide uses a detailed flowchart to demonstrate the stages of an impact thesis specific to nbn, with labeled sections and connections between them.
Organizational Structure and Change
Telecommunications
This slide describes how NBN Co uses the impact thesis model to guide its social impact efforts, detailing specific activities and expected outcomes.
impact thesis, NBN Co, social impact, activities, outcomes, model
Diagram
Accenture
Saved
Contains column charts and demographic breakdowns, showing the reporting and satisfaction rates of harassment incidents by gender and orientation among Gen Z and Millennials. The visual design aids in understanding disparities.
Market Analysis and Trends
Professional Services
Discusses the differences in harassment reporting and satisfaction with organizational responses among different gender and orientation groups within Gen Z and Millennials.
harassment, diversity, inclusion, Gen Z, Millennials, reporting rates, satisfaction
Multiple Chart
Deloitte
Saved
Features a vertical bar chart comparing potential business and societal impacts with a detailed legend and value breakdowns. Visual elements are well-organized for clear data presentation.
Market Analysis and Trends
Telecommunications
Analyzes the potential $2 trillion value from digitalization in telecommunications, detailing impacts on different digital themes and societal benefits.
Telecommunications, Digitalization, Societal Impact, Business Value, Emissions Reduction
Mixed Chart
Accenture
Saved
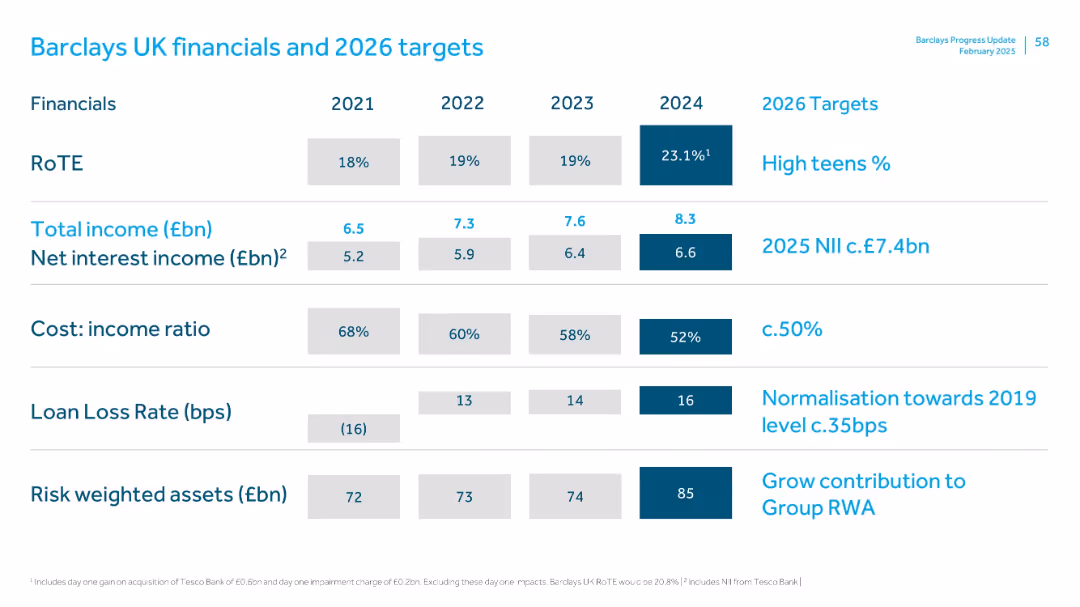
Table format comparing 2021–2024 historical data and 2026 forward targets for KPIs like RoTE, income, cost ratio, and loan loss rates.
Financial Performance
Financial Services
Shows historical and forecasted financials for Barclays UK, including a spike in RoTE (23.1% in 2024), cost ratio improvements, and RWA growth. Lays out performance targets including £7.4bn NII for 2025 and ~50% CIR by 2026.
Barclays UK, financial targets, RoTE, NII, CIR, loan loss, income forecast
Single Chart
Barclays
Saved
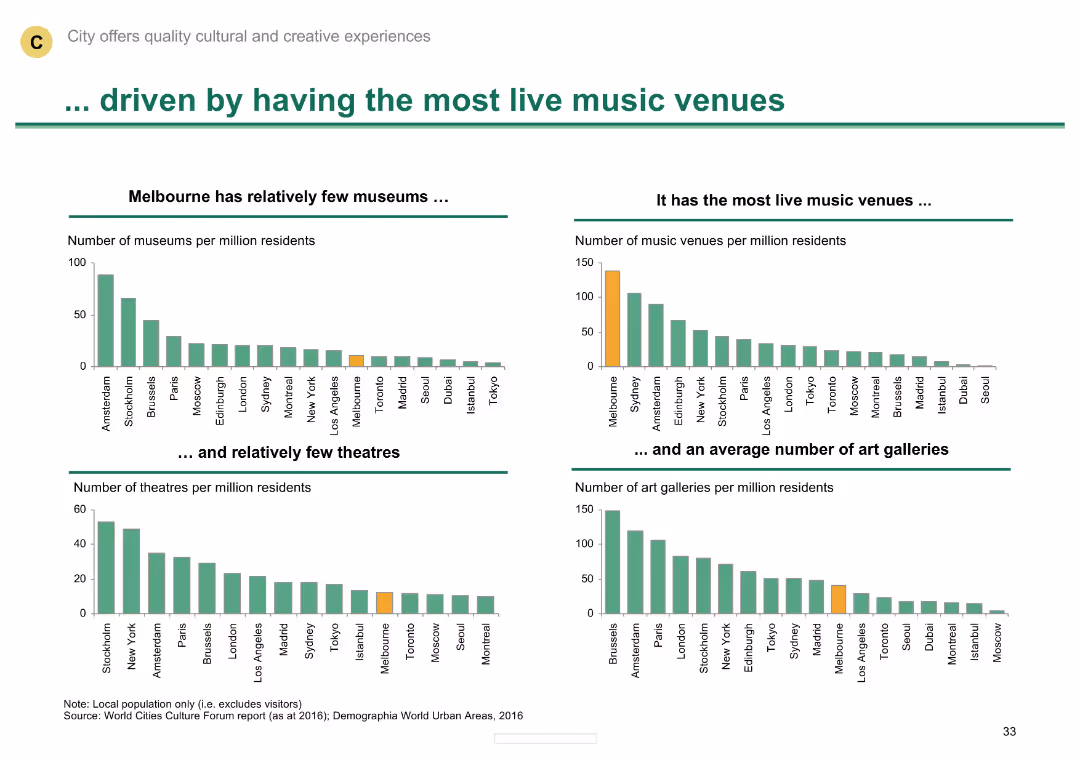
Multiple column charts comparing the number of museums, music venues, theatres, and art galleries
Market Analysis and Trends
Media & Entertainment
Shows Melbourne's leadership in live music venues and its relatively average number of theatres and galleries.
Live music venues, museums, theatres, art galleries, Melbourne
Multiple Chart
BCG
Saved
Slide contains column charts, and images. It has a dense layout with graphical data.
Financial Performance
Financial Services
Discusses Spain's banking activity, loan loss provisions, and focus on cost control in a low-interest-rate environment.
Banking, provisions, P&L, cost, interest
Multiple Chart
Morgan Stanley
Saved
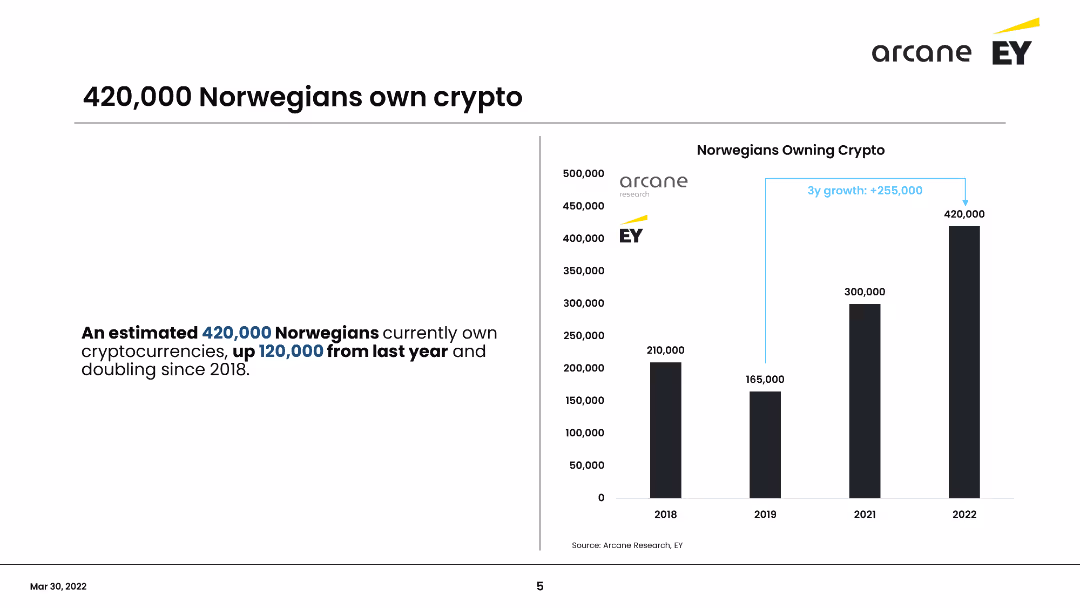
This slide includes a column chart showing the number of Norwegians owning cryptocurrency from 2018 to 2022. It emphasizes the growth in crypto ownership, with an increase of 120,000 owners from the previous year, totaling 420,000 in 2022.
Market Analysis and Trends
Financial Services
Shows the significant increase in cryptocurrency ownership among Norwegians, doubling since 2018 to 420,000 in 2022. Highlights the annual growth and demographic changes, focusing on the increase from the previous year.
Cryptocurrency, Norway, Growth, Ownership, Trends
Mixed Chart
EY
Saved
This slide includes a series of heatmaps detailing credit risk indicators and distressed company percentages across various sectors.
Risk Assessment and Management
Financial Services
Presents credit risk data and company distress levels across multiple sectors, providing insights into the economic impact and risk assessment by sector.
credit risk, sectors, distress levels, economic impact, heatmap
Table
BCG
Saved
Timeline and bar chart showing the increase in V2V equipped vehicle models from 2017 to 2020, with a significant rise in models and geographical expansion.
Product and Service Analysis
Transportation & Logistics
Examines the growth of vehicle-to-vehicle (V2V) technology in the automotive market, highlighting the increase in models and the expansion into new regions.
V2V technology, commercialization, automotive, 2020
Graphic
Roland Berger
Saved
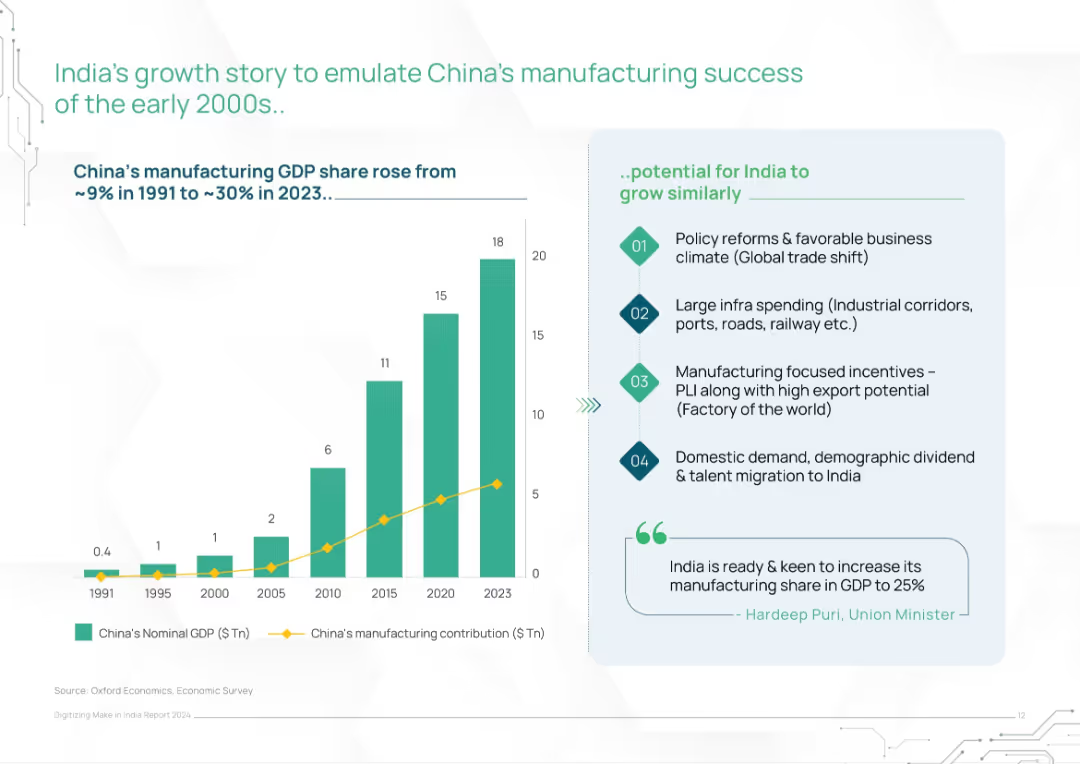
Left bar and line chart showing China’s GDP and manufacturing growth; right panel lists India’s policy and economic enablers
Strategic Planning
Industrial & Manufacturing
This slide draws parallels between China’s early 2000s manufacturing rise and India’s current opportunity. It outlines India’s potential to grow similarly via policy reforms, infrastructure investment, export incentives, and demographic trends, supported by charts and government commentary.
manufacturing growth, China comparison, India strategy, economic reform, industrial policy, infrastructure push, PLI
Mixed Chart
BCG
Saved
Column chart showing changes in operating expenses from 9M21 to 9M22 with text explanations of cost factors.
Financial Performance
Financial Services
Highlights the operating expenses over a period, detailing components like FX, litigation, and variable compensation.
Operating expenses, FX, litigation, variable compensation, 9M22, cost strategy, financial performance, UBS
Mixed Chart
UBS
Saved
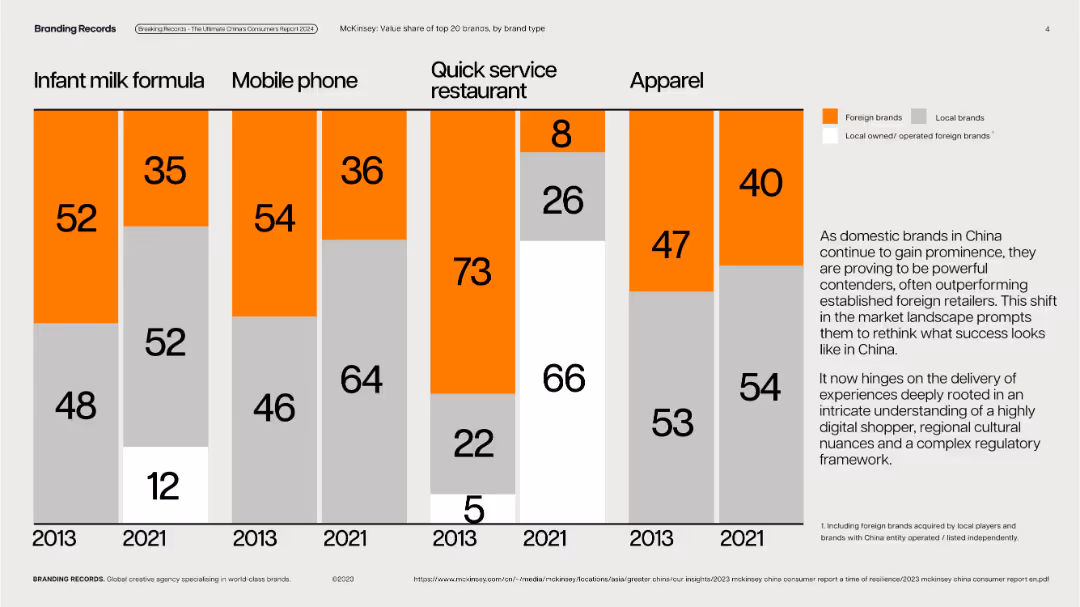
Vertical stacked bar charts with year-over-year brand type breakdowns by category; clean, grid layout.
Competitive Landscape
Consumer Goods
Displays value share of top 20 brands (foreign vs. local) in five product categories across 2013 and 2021, illustrating the growing prominence of local Chinese brands across sectors like mobile, apparel, and quick service restaurants.
local brands, market share, consumer goods, competition, China, brand shift
Mixed Chart
McKinsey
Saved
Consists of pie charts and small text sections describing credit allocation and exposure in consumer and corporate segments.
Risk Assessment and Management
Financial Services
Provides an overview of credit distribution and risk across consumer and corporate sectors, highlighting key credit metrics like EOP loans and reserves ratio. Essential for understanding risk management and financial stability.
Credit, Consumer, Corporate, Risk Management, Overview
Multiple Chart
Citigroup
Saved
The slide includes a pie chart showing the distribution of loans and multiple annotations describing different loan types.
Financial Performance
Financial Services
The slide details the loan portfolio composition, highlighting key segments and growth or decline trends since 2014.
loan, portfolio, real estate, secured, credit, risk, financial, performance
Mixed Chart
UBS
Saved
Bar chart showing various savings goals among Canadians pre-COVID-19. Bars indicate the percentage of respondents with 'Yes', 'No', and 'Not applicable' responses for each savings goal. Dense text at the top explains the context.
Market Analysis and Trends
Financial Services
The slide presents data on the savings goals of Canadian investors before COVID-19, highlighting the percentage contributing to goals such as retirement, travel, and education. It notes gender differences and the high proportion of younger investors saving for these goals.
Savings, Goals, Canadians, Retirement, Travel, Education
Mixed Chart
IPSOS
Saved
Previous
Next
If nothing, comes up, please save your slides first
Create a FREE account to continue browsing
Receive Instant Access to 1,000+ slides from companies like McKinsey, Google, and Goldman Sachs
First Name
Last Name
Email
Password
I agree to all
Terms & Privacy Policy
Thank you! Your submission has been received!
Oops! Something went wrong while submitting the form.
Have an account?
Sign in
Column Chart
Heatmap
Chevron
Org Chart
Infographic
Callouts
Timeline
List
Graphic
Picture
Process Flow
Diagram
Paragraph
Map
Table
Framework
Subtitle
Takeaway Box
Icon
Other Chart
Radar Chart
Waterfall Chart
Mekko Chart
Pie Chart
Scatter Plot
Line Chart
Bar chart
Bullet points