My Account
My Slides
Search by Category
Templates
Leave Feedback
Login
Logout
Get Started
Browse all Slides
Browse all Slides
Create a FREE Account
Instant access to 1,000+ real slides from top companies like McKinsey, BCG, Goldman Sachs, Google and many more!
First Name
Last Name
Email
Password
I agree to all
Terms & Privacy Policy
Thank you! Your submission has been received!
Oops! Something went wrong while submitting the form.
Have an account?
Sign in
Saved Slides
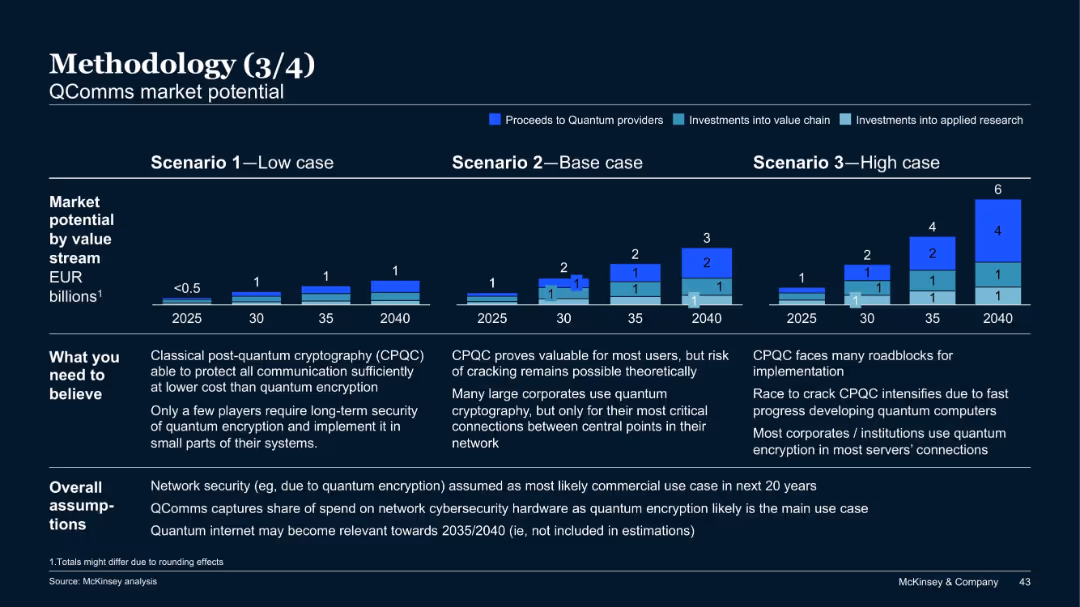
Scenario-based market projection; stacked bar charts for value streams; assumption and belief sections at bottom; muted colors and dark theme.
Investment Analysis
Artificial Intelligence
This slide outlines the potential value of quantum communications (QComms) by 2040. It compares low, base, and high-value projections and explores adoption assumptions and technological hurdles like cracking CPQC.
QComms, quantum encryption, cybersecurity, CPQC, projections, investments, McKinsey
Mixed Chart
McKinsey
Saved
Composed with a red and white color scheme, this slide shows two circle diagrams comparing net revenue and operating profit between 2016/2017 and 2017/2018. There are explanations of the data and details on the Advisory service line's growth and strategies.
Investment Analysis
Professional Services
Outlines the financial metrics and growth strategies of PwC's Advisory services, emphasizing areas such as financial services sector challenges and the integration of Strategy&. It serves to inform about areas of growth and strategic focus in consulting services.
advisory, financial services, Strategy&, growth, PwC
Multiple Chart
PwC/Strategy&
Saved
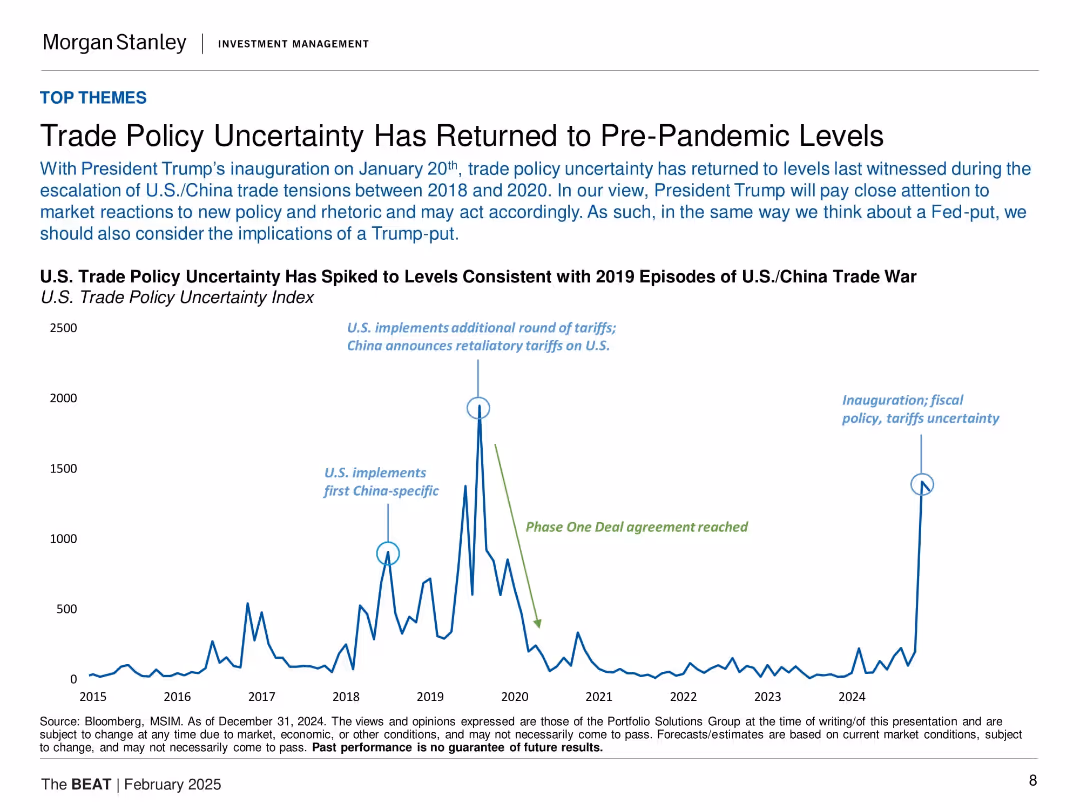
Time-series line chart (2015–2024) showing spikes in U.S. trade policy uncertainty with annotated historical events.
Risk Assessment and Management
Government & Public Sector
This slide discusses the sharp rise in U.S. trade policy uncertainty back to levels seen during the 2018–2020 U.S./China trade war. It attributes this to the inauguration of President Trump and renewed tariff-related concerns. The slide includes key events like tariff announcements and agreements, indicating a re-escalation in policy risks for investors and global markets.
trade policy, tariffs, Trump, uncertainty, U.S.-China, inauguration, risk, market volatility, economic policy
Single Chart
Morgan Stanley
Saved
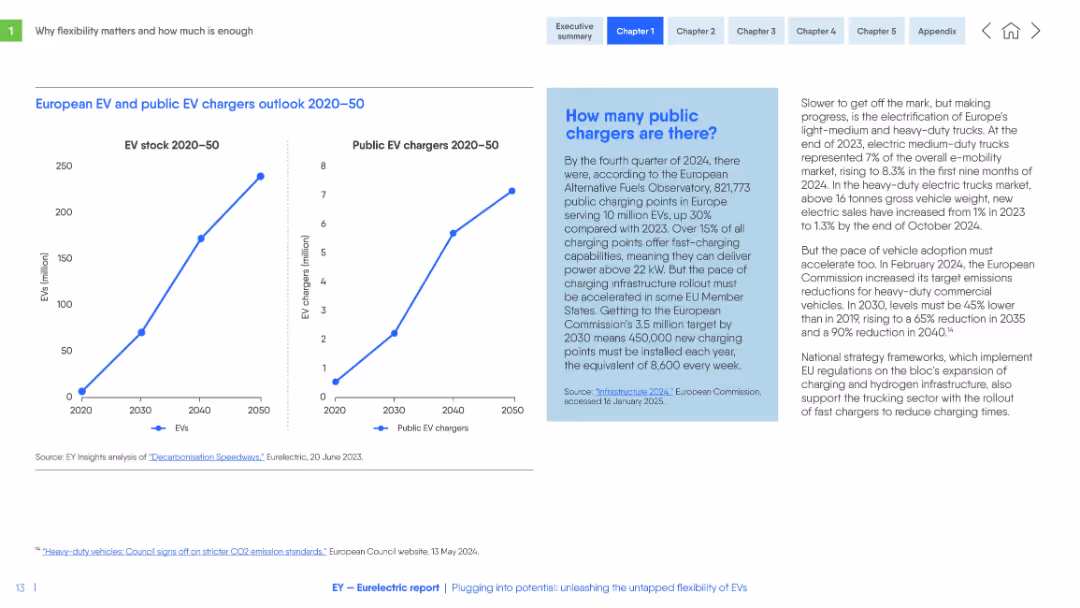
Dual-line graphs (EV stock and chargers 2020–2050), blue text box on public chargers, and right-aligned commentary on truck electrification.
Market Analysis and Trends
Energy & Utilities
The slide forecasts sharp growth in EV stock and public chargers across Europe from 2020 to 2050. It includes infrastructure data and calls for accelerated investment to meet EU targets. It also outlines challenges in electrifying heavy-duty vehicles.
EV adoption, chargers, infrastructure, electrification, EU targets, public policy, vehicle fleet
Multiple Chart
EY
Saved
The slide features three sections titled Respondent Access, Survey, and Analysis & Reporting, each with icons and brief descriptions. It uses a three-column layout with hexagonal shapes and company logos.
Technology and Digital Transformation
Technology & Software
The slide details the capabilities and benefits of an end-to-end proprietary platform, highlighting respondent access, survey capabilities, and analysis & reporting functionalities.
Proprietary, platform, survey, analysis, reporting, capabilities, respondent, access, AI, efficiency
Linear Flow
IPSOS
Saved
The slide features multiple horizontal bar charts detailing the impact of various factors on underwriters over the past 5-10 years. Each bar represents a different impact level (from negative to positive) with corresponding percentages. The bars are color-coded and labeled, providing clear visual differentiation.
Risk Assessment and Management
Financial Services
This slide analyzes the various factors impacting underwriters in the financial industry, highlighting areas such as new platforms, automation, and offshoring. It shows significant positive impacts from new technological tools and some negative effects from offshoring, useful for assessing operational and strategic changes in underwriting practices.
underwriting, technology, automation, offshoring, impact, financial services, risk management
Mixed Chart
Accenture
Saved
The slide contains pie charts showing the development in self-confidence, presentation skills, and business networking skills among program participants.
Strategic Planning
Education & Training
The slide outlines the Smart Futures program, emphasizing the development of employability skills and business mentoring for young people.
Smart Futures, employability, skills development, mentoring
Multiple Chart
EY
Saved
Slide features a column chart comparing the total shareholder return of Clorox to its peers and the S&P 500 over five years, using green and blue colors to differentiate between share price appreciation and dividends paid.
Financial Performance
Consumer Goods
Analyzes Clorox's shareholder returns from FY13 to FY18, showing how it compares to competitors and the broader market, emphasizing strong financial performance. Useful for investor relations and financial analysis.
shareholder return, financial analysis, Clorox, market comparison
Single Chart
Barclays
Saved
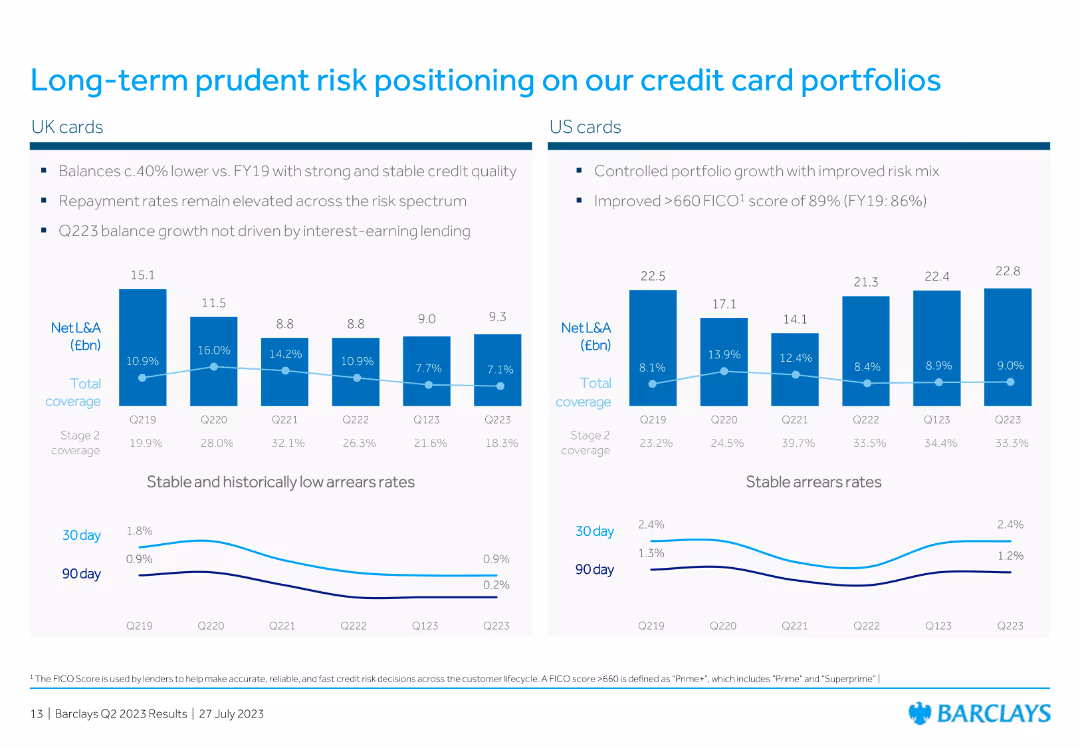
The slide contains two column charts showing net loans and advances, along with coverage rates and arrears rates for UK and US cards.
Risk Assessment and Management
Financial Services
The slide presents data on credit card portfolio risk positions for both UK and US markets, highlighting net loans, advances, and arrears rates, indicating stable risk management.
credit card, risk, portfolio, net loans, advances, arrears, UK, US, column chart, financial
Multiple Chart
Barclays
Saved
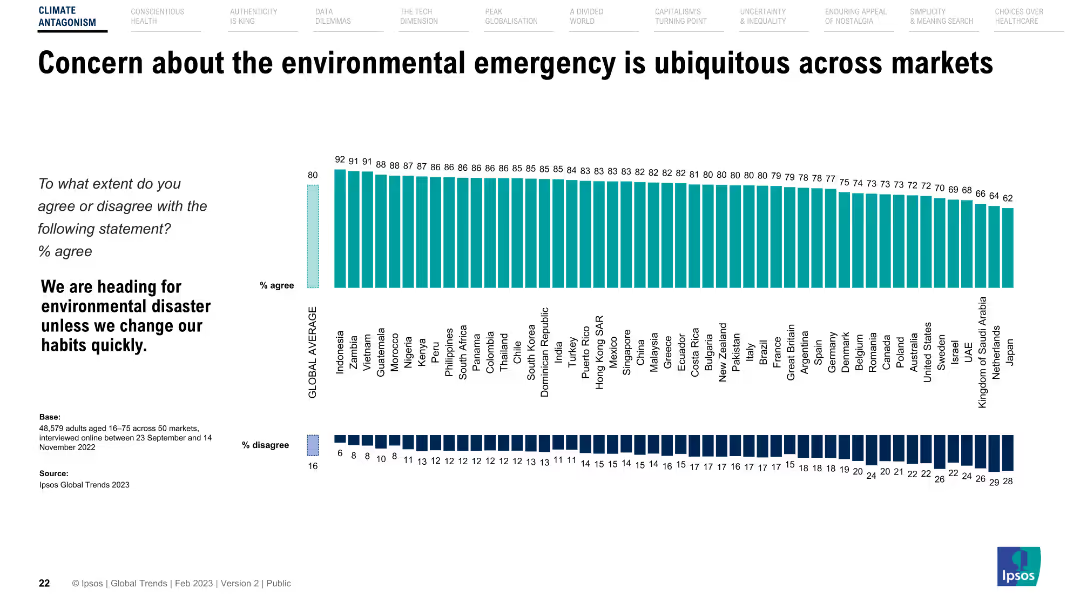
The slide features a horizontal bar chart showing agreement levels with a statement on environmental disaster across different countries.
Market Analysis and Trends
Environmental Services & Sustainability
Presents global survey data on public concern about the environmental emergency, highlighting varying levels of agreement across different countries.
Environment, concern, survey, global trends, countries
Multiple Chart
IPSOS
Saved
Features table style displaying branch consolidations, savings, deposit share gains, and new builds. Highlights key market data points.
Operational Efficiency
Financial Services
Presents a data-driven approach for optimizing the branch network to align with customer demand in various markets.
Data-Driven, Branch Optimization, Customer Demand, Market Expansion, Financial Efficiency, Savings
Table
JP Morgan
Saved
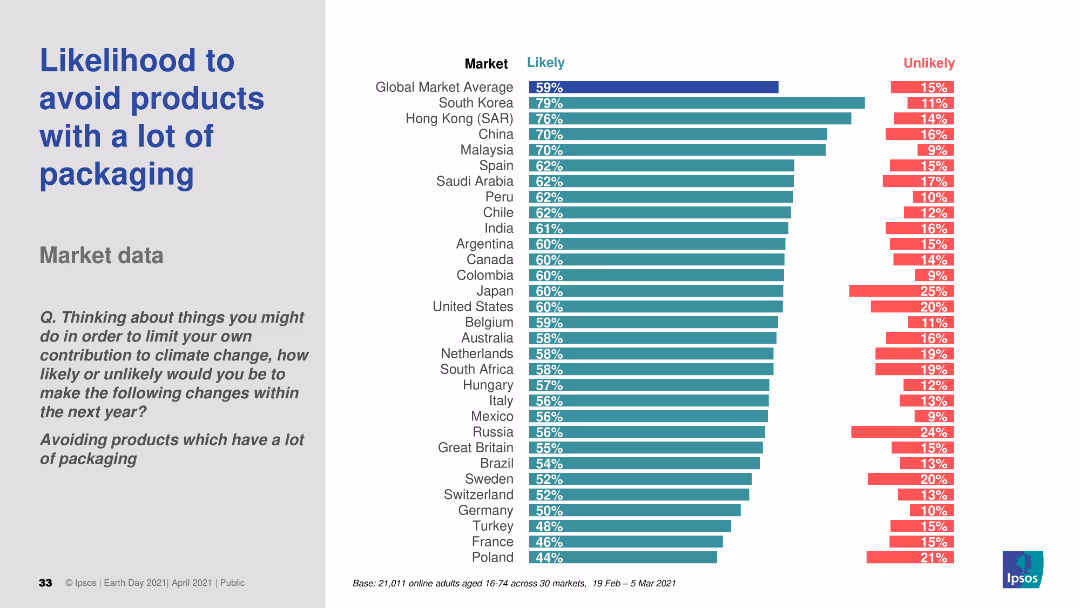
The slide features a column chart showing the likelihood of avoiding products with a lot of packaging across various markets. It uses two colors to indicate "Likely" and "Unlikely." The text includes a question and survey details.
Market Analysis and Trends
Environmental Services & Sustainability
The slide presents survey data on the likelihood of avoiding products with excessive packaging, comparing responses across different global markets.
packaging, avoidance, likelihood, survey, environmental impact
Multiple Chart
IPSOS
Saved
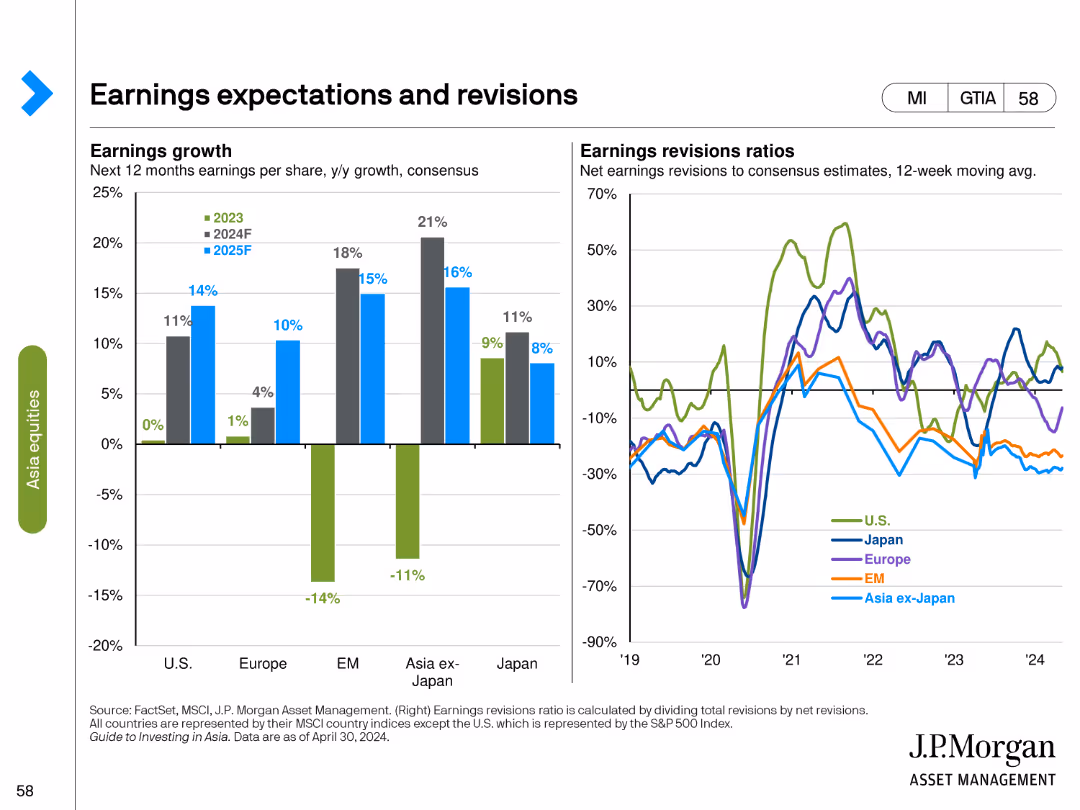
Two-column charts showing earnings growth expectations for the next 12 months and earnings revision ratios over a 12-week moving average for various regions.
Market Analysis and Trends
Financial Services
Analyzes earnings growth projections and recent revisions, providing insights into market expectations and changes in corporate earnings forecasts.
earnings growth, expectations, revisions, column charts, financial analysis, market projections, regional analysis, corporate earnings
Multiple Chart
JP Morgan
Saved
Features graphs showing the impact of AI debiasing algorithms on fairness and accuracy.
Technology and Digital Transformation
Technology & Software
Discusses the effectiveness of AI debiasing algorithms in improving fairness while balancing accuracy.
AI, debiasing, algorithms, fairness, accuracy
Multiple Chart
PwC/Strategy&
Saved
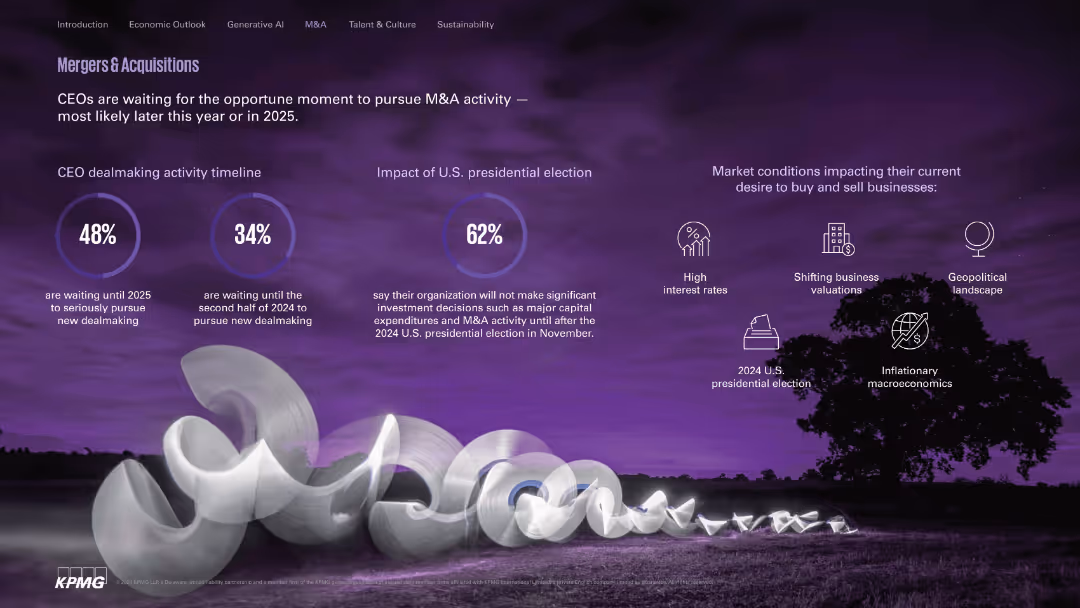
Visually dramatic layout with circular stats and icons on dark purple landscape image.
Mergers and Acquisitions
Financial Services
Outlines CEO timing for dealmaking, showing hesitancy until after the 2024 U.S. election. Identifies external factors like high interest rates and geopolitical tensions impacting M&A appetite.
M&A, dealmaking, investment timing, election, interest rates, valuations
Mixed Chart
KPMG
Saved
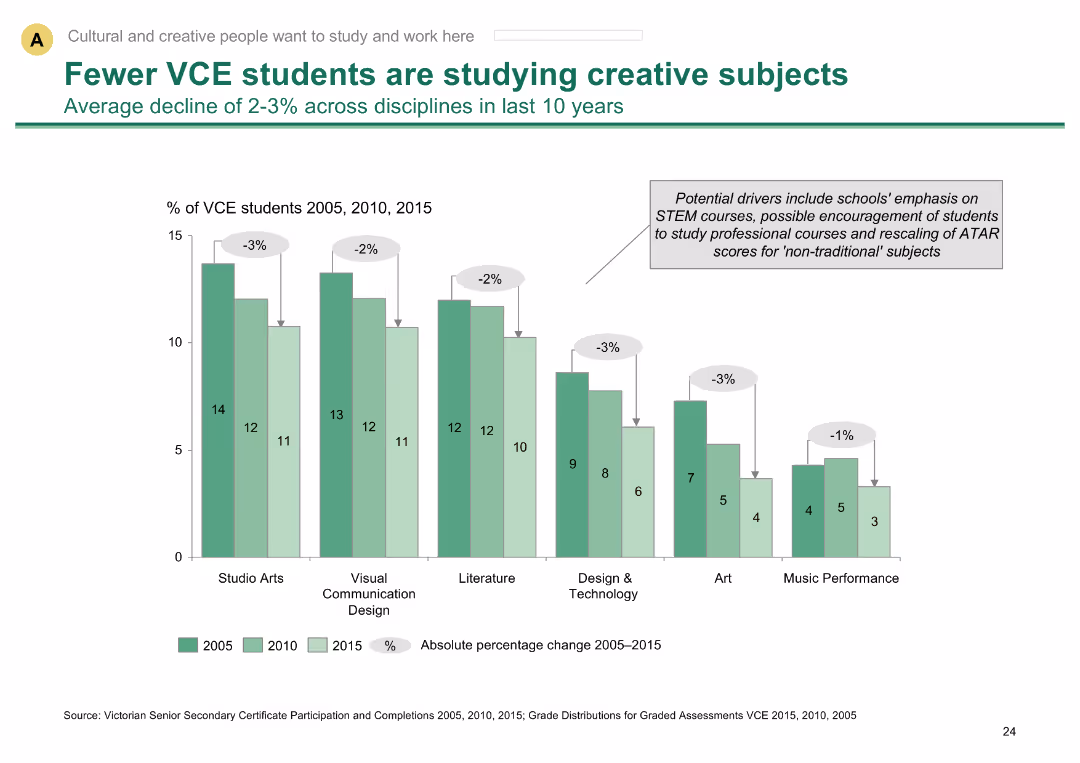
Column chart showing decline in VCE students studying creative subjects over 10 years
Market Analysis and Trends
Education & Training
Shows decline in creative subject participation among VCE students, indicating trends in education preferences
VCE students, creative subjects, education trends, participation decline, Melbourne education
Single Chart
BCG
Saved
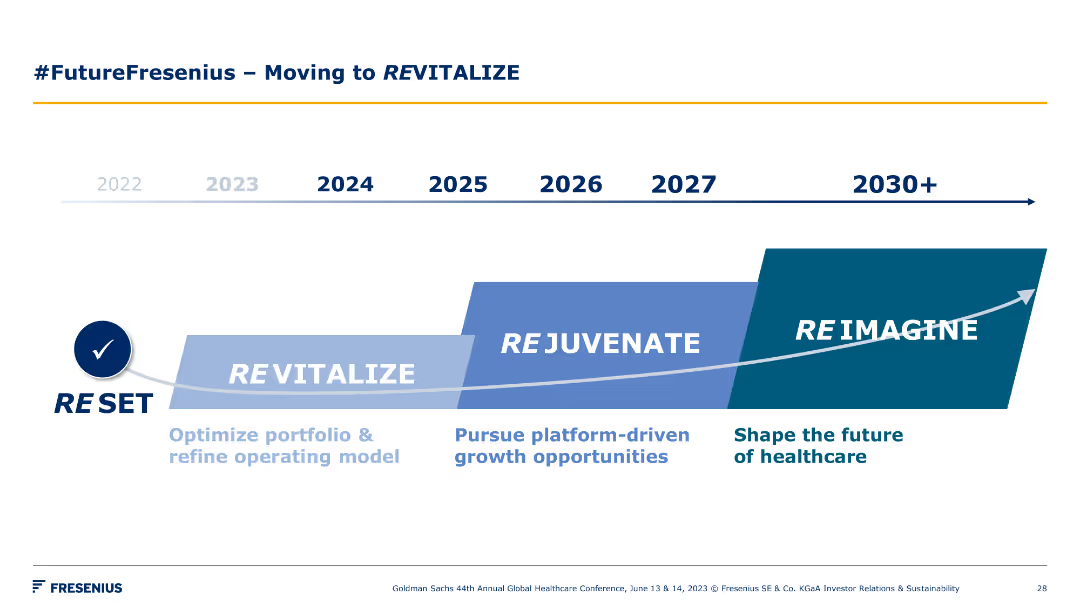
A timeline chart spanning from 2022 to 2030+, showing phases such as Reset, Revitalize, Rejuvenate, and Reimagine. Each phase is marked with key focus areas.
Strategic Planning
Healthcare & Pharmaceuticals
The slide outlines Fresenius's strategic roadmap for revitalizing, rejuvenating, and reimagining the future of healthcare through various stages and key initiatives.
timeline, revitalization, strategy, healthcare, future
Linear Flow
Goldman Sachs
Saved
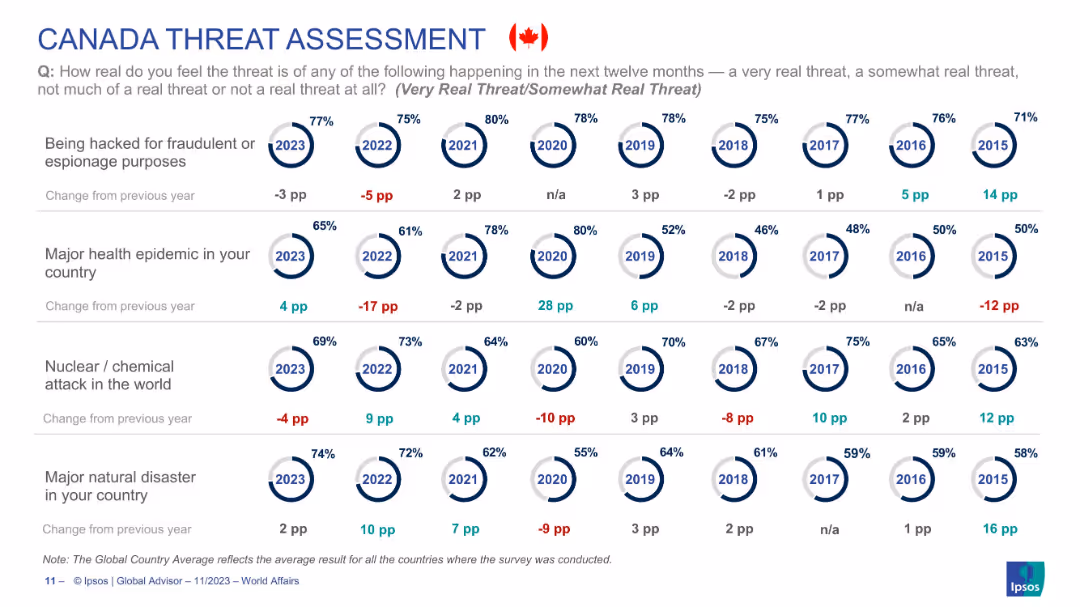
Circular year-wise risk perception visualization focused solely on Canadian public opinion across four threat types.
Risk Assessment and Management
Government & Public Sector
Reflects Canadians’ changing concern levels for hacking, health epidemics, nuclear/chemical attacks, and natural disasters from 2015–2023. Health epidemic threat rises 4pp in 2023, while hacking concerns decrease. The data highlights shifts in national sentiment toward global and domestic risks over time.
Canada, threat perception, epidemic, natural disaster, nuclear risk, cybersecurity, Ipsos, public opinion
Single Chart
IPSOS
Saved
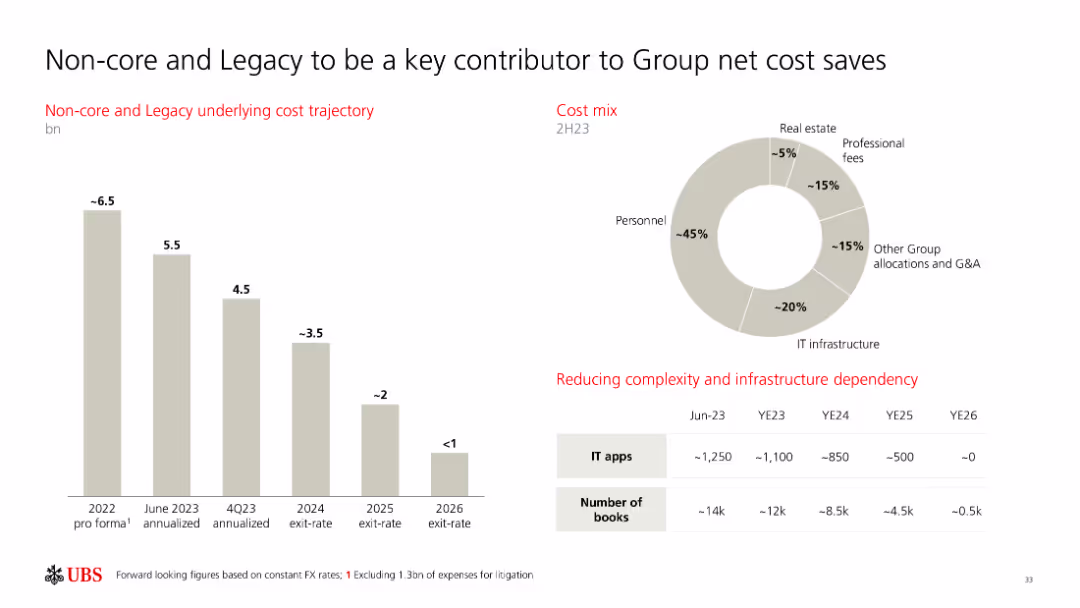
The slide includes a column chart for cost trajectory and a pie chart for cost mix, along with a table showing the reduction in complexity and infrastructure dependency.
Operational Efficiency
Financial Services
This slide outlines the contributions of non-core and legacy segments to the group’s net cost savings, highlighting cost trajectory and mix, and infrastructure reduction.
cost savings, non-core, legacy, cost mix, infrastructure
Multiple Chart
UBS
Saved
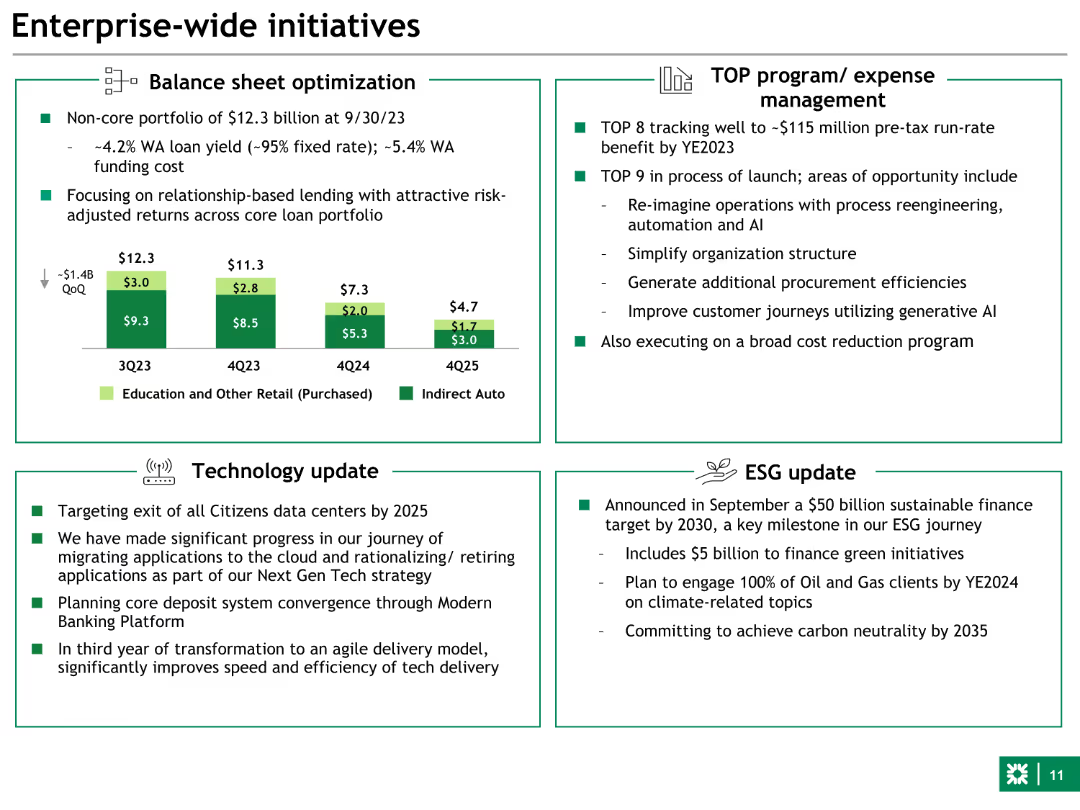
The slide contains a combination of text and a column chart. The layout is divided into four sections: Balance sheet optimization, TOP program/expense management, Technology update, and ESG update.
Strategic Planning
Financial Services
Provides an overview of key initiatives such as balance sheet optimization, expense management programs, technology updates, and ESG targets for the financial year.
Initiatives, balance sheet, ESG, technology, expense management
Mixed Chart
Goldman Sachs
Saved
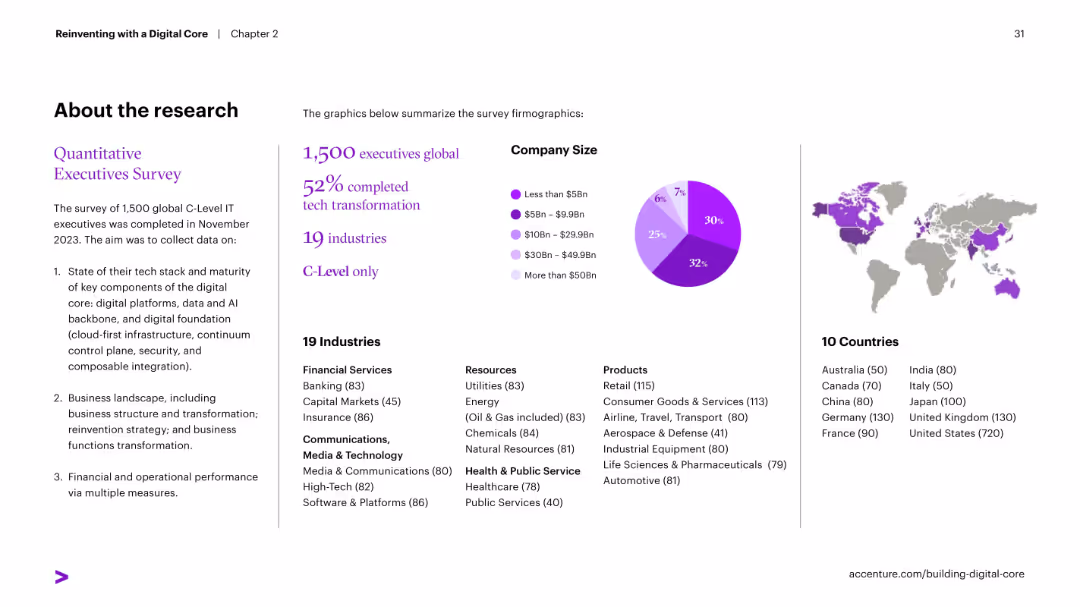
Highly visual layout summarizing the methodology: pie chart for company size, map for countries, and bullet list of industries surveyed.
Industry Overview
Technology & Software
Summarizes survey methodology and demographics. The survey covered 1,500 global C-level IT executives across 19 industries and 10 countries, offering insights into digital core maturity and transformation progress.
survey, demographics, industry coverage, C-level, research scope, transformation status
Mixed Chart
Accenture
Saved
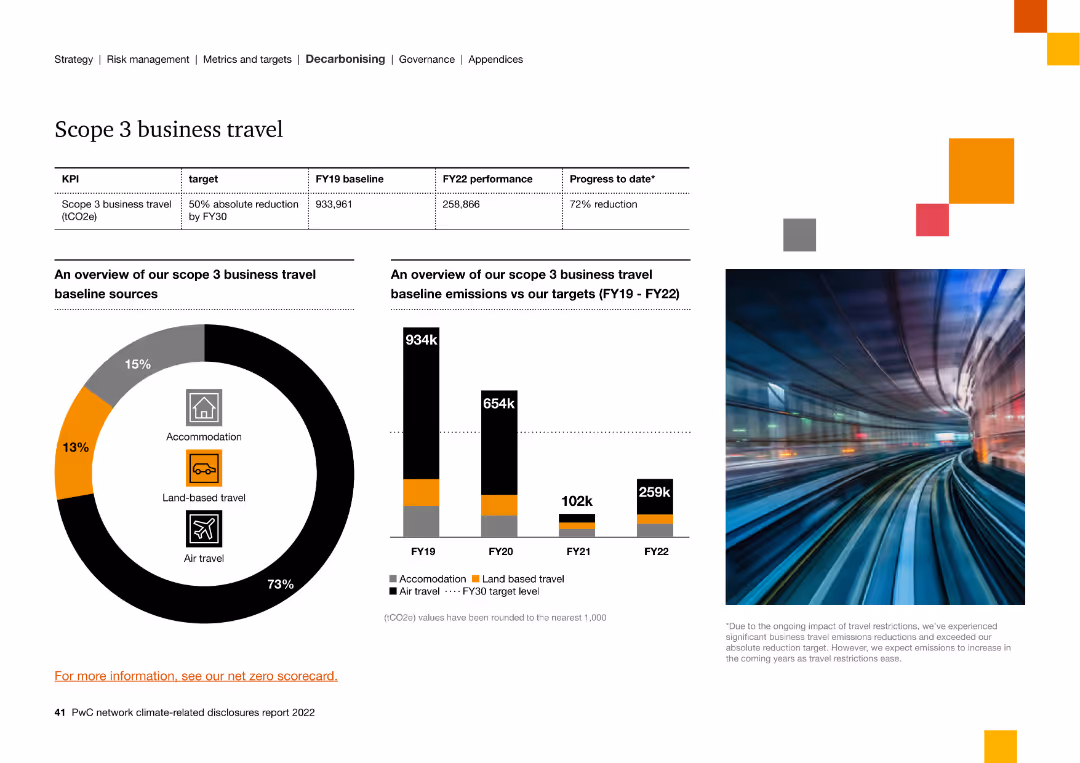
The slide features a circular graph and column charts, showing the sources and reductions of Scope 3 business travel emissions from FY19 to FY22.
Strategic Planning
Energy & Utilities
The slide provides an overview of Scope 3 business travel emissions, showing a 72% reduction target by FY30, and the breakdown of emission sources.
scope 3, business travel, emissions, reduction, sources, targets, overview
Multiple Chart
PwC/Strategy&
Saved
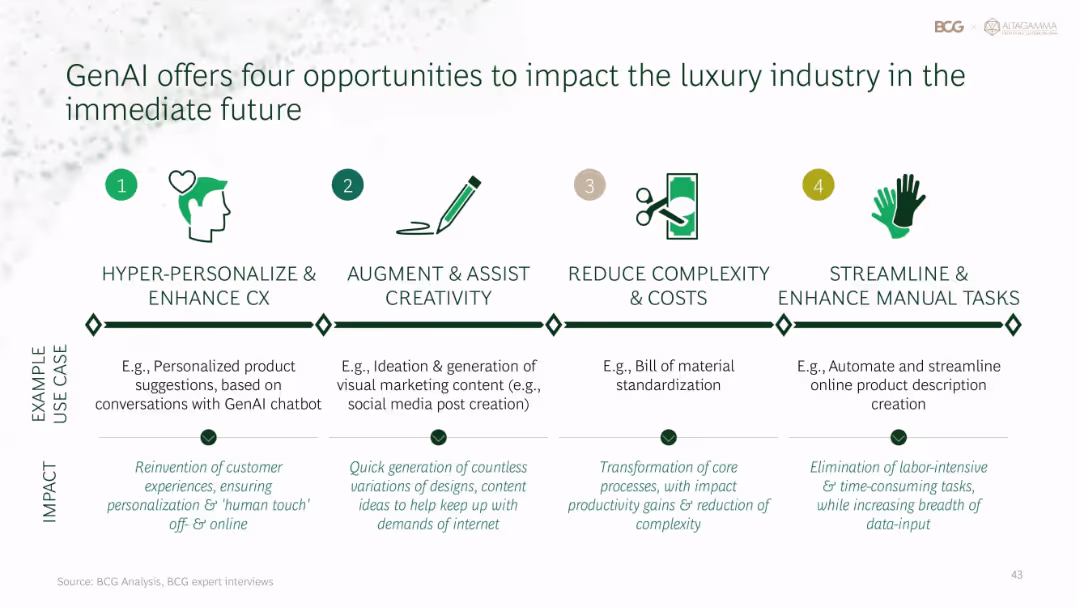
Four-column horizontal layout with icons, labels, examples, and impact text beneath each opportunity
Technology and Digital Transformation
Artificial Intelligence
GenAI can reshape luxury through: 1) hyper-personalized customer experience, 2) creativity augmentation, 3) process simplification, and 4) manual task automation. Use cases range from product recommendations to marketing content and e-commerce automation.
GenAI, luxury industry, personalization, automation, creativity, process improvement
Pillar
BCG
Saved
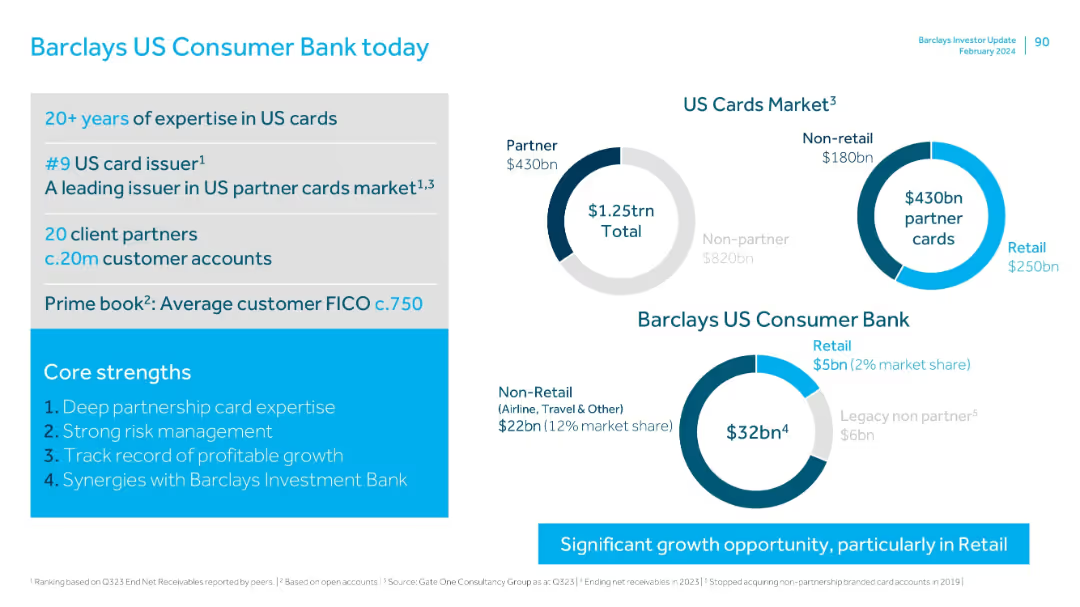
Left side shows history and customer data; right uses donut charts for market share in US cards; branding at bottom.
Industry Overview
Financial Services
Details Barclays' position in the US cards market with 20+ years of expertise, 20 million accounts, and $32bn in assets. Highlights leadership in partner cards and outlines significant growth potential, especially in retail.
US market, cards, FICO, retail, consumer, Barclays, growth opportunity
Mixed Chart
Barclays
Saved
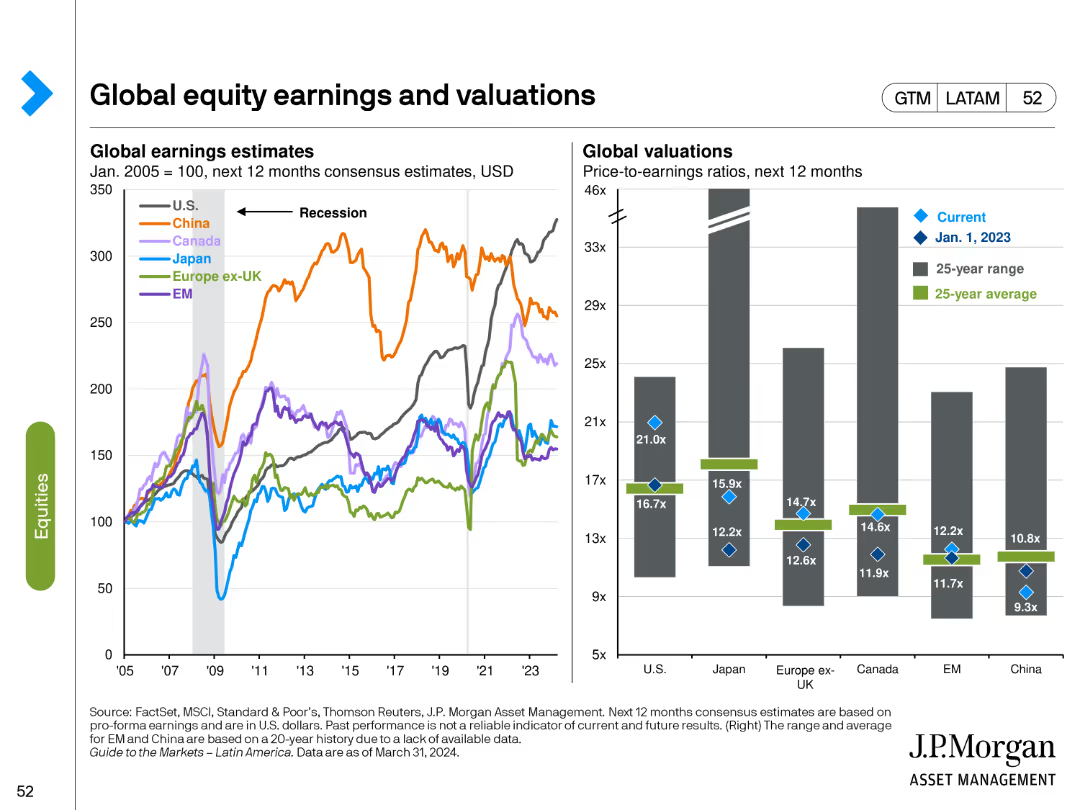
This slide includes a line chart for global earnings estimates and a bar chart for global valuations. Different colors represent various regions and time periods, highlighting trends and comparisons.
Financial Performance
Financial Services
It provides a comparison of earnings estimates and valuation metrics across global equity markets, helping to identify trends and potential investment opportunities based on relative valuations.
Global equities, earnings estimates, valuations, comparative analysis, trends
Multiple Chart
JP Morgan
Saved
Previous
Next
If nothing, comes up, please save your slides first
Create a FREE account to continue browsing
Receive Instant Access to 1,000+ slides from companies like McKinsey, Google, and Goldman Sachs
First Name
Last Name
Email
Password
I agree to all
Terms & Privacy Policy
Thank you! Your submission has been received!
Oops! Something went wrong while submitting the form.
Have an account?
Sign in
Column Chart
Heatmap
Chevron
Org Chart
Infographic
Callouts
Timeline
List
Graphic
Picture
Process Flow
Diagram
Paragraph
Map
Table
Framework
Subtitle
Takeaway Box
Icon
Other Chart
Radar Chart
Waterfall Chart
Mekko Chart
Pie Chart
Scatter Plot
Line Chart
Bar chart
Bullet points