My Account
My Slides
Search by Category
Leave Feedback
Login
Logout
Get Started
Browse all Slides
Browse Slides (Pro)
Create a FREE Account
Instant access to 1,000+ real slides from top companies like McKinsey, BCG, Goldman Sachs, Google and many more!
First Name
Last Name
Email
Password
I agree to all
Terms & Privacy Policy
Thank you! Your submission has been received!
Oops! Something went wrong while submitting the form.
Have an account?
Sign in
Saved Slides
Two sets of line charts, one on each side. Left charts represent "Labor Slack" with lines for "Labor Force," "Nonfarm Employment + Job Openings," and "Supply/Demand Gap." Right chart shows "Median Wage (12-Month Moving Average)" with wage percentiles.
Market Analysis and Trends
Financial Services
This slide analyzes labor market conditions, presenting data on employment, job openings, and median wages across different percentiles. It is useful for economic forecasts and labor market strategies.
labor market, employment, job openings, median wage
Multiple Chart
Morgan Stanley
Saved
This slide features a simple color-coded design to showcase digital imperative achievements by different countries. Each country is represented with a flag, followed by bullet points outlining key initiatives and progress in digital infrastructure, talent, and other areas. There are no complex graphics, just organized, concise text descriptions.
Industry Overview
Technology & Software
It outlines key digital strategy achievements of various countries, like Thailand's network strategy and Estonia's e-governance. Each section lists specific initiatives, reflecting on how these countries are advancing their digital infrastructures and capabilities, investing in talent, and integrating ICT into education systems to keep pace with global technological imperatives.
Digital Strategy, Global, Thailand, Australia, Estonia, Malaysia, Singapore, South Korea, ICT, Education, Infrastructure, Talent
Header Vertical
Kearney
Saved
Depicts a series of blue column charts showing annual free cash flow over time, annotated with percentages and monetary goals.
Financial Performance
Consumer Goods
Illustrates the company's ability to generate substantial free cash flow, emphasizing improvements and future goals in financial management.
free cash flow, financial growth, goals, annual, cash management
Single Chart
Barclays
Saved
The slide features a line chart comparing CAC vs. CO₂ emissions from electricity generation for various scenarios. It is detailed with clear comparative data.
Risk Assessment and Management
Energy & Utilities
Analyzes the carbon abatement cost compared to IPCC recommendations, even with a fully decarbonized electrical mix, using comparative emissions data.
carbon abatement, IPCC recommendation, decarbonized mix, electricity generation, CO₂ emissions, comparative analysis
Mixed Chart
Kearney
Saved
Features a line graph showing consumer device adoption trends over time, supplemented by a photograph of a woman using a tablet.
Market Analysis and Trends
Telecommunications
Analyzes trends in consumer adoption of various devices like smartphones and smart TVs, noting changes in adoption rates over the years.
consumer trends, device adoption, smart devices, technology usage, market analysis
Mixed Chart
Deloitte
Saved
Column chart showing change in hospital expenditure on medical devices/equipment over the past three years.
Market Analysis and Trends
Healthcare & Pharmaceuticals
This slide details the expected increase in spending on medical devices across various APAC countries.
medical devices, expenditure, APAC, healthcare, growth
Single Chart
LEK
Saved
A slide containing a mix of column charts and line graphs depicting macroeconomic indicators, with a legend explaining color coding.
Financial Performance
Financial Services
Presents macroeconomic forecasts crucial for financial and strategic planning, such as GDP growth and the CPI rate, useful for economic analysis.
macroeconomic, forecasts, GDP, CPI, banking
Multiple Chart
Citigroup
Saved
Shows a series of column charts detailing the year-to-date growth of mobile banking apps in different Southeast Asian countries, with a clear legend for reference.
Market Analysis and Trends
Financial Services
Examines the increase in app engagement among leading financial institutions across Southeast Asia, detailing user growth percentages by country.
Mobile Banking, User Growth, Financial Institutions, SEA
Single Chart
Bain
Saved
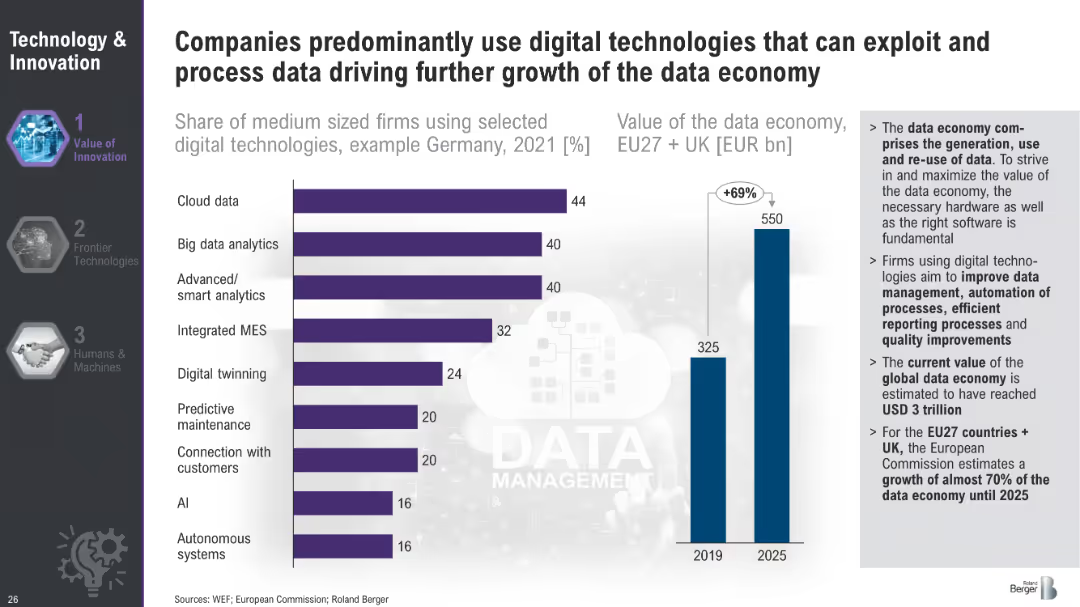
Bar chart showing the share of medium-sized firms using selected digital technologies in Germany in 2021 and a bar chart projecting the value of the data economy in the EU and UK from 2019 to 2025.
Technology and Digital Transformation
Technology & Software
This slide showcases the adoption of various digital technologies by medium-sized firms in Germany and projects the growth of the data economy in the EU and UK. It underscores the significance of digital technologies like cloud data and AI in driving economic value and efficiency.
Data Economy, Digital Technologies, Germany, EU
Multiple Chart
Roland Berger
Saved
The slide features a table with two columns and five rows, icons accompanying each row on the left. It includes bullet points.
Market Analysis and Trends
Transportation & Logistics
Describes key factors driving increased warehouse automation, such as e-commerce growth, labor shortages, and technology advances.
warehouse, automation, e-commerce, labor shortage, technology
Table
LEK
Saved
This slide displays a large, central pie chart with vibrant colors, surrounded by smaller high-quality images of buildings. The chart highlights the proportion of companies planning to invest in real estate despite market volatility, which is visually emphasized by the use of contrasting colors.
Investment Analysis
Real Estate & Construction
It captures the strategic decisions companies are making regarding real estate investments in light of inflation and interest rate changes. The chart is used to represent the distribution of different strategic choices, indicating a significant tilt towards investment, and is useful for discussions on market responses.
Investment Strategy, Real Estate, Inflation, Interest Rates, Market Trends
Single Chart
EY
Saved
Circular diagram showing factors interconnected with business model innovation and column charts projecting global retail e-commerce sales and its share of total retail sales from 2015 to 2024.
Technology and Digital Transformation
Technology & Software
This slide explores the dynamics of business model innovation within Industry 4.0, highlighting factors such as digital communications and emerging markets. It projects significant growth in global retail e-commerce sales and its increasing share of total retail sales, indicating a shift towards online business models.
Business Model Innovation, E-commerce, Industry 4.0
Mixed Chart
Roland Berger
Saved
Contains three stacked bar charts comparing openness about gender and sexual orientation in the workplace.
Human Resources and Talent Management
Professional Services
Discusses visibility and openness about gender and sexual orientation at work, offering insights into workplace diversity challenges.
gender, sexual orientation, workplace, diversity, inclusion
Multiple Chart
BCG
Saved
This slide uses column charts to illustrate past and projected shareholder distributions, emphasizing growth in dividends with a clean, professional layout.
Financial Performance
Financial Services
Illustrates Deutsche Bank's historical and future shareholder distribution plans, emphasizing increased dividends and buy-backs.
Shareholder, dividends, Deutsche Bank, distribution, growth, financial planning, buy-backs
Multiple Chart
Deutsche Bank
Saved
This slide shows a combination of text and a column chart. The text explains the rationale for outsourcing, and the chart lists various capabilities being outsourced by percentage.
Operational Efficiency
Financial Services
The slide describes how APAC family offices are outsourcing capabilities like tax, risk, and technology to manage external demands and improve in-house capabilities.
outsourcing, capabilities, APAC, family offices, external expertise
Mixed Chart
EY
Saved
This slide contains a bar graph showing weighted average year-to-date local currency shareholder returns by industry, with varying bar widths representing market cap sizes. It has a clear title, a source line, and annotations for data points.
Market Analysis and Trends
Financial Services
The slide presents market capitalization trends across various industries, indicating a decline with varying degrees. It serves to compare sectors and provide insights into the economic impact on market values.
Market capitalization, Industry comparison, Shareholder returns, Economic trends, Data analysis
Single Chart
McKinsey
Saved
Includes bar graphs and pie charts analyzing the internet coverage and connectivity needs across Indonesian districts, focusing on school connectivity.
Strategic Planning
Telecommunications
Discusses potential strategies for improving internet coverage and network quality in Indonesian schools, essential for enhancing educational outcomes.
internet coverage, network quality, Indonesia, schools, connectivity improvement, educational outcomes
Multiple Chart
BCG
Saved
The slide presents a simple two-column comparison of actions and future directions with respect to the client franchise in FICC and Equities. A dark theme with white and blue text highlights the top 100 clients' attributes and planned actions.
Sales and Business Development
Financial Services
It discusses strategies for strengthening client relationships in FICC and Equities, appropriate for discussions on client management and business development.
Client franchise, FICC, Equities, growth plan
Table
Goldman Sachs
Saved
This slide displays multiple tables and a bar chart detailing financial statistics such as revenues, deposits, and loans, categorized by business sector.
Financial Performance
Financial Services
Reviews the performance of Deutsche Bank's Corporate Banking sector, detailing earnings, expense management, and resource allocation for Q3 2023.
corporate banking, revenue analysis, financial performance, deposits, loans
Mixed Chart
Deutsche Bank
Saved
The slide presents a column chart comparing average 2022 costs by technology, including CDPs, identity solutions, DMPs, CMPs, and DCRs, with costs ranging from $376K to $437K.
Technology and Digital Transformation
Technology & Software
The slide outlines the compounded costs of using data clean rooms (DCRs) alongside other privacy-preserving technologies, showing the potential for annual costs to exceed $2 million.
DCR costs, privacy technologies, annual costs, financial
Mixed Chart
IPSOS
Saved
The slide displays horizontal bar charts with data points and forecast ranges for GDP growth in multiple countries from 2020 to 2021.
Market Analysis and Trends
Financial Services
Focuses on GDP growth forecasts versus baseline for different countries, projecting economic downturns and recoveries with forecast ranges and baseline comparisons.
GDP, forecast, economic downturn, baseline, 2020, 2021, recovery
Multiple Chart
BCG
Saved
This slide presents a structured list with the table of contents for the ESG report, detailing different sections such as leadership, business, and approaches to ESG.
Regulatory and Compliance
Professional Services
The table of contents for the 2022 ESG report, outlining key sections and page numbers, functioning as a navigational guide for readers.
Contents, ESG, Sections, Structure, Professional
Agenda
Booz Allen Hamilton
Saved
Displays a split bar chart contrasting online and offline penetration in grocery vs. non-grocery e-commerce, accompanied by explanatory text.
Market Analysis and Trends
Retail & E-commerce
This slide identifies online grocery as a relatively untapped segment within e-commerce, presenting it as an area ripe for growth and innovation. It might be used to argue for investment in online grocery platforms or to inform strategic moves within the retail sector.
Online Grocery, E-commerce, Opportunity
Mixed Chart
Bain
Saved
Line graphs showing app usage over time, bar charts showing daily mobile time usage per app
Market Analysis and Trends
Technology & Software
Examines luxury consumers' app usage patterns, highlighting preferred platforms
Luxury, Consumer Behavior, Apps, Usage Patterns
Multiple Chart
BCG
Saved
The slide features a dartboard chart and bar graphs representing the various actions CEOs are taking to reconfigure supply chains and source local alternatives.
Operational Efficiency
Transportation & Logistics
The slide highlights the strategies CEOs are employing to reconfigure supply chains and find local alternatives to mitigate disruptions.
supply chains, local alternatives, disruptions, reconfiguration, CEO strategies
Mixed Chart
EY
Saved
Previous
Next
If nothing, comes up, please save your slides first
Create a FREE account to continue browsing
Receive Instant Access to 7,500+ of the internet's best slides
First Name
Last Name
Email
Password
I agree to all
Terms & Privacy Policy
Thank you! Your submission has been received!
Oops! Something went wrong while submitting the form.
Have an account?
Sign in
Column Chart
Heatmap
Chevron
Org Chart
Infographic
Callouts
Timeline
List
Graphic
Picture
Process Flow
Diagram
Paragraph
Map
Table
Framework
Subtitle
Takeaway Box
Icon
Other Chart
Radar Chart
Waterfall Chart
Mekko Chart
Pie Chart
Scatter Plot
Line Chart
Bar chart
Bullet points