My Account
My Slides
Search by Category
Leave Feedback
Login
Logout
Get Started
Browse all Slides
Browse Slides (Pro)
Create a FREE Account
Instant access to 1,000+ real slides from top companies like McKinsey, BCG, Goldman Sachs, Google and many more!
First Name
Last Name
Email
Password
I agree to all
Terms & Privacy Policy
Thank you! Your submission has been received!
Oops! Something went wrong while submitting the form.
Have an account?
Sign in
Saved Slides
Includes a bar graph depicting changes in human freedom scores, alongside detailed text explanations and a shaded world map, highlighting regions and relevant statistical data.
Market Analysis and Trends
Government & Public Sector
Analyzes trends in global human freedom over a decade, discussing implications for future shifts in political and civil rights, providing a basis for discussions on policy and societal change.
freedom, global trends, policy, civil rights, political rights, data, future, analysis, implications
Mixed Chart
Roland Berger
Saved
Features a complex diagram showing the interconnected elements of the procurement value chain, including arrows and blocks.
Strategic Planning
Professional Services
Explains the complexity and interconnectedness of modern procurement value chains with detailed breakdowns of each element.
procurement, value chain, complexity, interconnected, diagram, analytics, management, strategy, operations
Diagram
Kearney
Saved
Slide with lists comparing the perceived safety of various transportation modes in terms of health risks during a crisis.
Market Analysis and Trends
Transportation & Logistics
Highlights shifts in transportation mode preferences due to health safety concerns.
transportation, health risks, safety, mode choice, crisis
Table
McKinsey
Saved
A roadmap slide detailing the pivot approach for growing, transforming, and scaling service businesses. The slide uses a horizontal timeline to map focus areas and activities across three phases: Grow the Core, Transform the Core, and Scale the New.
Strategic Planning
Professional Services
This slide outlines a strategic pivot roadmap for service businesses, mapping key focus areas and activities across different phases to achieve growth, transformation, and scaling.
roadmap, strategic planning, growth, transformation, scaling
Table
Accenture
Saved
Features images of a digital banking interface, application components, and text descriptions on the side.
Technology and Digital Transformation
Technology & Software
Details J.P.Morgan's new product development for embedded banking, emphasizing speed and user experience.
Embedded Banking, Product Development, User Experience, J.P.Morgan, Digital Onboarding
Header Horizontal
JP Morgan
Saved
The slide features a column chart illustrating the decrease in RWA from 2023 to 2026, with annotations on key factors like Basel III finalization and balance sheet optimization.
Risk Assessment and Management
Financial Services
This slide presents the forecasted reduction in risk-weighted assets (RWA) due to optimization and non-core and legacy (NCL) unwind, detailing the impact of Basel III finalization.
RWA, optimization, Basel III, NCL, 2026
Mixed Chart
UBS
Saved
A comparative slide with two graphs. The first graph shows 'High yield loans vs. US HY bond, trailing 12m total return,' comparing two line trends. The second graph 'Warming up to emerging market debt as yield premia increase,' compares 'EM USD Agg yield' and 'EM USD HY yield' with a dual-axis for yield percentage and timeline. The slide uses shades of purple and green to distinguish different data sets.
Market Analysis and Trends
Financial Services
This slide examines preferences in fixed income investments, expressing a favorable view towards variable rate loans, TIPS, and emerging market (EM) debt, contrasting them with a negative view on fixed income from Europe, Japan, and areas with negative nominal yields. It provides total return trends for US leveraged loans versus high yield bonds and an analysis of yield premia trends in emerging markets, indicating changing investment sentiments.
fixed income, variable rate loans, TIPS, EM debt, yields, total return, investment preferences, market trends
Multiple Chart
Citigroup
Saved
Bar chart showing brand-switching percentages for non-essentials and essentials.
Customer and Market Segmentation
Retail & E-commerce
Provides a detailed look at brand-switching behavior, particularly in non-essential categories.
brand-switching, consumer behavior, essentials, non-essentials, retail
Single Chart
Bain
Saved
This slide contains column charts and bullet points. Charts illustrate the growth in security data processed, application vulnerability scanning, and devices secured from 2019 to 2022. The color scheme is teal and dark blue, with each point accompanied by a relevant icon.
Financial Performance
Financial Services
Details the bank's cybersecurity measures and investments, underscoring consistent efforts despite increased demand and evolving threats.
Cybersecurity, Risk Management, Technology, Data Protection, Financial Services, Investment, Device Security
Multiple Chart
JP Morgan
Saved
A treemap chart displaying market sizes of private K-12 education in key cities globally, segmented by fee points.
Market Analysis and Trends
Education & Training
Illustrates the market size for private K-12 education with high fee points across key cities worldwide.
market size, K-12, fee point, private, global
Mixed Chart
LEK
Saved
Contains a variety of graphical elements including bar charts showing economic impact over time, diagrams outlining applications of urban monitoring, and key points in text format. The layout is designed for clarity and focus on data-driven insights.
Strategic Planning
Environmental Services & Sustainability
This slide provides an overview of the economic and strategic benefits of urban monitoring using Copernicus services. It discusses revenue opportunities for service providers and benefits for end users, highlighting the application in urban planning and risk management.
urban monitoring, Copernicus, economic impact, strategic benefits, data services
Mixed Chart
PwC/Strategy&
Saved
The slide includes a column chart showing the distribution of happiness scores on a scale of 0-10, comparing data from May and December. Key scores and mean scores are highlighted in text boxes.
Customer and Market Segmentation
Healthcare & Pharmaceuticals
This slide presents survey results on happiness scores, showing the distribution of scores on a scale of 0-10, comparing May and December data, with a focus on mean scores.
happiness, survey, scores, comparison, distribution, column chart, public opinion, time periods, healthcare
Single Chart
IPSOS
Saved
Line chart comparing cumulative shareholder returns of Eaton, S&P 500, and a peer group from 2000 to 2019, with color-coded lines on a green gradient background.
Investment Analysis
Financial Services
Analyzes Eaton's performance in shareholder returns compared to broader market indices and a peer group, useful for investors and financial analysts.
shareholder returns, Eaton, investment, financial analysis
Single Chart
Deutsche Bank
Saved
A final slide in the disruption series, maintaining a consistent design with the previous slides. The text is organized in two columns, complemented by simple tech iconography. The white, blue, and black color scheme keeps the focus on the content.
Strategic Planning
Technology & Software
Concluding the series on technology-driven disruptions, this slide summarizes the transformative effects on strategy, organization, and operations, providing a high-level view of the strategic considerations necessary to navigate the evolving tech landscape. It is intended for presentations that aim to synthesize and summarize key points from a detailed discussion on cross-industry technological impacts.
Technology, Disruption, Strategy, Summary, Transformative, Organization, Operations, Considerations
Header Vertical
McKinsey
Saved
The slide presents a balanced combination of text, icons, and a Venn diagram. The icons represent different business areas, while the diagram depicts the intersection of energy policies and current events.
Industry Overview
Energy & Utilities
This slide offers an overview of Seatruim's strategic focus on offshore renewables, new energy, and cleaner solutions, utilizing a Venn diagram to illustrate market positions and energy policy impacts. It could be used to outline the company's market strategy in the energy sector.
Energy, Renewables, Transition, Strategy, Market, Offshore
Pillar
Morgan Stanley
Saved
Contains a process diagram of dark fermentation, supported by text descriptions of the biochemical reactions involved, along with pros, cons, and key feature estimates.
Technology and Digital Transformation
Energy & Utilities
Describes dark fermentation as a method of hydrogen production from organic matter, detailing the biochemical reactions, process steps, and advantages and disadvantages.
Hydrogen, dark fermentation, biochemical reactions, organic matter, production process
Diagram
Kearney
Saved
The slide uses a split design with a gray-blue color scheme. It contains icons, flowchart elements, and numerical data highlighting key risk management areas.
Risk Assessment and Management
Financial Services
Emphasizes the critical nature of risk and control management in finance, detailing operational security, legal, and compliance structures.
risk management, control, compliance, security, finance, operational resilience, KYC, AML
Framework
JP Morgan
Saved
Featuring a split layout with text on the left, this slide emphasizes the need for comprehensive government and private-sector collaboration. Icons and text on the right segment highlight roles and collaboration efforts in areas like "Digital infrastructure" and "Consumer education."
Strategic Planning
Technology & Software
This slide discusses strategies for a comprehensive approach to digital economy potential through government and private sector collaboration, covering connectivity, regulation, talent, and capital access. The layout aims to inform about collaborative roles and tasks necessary for a robust digital infrastructure.
government, private sector, collaboration, strategy, digital, infrastructure
Header Vertical
Kearney
Saved
Features a concentric circle diagram highlighting six capability measures of operations maturity essential for integrating AI and new technologies.
Technology and Digital Transformation
Technology & Software
Discusses the foundational to advanced operational capabilities required for embedding AI in business processes, emphasizing data and automation, AI integration, and best practices.
AI, technology, capabilities, automation, integration
Table
Accenture
Saved
The slide outlines key strategies for leaders in sales and marketing, advocating for a customer-first approach and integration across functions with vibrant graphics and a clear layout.
Technology and Digital Transformation
Retail & E-commerce
Encourages leaders to personalize customer journeys and reinvent sales channels to stay competitive in
Vertical Flow
BCG
Saved
White background with line charts showing the cost of abatement and offsets across sectors. Quotes and text blocks explain the impact on businesses.
Financial Performance
Environmental Services & Sustainability
Discusses how businesses will manage and pass on the costs of emissions reductions, including the use of offsets.
cost pass-through, emissions reduction, business impact
Multiple Chart
EY
Saved
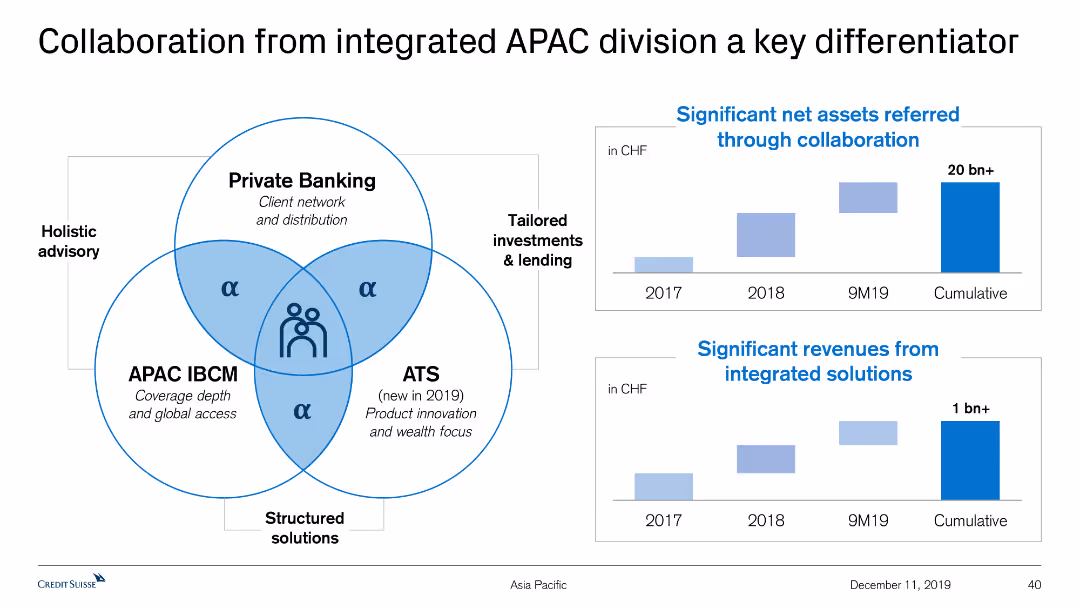
This slide features a Venn diagram illustrating the collaboration among Private Banking, APAC IBCM, and ATS. It also includes two column charts displaying net assets and revenues.
Strategic Planning
Financial Services
The slide explains the synergy between Private Banking, APAC IBCM, and ATS to deliver holistic advisory and tailored solutions, with significant assets and revenue growth data.
Collaboration, APAC, Private Banking, Revenue Growth, Net Assets
Multiple Chart
Credit Suisse
Saved
Provides detailed demographics of survey respondents using pie charts, column and bar charts, set against a simple background to enhance readability.
Human Resources and Talent Management
Professional Services
Details the demographics and parameters of a global survey concerning AI, including roles, company revenue, and employee count.
survey, demographics, global, AI, respondents
Multiple Chart
BCG
Saved
A comparative chart illustrates sector shares between venture capital investing and equity market capitalisation. The visual elements highlight the disproportionate share attracted by the technology sector.
Investment Analysis
Technology & Software
This slide offers a comparative analysis between the venture investing and equity market capitalization across various sectors from 2013 to 2017. It underscores the technology sector's ability to attract a larger share of venture investments relative to its market capitalization, suggesting a higher investment activity within the sector.
venture capital, technology sector, market share, investment, equity capitalization
Mixed Chart
Oliver Wyman
Saved
Contains a line chart showing the change in consumer sentiment about COVID-19 over time in the US and emerging markets. The layout is simple with clear labels and a contrasting color scheme for clarity.
Market Analysis and Trends
Healthcare & Pharmaceuticals
Discusses changes in consumer confidence in the US and emerging markets due to the COVID-19 Delta variant, using survey data to illustrate perceptions over time and expectations for economic recovery.
COVID-19, Delta Variant, Consumer Sentiment, Markets
Mixed Chart
BCG
Saved
Previous
Next
If nothing, comes up, please save your slides first
Create a FREE account to continue browsing
Receive Instant Access to 7,500+ of the internet's best slides
First Name
Last Name
Email
Password
I agree to all
Terms & Privacy Policy
Thank you! Your submission has been received!
Oops! Something went wrong while submitting the form.
Have an account?
Sign in
Column Chart
Heatmap
Chevron
Org Chart
Infographic
Callouts
Timeline
List
Graphic
Picture
Process Flow
Diagram
Paragraph
Map
Table
Framework
Subtitle
Takeaway Box
Icon
Other Chart
Radar Chart
Waterfall Chart
Mekko Chart
Pie Chart
Scatter Plot
Line Chart
Bar chart
Bullet points